

Analys
SHB Råvarubrevet 3 maj 2013

 Råvaror allmänt
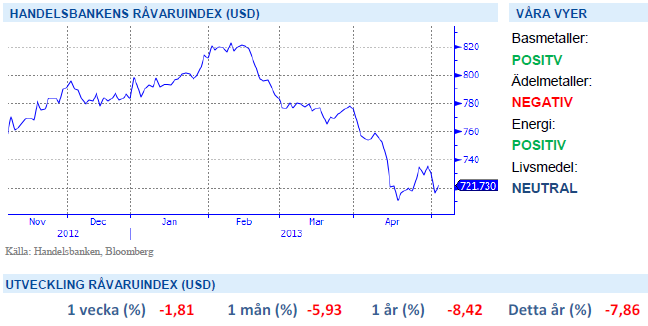
Råvaror fortsatt under press, men det finns skäl att vara positiv
Vågen av sämre än väntat makroekonomisk data fortsätter och har satt ytterligare press på råvarorna. Under veckan kom bland annat inköpschefsindex för april månad från USA och Kina. Till skillnad från tidigare veckor under mars och april så ser vi nu tydliga tecken på att råvarorna rekylerar kraftigt dagen efter att de blivit nersålda till tonerna av sämre makrodata. Realekonomin har trots allt inte försämrats så dramatiskt även om indikatorer har fallit ut sämre än förväntansbilden.
Ett skäl att vara mer positiv är att både FED och ECB denna vecka sagt eller indikerat att riskerna i ekonomin fortfarande är på nedsidan varför osäkerheten om att centralbankerna skulle minska sitt stöd till marknaden har minskat. ECB sänkte räntan under veckan enligt förväntansbild och kan sänka depositräntan till under 0 % redan i sommar. I takt med att förväntansbilden nu håller på att justeras ner så kommer också makrodata framöver att te sig bättre. Veckans positiva vindar kom i form av bättre än väntad jobbdata från USA både i torsdagens jobbless claims och i fredagens nonfarm payrolls.
Basmetallerna
Både ner och upp under veckan
Basmetallerna föll kraftigt inledningsvis under veckan som konsekvens av sämre inköpschefsindex i Kina och USA. Kinas metallhandlare hade dessutom ledigt vilket fick västerländska aktörer fria händer att handla ner metallerna, som alla föll ca 5 %. När kineserna kom tillbaka under fredagen studsade metallerna åter upp, vilket tyder på att kinesiska köpintresse är starka på dessa nivåer. Starka sysselsättningssiffror från USA gav ytterligare skjuts och basmetallarna steg på bred front under fredag eftermiddag.
Nickel har haft ytterligare ett ras under veckan men är nu väldigt billigt jämfört med produktionskostnaden som ligger uppe på 16-17 000, jämfört med dagens pris på strax över 15 000 USD/ton. Just nu är det dock ont om dem som vågar köpa på sig basmetaller trots att de ser riktigt billiga ut.
Vi tror att metallerna kommer fortsätta att ha det motigt i den rådande svaga makromiljön men har stor potential inför hösten från dagens låga nivåer.
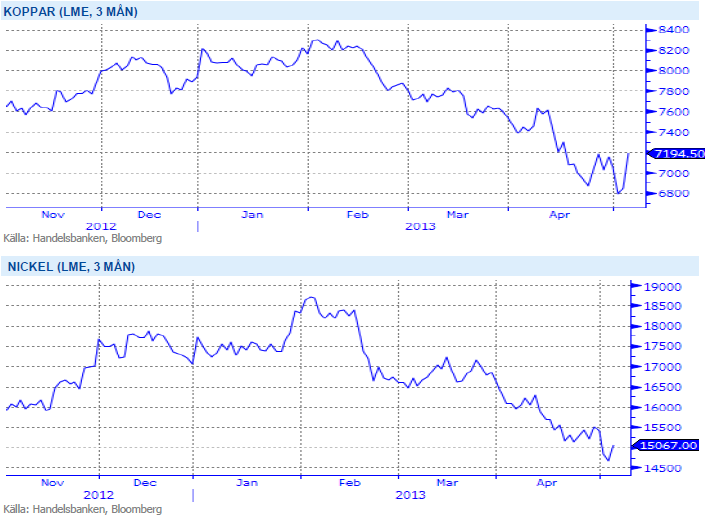
Trots fortsatt svag makromiljö och fortsatt risk på nedsidan ser vi ändå basmetaller som köpvärda på dessa nivåer. Vi tror på: LONG BASMET H
Ädelmetaller
Vi håller fast vid vår vy – guldet ska ner
En vecka med mjuka makrosiffror och en räntesänkning från ECB, tätt inpå det kraftiga guldras vi såg nyligen borde ha skickat guldpriset rejält uppåt. Detta har dock inte hänt, de högsta nivåerna denna vecka har varit exakt desamma som de högsta nivåerna förra veckan.
När nu denna vecka går mot sitt slut och vi kröner den med något starkare arbetslöshetssiffror från USA får vi ett bra test på guldets eventuella svaghet eller styrka. Ett initialt fall från 1480 dollar per uns ner till 1460 är det enda vi sett ännu, och intressant blir det först om vi antingen tar nya highs för veckan över 1500 dollar, alternativt nya lows under 1440 dollar.
Vår vy är vid detta laget väl känd, vi tror inte på annat än kortsiktig uppsida, och den känsliga sidan är alltjämt nedsidan.
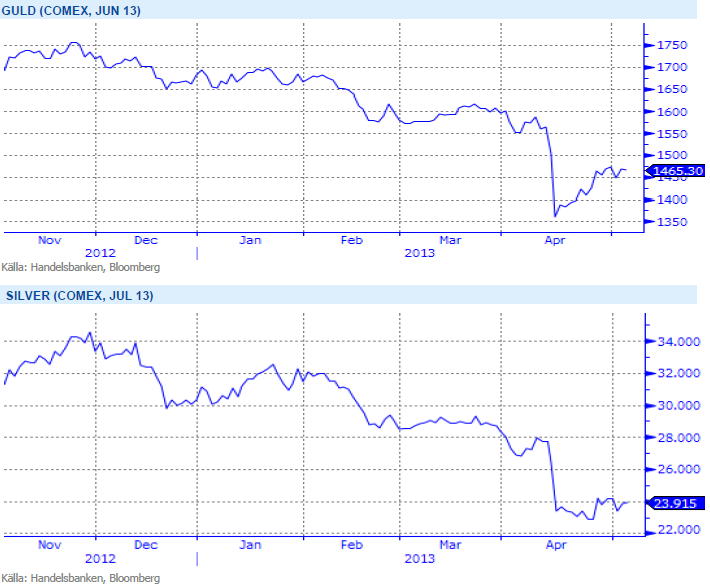
Trots det största raset på 30 år tror vi att förtroendet för guld håller på urholkas och att trenden nedåt fortsätter. Vi tror på: SHRT GULD H
Energi
Förbättrad energibalans!
Elpriset föll under veckan med nästan 3 % (Q3 13) och vi förväntar oss fallande kurser de närmaste dagarna med någon euro eller två för Q313. Bränslekomplexet och kol i synnerhet är fortsatt under press då utbudet av energikol på exportmarknaden överträffar förväntningarna. Detta beror främst på en god tillgång på gas som i sin tur ger USA tillgång till billig el och mindre behov av den lokala kolen. Ser man till kostnaden för att bryta kol, dvs diesel och arbete, ger den dock stöd för kol på dessa lägre nivåer och dessa faktorer lär inte heller ge vika på lite längre sikt. Väderprognoserna pekar däremot återigen mot en våt avslutning och energibalansen ser nu ut att förbättras till -14.35 TWh från -24 TWh där vi var för två veckor sedan.
Ser vi till utsläppsrätterna steg priset under fredagen med dryga 16 % efter uttalande från Merkel om att backloadningplanen är nödvändig för att utvecklingen inte ska gå åt fel håll. Marknaden har även fått stöd under veckan då sista köparna täcker sina behov för att klara sina leveransåtaganden och undvika en straffavgift om 100 euro per ton. Vi förväntar oss att utsläppsrätterna handlas vidare på dessa låga nivåer i väntan på ett eventuellt försök från EU Kommissionen att återuppliva EU ETS (eller i alla fall hoppet om EU ETS framtid).
Oljan (brent) har följt med makrodata under veckan, ner under 100 efter PMI siffror för att senare stärkas efter positiv jobbdata och handlas nu över 104 USD/fat. Ryssland ökar sin produktion under april med 1,5 % y-o-y till 10,47 miljoner fat per dag och president Putin kräver att produktionen ska upprätthållas över 10 miljoner fat per dag. Vi behåller vår positiva vy för denna sektor.
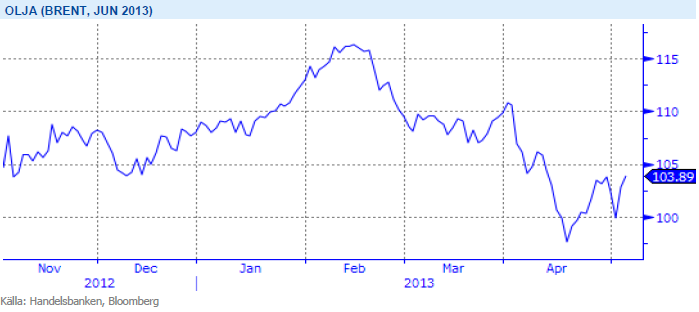
OPEC har tidigare aktivt och framgångsrikt försvarat prismålet 100-110 USD och vi väntar oss handling snarare än besked från kartellen inom kort. Konfliken mellan Israel och Iran är nästa skäl att förvänta sig högre oljepriser under H2. Vi tror på: LONG OLJA H
Livsmedel
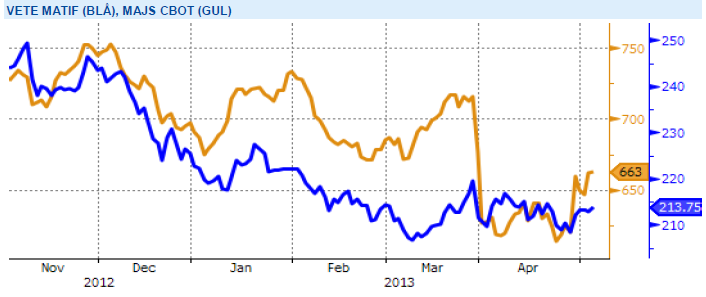
Ännu ingen panik för majssådden
Priserna på majs i Chicago har gått upp kraftigt under veckan (vilket även drog upp vetepriset) det främst som följd av fortsatt fördröjning för den amerikanska majssådden. Resterande del av veckan ser ut att vara kall och även innehålla ytterligare lite nederbörd. Nästa vecka ser dock, i alla fall för tillfället, ut att bjuda på både varmare och torrare väder. Den 10:e maj benämns ofta som ett viktigt datum för den amerikanska majssådden, sådd efter det brukar innebära lägre avkastningspotential med omkring 1 bushel per acre för varje dag. I kommande måndags rapport från USDA bör inte sådden ha nått så mycket mer än 20 procent avklarat – med få dagar kvar till 10:e maj. Förbättrat väder kan dock förändra situationen snabbt, år 2001 sådde t.ex. den viktiga delstaten Indiana 50 procent av majsarealen på bara en vecka. Än tycker vi därför att paniken kan vänta ett tag till – genomsnittliga avkastningen för åren 2007-2011 är 154 bushels per acre, vi bör således ännu vara väldigt långt ifrån att inte få en kraftig produktionsökning jämfört med förra årets låga 123 bushels per acre.
Höstvetet i USA upplever nu ett ganska kallt och nederbördsrikt väder, vilket inte gynnar de redan hårt ansträngda grödorna. Liknande situation råder i de amerikanska vårveteregionerna, vilket inte underlättar för pågående sådd. Helgen och nästa vecka ser dock ut att kunna ge både varmare och torrare väder, till de amerikanska lantbrukarnas glädje. I EU är vädret ganska varierande, de centrala och södra delarna har fått en hel del nederbörd medan de norra och nordöstra områdena är torra. Grödorna i EU är generellt sett efter i utvecklingen men än finns chans att komma ikapp. Kommande prisutveckling är väldigt beroende av vädret den närmsta tiden, inte minst för pågående och försenade majssådd i USA. I dagsläget upplevs dock större problem enbart för de amerikanska grödorna, gällande väderprognos för kommande vecka inger dock visst hopp om förbättring. Mycket kan hända innan skörd men i dagsläget är vi kvar i vår tro om större skördar och ökade lagernivåer med lägre priser längre fram på året som följd. Vi behåller dock neutral vy för sektorn livsmedel på kort sikt.
Då priserna har på de stora jordbruksråvarorna soja, majs och vete har fallit tillbaka till nivåer före torkan i USA, tror vi att en nedsida är begränsad på kort sikt och därför är vi neutrala till utvecklingen för denna sektor.
Handelsbankens Råvaruindex
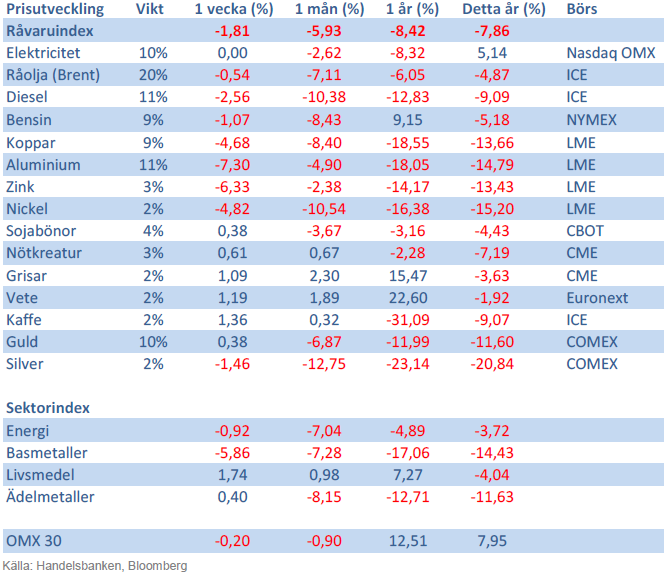
Handelsbankens råvaruindex består av de underliggande indexen för respektive råvara. Vikterna är bestämda till hälften från värdet av global produktion och till hälften från likviditeten i terminskontrakten.
[box]SHB Råvarubrevet är producerat av Handelsbanken och publiceras i samarbete och med tillstånd på Råvarumarknaden.se[/box]
Ansvarsbegränsning
Detta material är producerat av Svenska Handelsbanken AB (publ) i fortsättningen kallad Handelsbanken. De som arbetar med innehållet är inte analytiker och materialet är inte oberoende investeringsanalys. Innehållet är uteslutande avsett för kunder i Sverige. Syftet är att ge en allmän information till Handelsbankens kunder och utgör inte ett personligt investeringsråd eller en personlig rekommendation. Informationen ska inte ensamt utgöra underlag för investeringsbeslut. Kunder bör inhämta råd från sina rådgivare och basera sina investeringsbeslut utifrån egen erfarenhet.
Informationen i materialet kan ändras och också avvika från de åsikter som uttrycks i oberoende investeringsanalyser från Handelsbanken. Informationen grundar sig på allmänt tillgänglig information och är hämtad från källor som bedöms som tillförlitliga, men riktigheten kan inte garanteras och informationen kan vara ofullständig eller nedkortad. Ingen del av förslaget får reproduceras eller distribueras till någon annan person utan att Handelsbanken dessförinnan lämnat sitt skriftliga medgivande. Handelsbanken ansvarar inte för att materialet används på ett sätt som strider mot förbudet mot vidarebefordran eller offentliggörs i strid med bankens regler.


The latest weekly report from the US DOE showed a substantial drawdown across key petroleum categories, adding more upside potential to the fundamental picture.

Commercial crude inventories (excl. SPR) fell by 5.8 million barrels, bringing total inventories down to 415.1 million barrels. Now sitting 11% below the five-year seasonal norm and placed in the lowest 2015-2022 range (see picture below).
Product inventories also tightened further last week. Gasoline inventories declined by 2.1 million barrels, with reductions seen in both finished gasoline and blending components. Current gasoline levels are about 3% below the five-year average for this time of year.
Among products, the most notable move came in diesel, where inventories dropped by almost 4.1 million barrels, deepening the deficit to around 20% below seasonal norms – continuing to underscore the persistent supply tightness in diesel markets.
The only area of inventory growth was in propane/propylene, which posted a significant 5.1-million-barrel build and now stands 9% above the five-year average.
Total commercial petroleum inventories (crude plus refined products) declined by 4.2 million barrels on the week, reinforcing the overall tightening of US crude and products.


A classic case of “buy the rumor, sell the news” played out in oil markets, as Brent crude has dropped sharply – down nearly USD 10 per barrel since yesterday evening – following Iran’s retaliatory strike on a U.S. air base in Qatar. The immediate reaction was: “That was it?” The strike followed a carefully calibrated, non-escalatory playbook, avoiding direct threats to energy infrastructure or disruption of shipping through the Strait of Hormuz – thus calming worst-case fears.
After Monday morning’s sharp spike to USD 81.4 per barrel, triggered by the U.S. bombing of Iranian nuclear facilities, oil prices drifted sideways in anticipation of a potential Iranian response. That response came with advance warning and caused limited physical damage. Early this morning, both the U.S. President and Iranian state media announced a ceasefire, effectively placing a lid on the immediate conflict risk – at least for now.
As a result, Brent crude has now fallen by a total of USD 12 from Monday’s peak, currently trading around USD 69 per barrel.
Looking beyond geopolitics, the market will now shift its focus to the upcoming OPEC+ meeting in early July. Saudi Arabia’s decision to increase output earlier this year – despite falling prices – has drawn renewed attention considering recent developments. Some suggest this was a response to U.S. pressure to offset potential Iranian supply losses.
However, consensus is that the move was driven more by internal OPEC+ dynamics. After years of curbing production to support prices, Riyadh had grown frustrated with quota-busting by several members (notably Kazakhstan). With Saudi Arabia cutting up to 2 million barrels per day – roughly 2% of global supply – returns were diminishing, and the risk of losing market share was rising. The production increase is widely seen as an effort to reassert leadership and restore discipline within the group.
That said, the FT recently stated that, the Saudis remain wary of past missteps. In 2018, Riyadh ramped up output at Trump’s request ahead of Iran sanctions, only to see prices collapse when the U.S. granted broad waivers – triggering oversupply. Officials have reportedly made it clear they don’t intend to repeat that mistake.
The recent visit by President Trump to Saudi Arabia, which included agreements on AI, defense, and nuclear cooperation, suggests a broader strategic alignment. This has fueled speculation about a quiet “pump-for-politics” deal behind recent production moves.
Looking ahead, oil prices have now retraced the entire rally sparked by the June 13 Israel–Iran escalation. This retreat provides more political and policy space for both the U.S. and Saudi Arabia. Specifically, it makes it easier for Riyadh to scale back its three recent production hikes of 411,000 barrels each, potentially returning to more moderate increases of 137,000 barrels for August and September.
In short: with no major loss of Iranian supply to the market, OPEC+ – led by Saudi Arabia – no longer needs to compensate for a disruption that hasn’t materialized, especially not to please the U.S. at the cost of its own market strategy. As the Saudis themselves have signaled, they are unlikely to repeat previous mistakes.
Conclusion: With Brent now in the high USD 60s, buying oil looks fundamentally justified. The geopolitical premium has deflated, but tensions between Israel and Iran remain unresolved – and the risk of missteps and renewed escalation still lingers. In fact, even this morning, reports have emerged of renewed missile fire despite the declared “truce.” The path forward may be calmer – but it is far from stable.
Analys
A muted price reaction. Market looks relaxed, but it is still on edge waiting for what Iran will do
Brent crossed the 80-line this morning but quickly fell back assigning limited probability for Iran choosing to close the Strait of Hormuz. Brent traded in a range of USD 70.56 – 79.04/b last week as the market fluctuated between ”Iran wants a deal” and ”US is about to attack Iran”. At the end of the week though, Donald Trump managed to convince markets (and probably also Iran) that he would make a decision within two weeks. I.e. no imminent attack. Previously when when he has talked about ”making a decision within two weeks” he has often ended up doing nothing in the end. The oil market relaxed as a result and the week ended at USD 77.01/b which is just USD 6/b above the year to date average of USD 71/b.

Brent jumped to USD 81.4/b this morning, the highest since mid-January, but then quickly fell back to a current price of USD 78.2/b which is only up 1.5% versus the close on Friday. As such the market is pricing a fairly low probability that Iran will actually close the Strait of Hormuz. Probably because it will hurt Iranian oil exports as well as the global oil market.
It was however all smoke and mirrors. Deception. The US attacked Iran on Saturday. The attack involved 125 warplanes, submarines and surface warships and 14 bunker buster bombs were dropped on Iranian nuclear sites including Fordow, Natanz and Isfahan. In response the Iranian Parliament voted in support of closing the Strait of Hormuz where some 17 mb of crude and products is transported to the global market every day plus significant volumes of LNG. This is however merely an advise to the Supreme leader Ayatollah Ali Khamenei and the Supreme National Security Council which sits with the final and actual decision.
No supply of oil is lost yet. It is about the risk of Iran closing the Strait of Hormuz or not. So far not a single drop of oil supply has been lost to the global market. The price at the moment is all about the assessed risk of loss of supply. Will Iran choose to choke of the Strait of Hormuz or not? That is the big question. It would be painful for US consumers, for Donald Trump’s voter base, for the global economy but also for Iran and its population which relies on oil exports and income from selling oil out of that Strait as well. As such it is not a no-brainer choice for Iran to close the Strait for oil exports. And looking at the il price this morning it is clear that the oil market doesn’t assign a very high probability of it happening. It is however probably well within the capability of Iran to close the Strait off with rockets, mines, air-drones and possibly sea-drones. Just look at how Ukraine has been able to control and damage the Russian Black Sea fleet.
What to do about the highly enriched uranium which has gone missing? While the US and Israel can celebrate their destruction of Iranian nuclear facilities they are also scratching their heads over what to do with the lost Iranian nuclear material. Iran had 408 kg of highly enriched uranium (IAEA). Almost weapons grade. Enough for some 10 nuclear warheads. It seems to have been transported out of Fordow before the attack this weekend.
The market is still on edge. USD 80-something/b seems sensible while we wait. The oil market reaction to this weekend’s events is very muted so far. The market is still on edge awaiting what Iran will do. Because Iran will do something. But what and when? An oil price of 80-something seems like a sensible level until something do happen.


Hur säkrar vi Sveriges tillgång till kritiska metaller och mineral i en ny geopolitisk verklighet?

Lundin Mining ska bli en av de tio största kopparproducenterna i världen

Sommarvädret styr elpriset i Sverige

Samtal om flera delar av råvarumarknaden
Tightening fundamentals – bullish inventories from DOE

Stor uppsida i Lappland Guldprospekterings aktie enligt analys
Silverpriset släpar efter guldets utveckling, har mer uppsida

Uppgången i oljepriset planade ut under helgen

Mahvie Minerals växlar spår – satsar fullt ut på guld

Låga elpriser i sommar – men mellersta Sverige får en ökning
-
 Nyheter4 veckor sedan
Stor uppsida i Lappland Guldprospekterings aktie enligt analys
-
 Nyheter4 veckor sedan
Silverpriset släpar efter guldets utveckling, har mer uppsida
-
 Nyheter3 veckor sedan
Uppgången i oljepriset planade ut under helgen
-
 Nyheter2 veckor sedan
Mahvie Minerals växlar spår – satsar fullt ut på guld
-
 Nyheter3 veckor sedan
Låga elpriser i sommar – men mellersta Sverige får en ökning
-
Analys3 veckor sedan
Very relaxed at USD 75/b. Risk barometer will likely fluctuate to higher levels with Brent into the 80ies or higher coming 2-3 weeks
-

 Nyheter2 veckor sedan
Oljan, guldet och marknadens oroande tystnad
-

 Nyheter2 veckor sedan
Jonas Lindvall är tillbaka med ett nytt oljebolag, Perthro, som ska börsnoteras