

Analys
SEB – Råvarukommentarer, 6 maj 2013

Rekommendationer
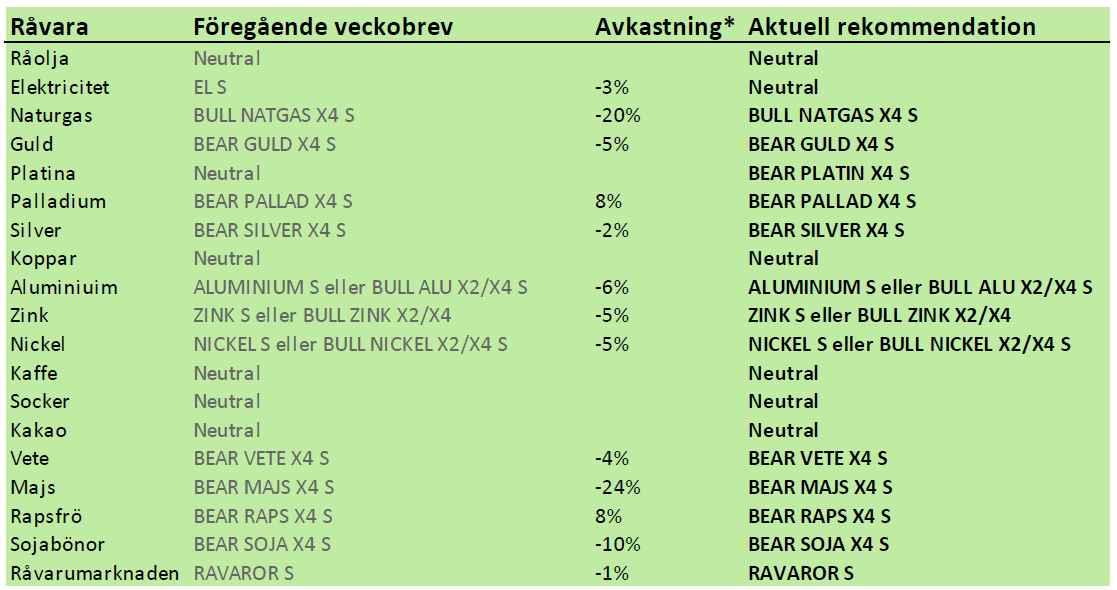
*) Avkastningen avser 1:1 råvarucertifikat där de ingår i rekommendationen. I den aktuella tabellen ovan har jag tagit prisförändringen den senaste veckan sedan det förra veckobrevet publicerades.
Inledning
Jag tror att guld, silver, platina och palladium, liksom olja står inför en korrektion nedåt i veckan som kommer. Om detta sker, kan dock priserna ha kommit ner så pass att det kan bli intressant att köpa dem på lite längre sikt.
Vete och majs har stabiliserat sig i pris på grund av det ovanligt kalla och blöta vädret i USA, som försenat sådden av majs så att den är rekordsen och fått höstvetet att vara i ännu sämre skick. Det har varit onormalt kallt överallt på jorden på ett sätt som avviker kraftigt från vad som var förväntat.
Råolja – Brent
Det var en volatil vecka för oljepriset. 100 dollar på nedsidan och 105 dollar på uppsidan. I fredags med positiv statistik från USA i ryggen försökte marknaden få upp oljepriset över 105 dollar, men det gick inte. Tekniskt ser det ut som om 105 dollar är en bra nivå att sälja på. Men det beror naturligtvis helt på om 105 bryts eller inte. Jag tror inte att marknaden orkar det.
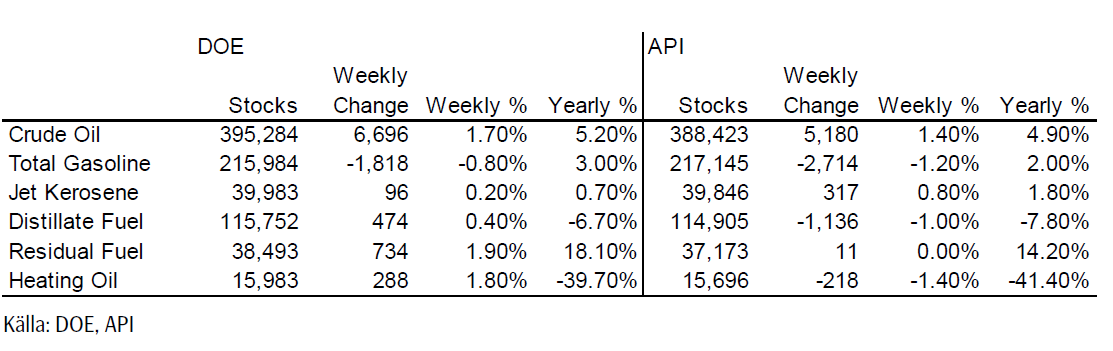
Lagren och lagerförändringarna i USA den senaste rapportveckan ser vi nedan, enligt Department of Energy och American Petroleum Institute. Råoljelagren ökade kraftigt.
Nedan ser vi amerikanska råoljelager enligt DOE i tusen fat. Den svarta kurvan är 2012 års lagernivåer vecka för vecka och den lilla röda linjen är 2013 års nivå.
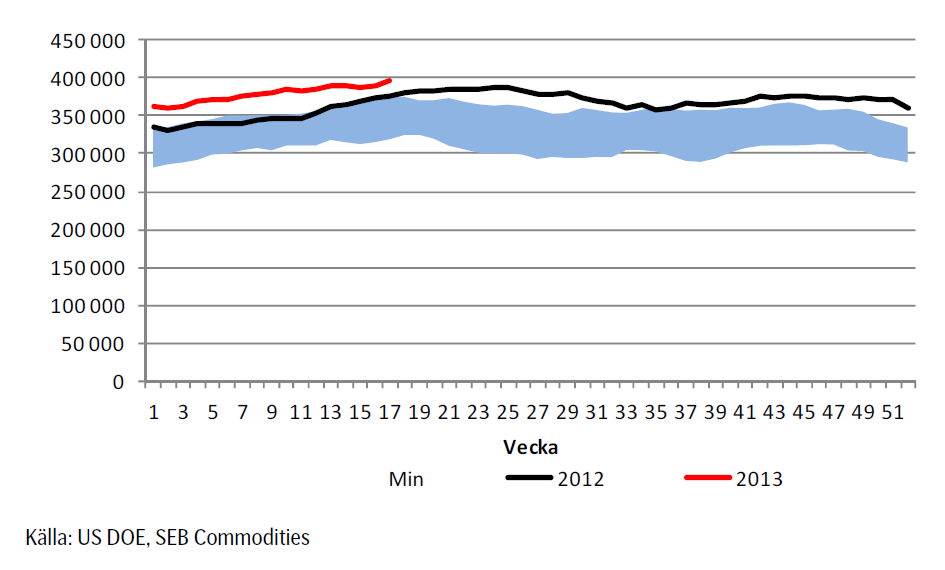
Importen har ökat och den trend av minskad import vi sett från mitten av förra året ser inte ut att fortsätta i år. De högre råoljelagren vi nämnde ovan, ser vi beror på att man importerade mer.
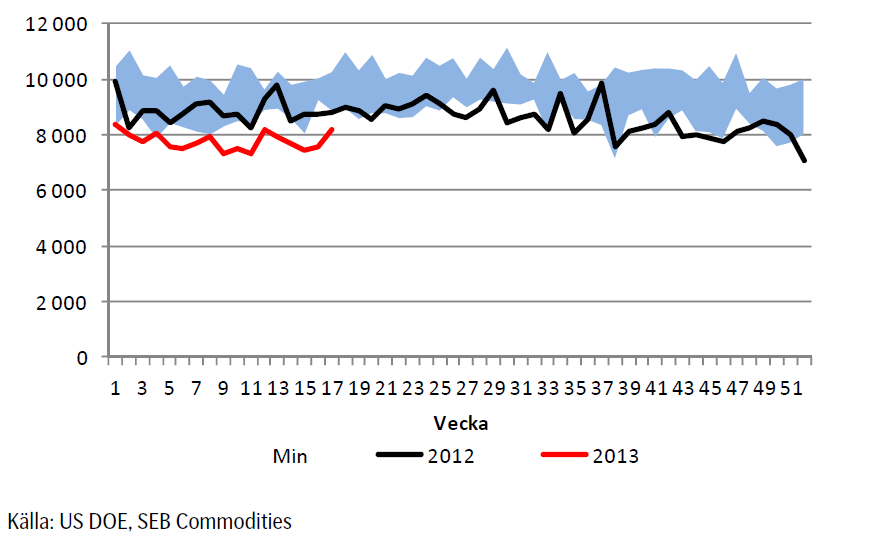
Vi fortsätter att ligga neutralt för att förhoppningsvis kunna komma in billigare i OLJA S om priset går ner till 100 dollar igen.
Elektricitet
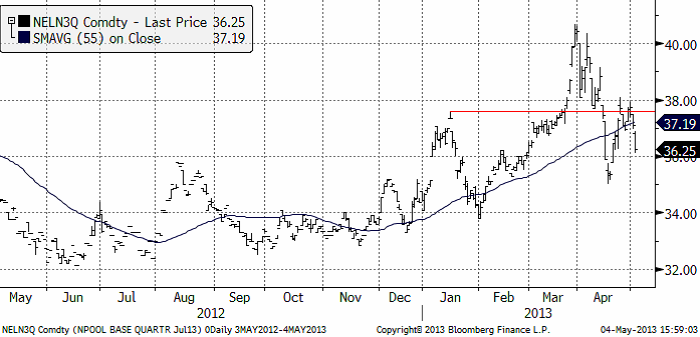
Tekniskt har marknaden bytt mönster från ”bullish” till ”bearish”. Vi väljer därför att gå ur marknaden, i väntan på bekräftelse åt endera hållet.
Naturgas
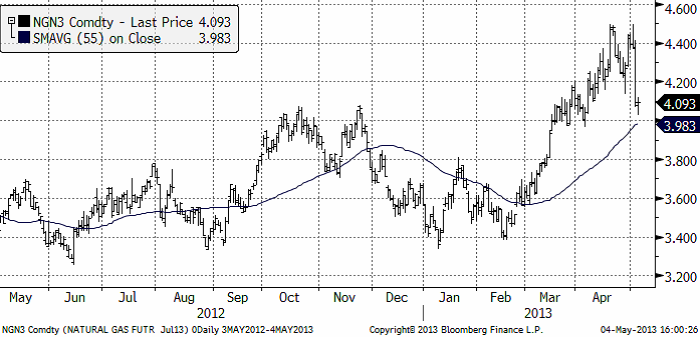
Naturgaspriset fortsatte, som vi skrev förra veckan, upp mot 4.50 igen. Efter det föll priset abrupt. Det var olyckligt, men på den här nivån tror vi att naturgas är köpvärt igen.
Guld och Silver
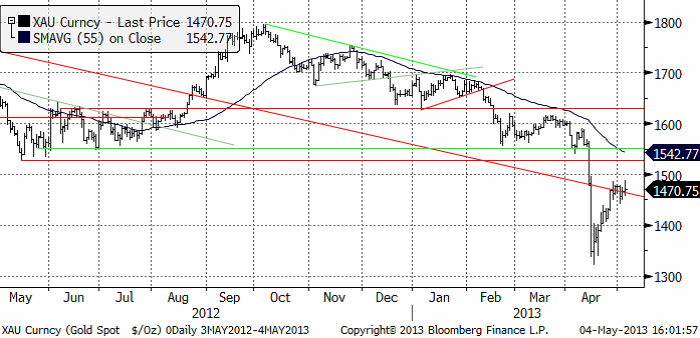
Guldpriset har rekylerat färdigt, tror vi. Vi tror att man ska sälja guld nu, därför att vi tror att det kommer ett kursfall till. Det brukar alltid komma två kursfall med en rekyl emellan, när man haft en så kraftig teknisk säljsignal som vi fick i guld i början på april. När det kursfallet är klart tror jag man kan börja köpa guld igen.
Nedan ser vi kursdiagrammet för silver i dollar per troy ounce.
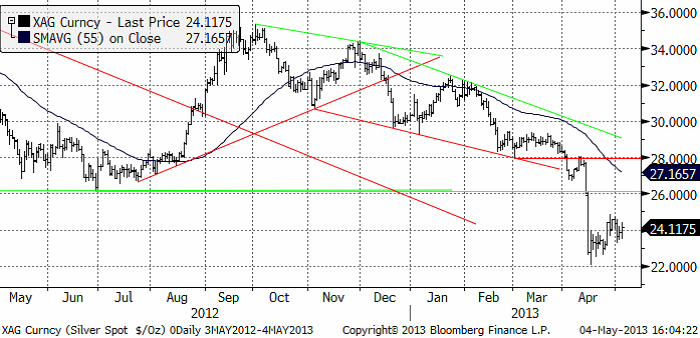
Vi ligger korta guld och silver. Det har kostat i veckan som gick, men eftersom vi tror att det kommer en till vända ner, ligger vi självklart kvar med köpt position i BEAR GULD X4 S och BEAR SILVER X4 S.
Platina & Palladium
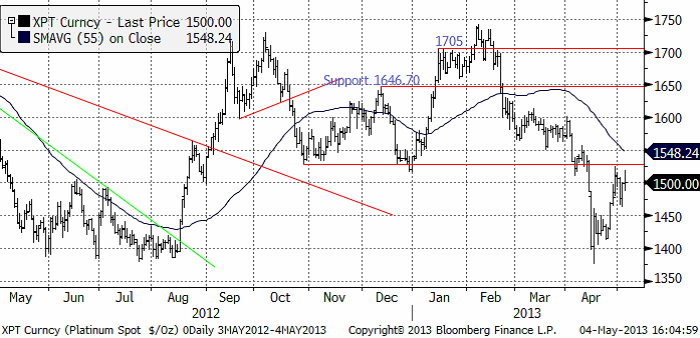
Platinapriset har rekylerat uppåt, i likhet med guld och silver. Förra veckan rekommenderade vi att sälja långa positioner i platina. Den här veckan rekommenderar vi köp av BEAR PLATIN X4 S.
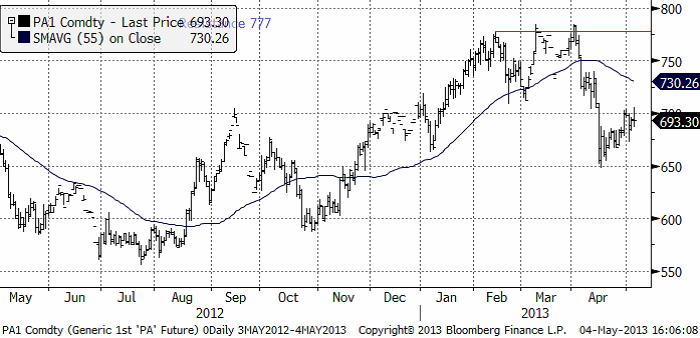
Prisfallet i palladium har stannat av och inte lyckats ta sig uppåt. Det ser ännu svagare ut än de andra. Vi rekommenderar köp av BEAR PALLAD X4 S. Målkursen är 600 dollar.
Basmetaller
Vi skrev i förra veckan att prissättningen av derivat indikerade en ökad volatilitet. Det fick vi se med besked under den gångna veckan. Delvis kan det ”skyllas” på tunna marknader p.g.a. ledigheterna kring 1:a maj. Kina hade stängt både måndag och tisdag, och stora delar av Europa under onsdagen (UK däremot öppet och därmed LME). Svagheten från fredagen följdes upp med säljtryck ända fram till torsdagen. Nyhetsmässigt var det främst rundan av inköpsindexsiffror som drev marknaderna. Både Kina och USA:s PMI backade mer än väntat, och ligger nu i båda fallen bara strax över 50-strecket. Marknaden har de senaste veckorna främst oroats för att återhämtningen i USA tappat fart. Effekten av fredagens överraskande positiva arbetsmarknadssiffra blev därför dramatisk. Priserna var redan mycket nedpressade. Fredagen bjöd på kraftiga uppgångar mellan 3 och 5 %. Sett över hela veckan ser det mindre dramatiskt ut, med marginella uppgångar. Undantaget är koppar som är upp 3,9 % på veckan.
Koppar
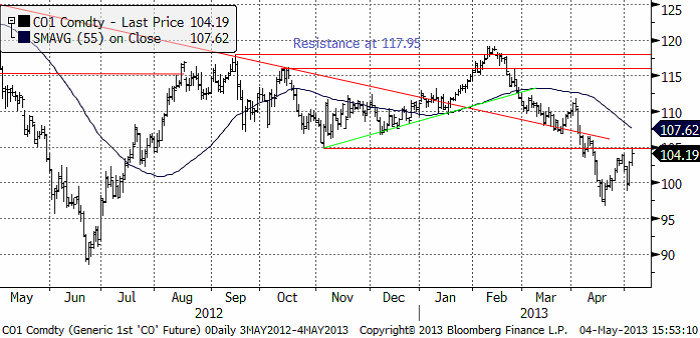
Som vi skrivit tidigare har vi haft kopparn under bevakning för att gå från neutral till köp. Tekniskt sett (se graf) stängde priset i fredags väldigt gynnsamt. Marknadens oro för USA lättade rejält efter fredagens arbetssiffra, som tyder på att ekonomin är på rätt spår. Många finansiella aktörer har dessutom positionerat sig för nedgång, vilket i sig kan skapa ett behov att köpa tillbaka korta positioner. Det är dock för tidigt att tala om en mer bestående vändning. Det behövs tecken på att Kina också är ”på spåret”. Säsongsmässigt är det nu som Kinas kopparimport ska ta fart, något som inte visats sig (ännu) i statistiken. Vi är positiva till basmetaller generellt, och vi har tidigare beskrivit vikten av att kopparmarknaden stabiliserades för att skapa förutsättningar för hela basmetallkomplexet. Veckans utveckling för koppar bådar därför gott för övriga metaller i veckan som kommer.
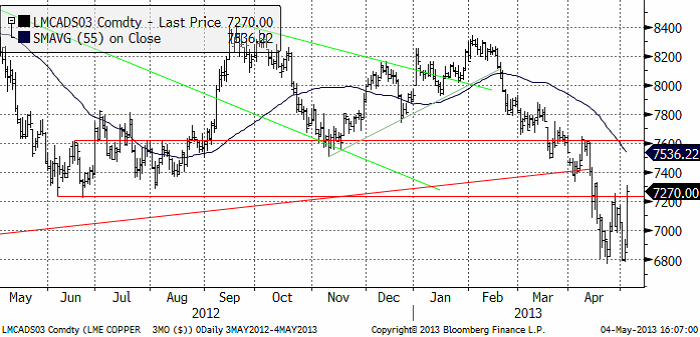
Vi förväntar oss fortsatt hög volatilitet. Vår kortsiktiga bedömning talar för uppsidan och vi rekommenderar därför köp av BULL KOPPAR X2 S eller X4 S.
Aluminium
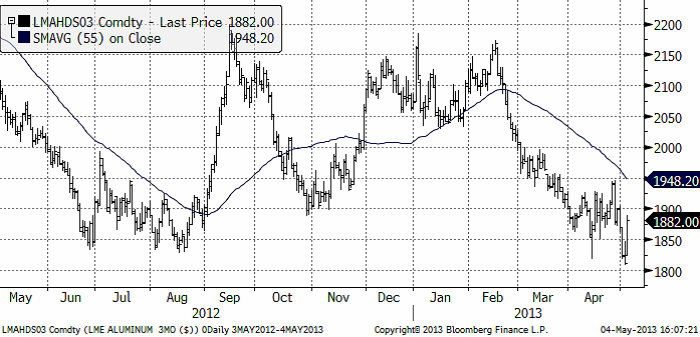
Svagheten i mitten i veckan drabbade aluminium extra hårt och i vårt tycke ”oförtjänt” mycket. Priset fick dock tillfälle att testa nya låga nivåer under $1830, men det blev kortvarigt och köpintresset var massivt på de nivåerna. Vi ser intresse framför allt från industriella aktörer som ”täcker in” framtida konsumtion, men också från långsiktiga investerare som bedömer nivåerna som alltför låga för ett fortsatt ökat utbud. Högkostnadsproducenterna, framför allt i Kina, förväntas minska utbudet om priset långvarigt stannar på nuvarande nivåer. Kina annonserade redan i mars stängningar motsvarande ca 800 tton (att jämföra med ett förväntat globalt överskott på ca 1 milj ton). Fredagens positiva stängning (med hjälp av kopparns starka utveckling) ger grund för en följdrörelse uppåt i början av nästa vecka.
För den riskbenägne kan det vara läge för att köpa ett kontrakt med hävstång (BULL ALU X2 S eller X4 S). Långsiktigt är nivån väldigt intressant för kontraktet Aluminium S (utan hävstång).
Zink
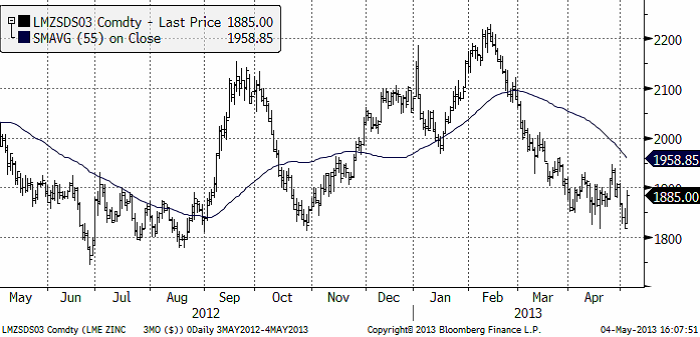
Zinken följde i stort sett övriga metaller under veckan, och får en ganska neutral stängning på veckan. Produktionsstatistik från Kina är lite oroväckande för zinkens fundamentala balans. Smältverksproduktionen ökar i Kina, delvis som en effekt av stort gruvutbud (höjda smältlöner till smältverken). Risken finns att det behövs ännu lägre priser för att påverka gruvutbudet. Risken är att det dröjer innan priset vänder upp på allvar. Vi bedömer ändå zinken som fundamentalt ”billig” ur ett kostnadsperspektiv och nuvarande nivåer är mycket intressanta på lite längre sikt (6-12 månader). I det perspektivet är Zink S (utan hävstång) att föredra.
Nickel
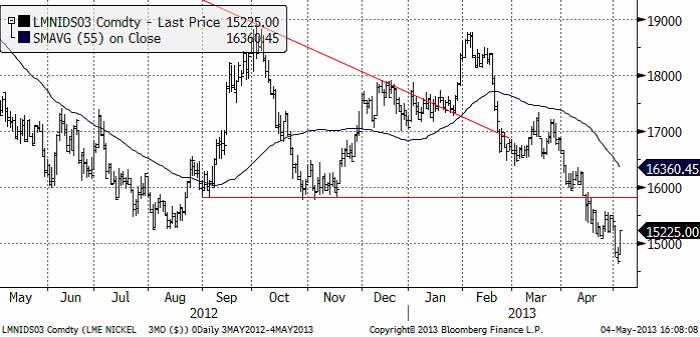
Vi varnade i förra veckan för att det negativa stämningsläget kring nickel skulle kunna pressa marknaden under $15000. I den allmänna svagheten i mitten av veckan, gick det därför ganska lätt. Vi bedömde dock en sådan rörelse som kortvarig. Priset var som hastigast under torsdagen nere som lägst i $14625, vände väldigt snabbt och med hjälp av fredagens arbetsmarknadsstatistik får vi en positiv avslutning på veckan. Tekniskt sett balanserar marknaden på de kritiska nivåerna, och det är för tidigt att tala om en mer bestående vändning. Precis som för koppar är det finansiella kollektivet väldigt ”korta”, d.v.s. det finns ett stort behov att köpta tillbaka tidigare sålda terminskontrakt, som i sig för den volatila metallen nickel, kan skapa utrymme för en uppgång i veckan som kommer. Vi bedömer nivåerna som väldigt intressanta ur ett fundamentalt perspektiv. Högkostnadsproducenterna får problem om priset långvarigt ligger kvar vid nuvarande nivåer. Det har redan rapporterats om produktionsneddragningar i Australien, och det förväntas komma mer. Trots det bedöms marknaden vara i överskott, givet att inte efterfrågan från den rostfria industrin överraskar. Det kan således ta en tid innan vändningen för nickel kommer. Vi bedömer ändå nivåerna som väldigt attraktiva på 6-12 månaders sikt. I det perspektivet är Nickel S (utan hävstång) att föredra.
Kaffe
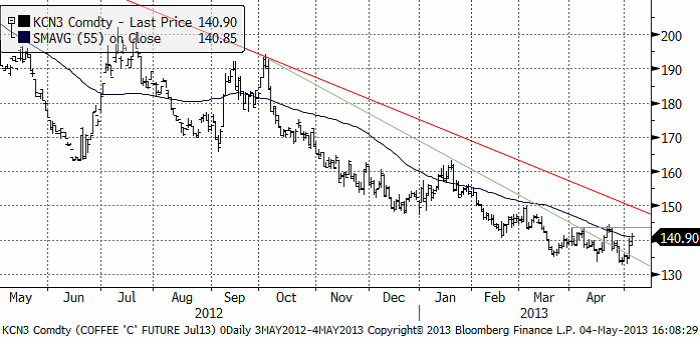
Kaffepriset (maj 2013) steg i veckan som gick. Förr eller senare kommer kaffepriset att vända uppåt. Den som söker en långsiktig placering i råvarumarknaden och har tålamod, kan säkert tjäna bra med pengar på certifikatet KAFFE S.
Socker
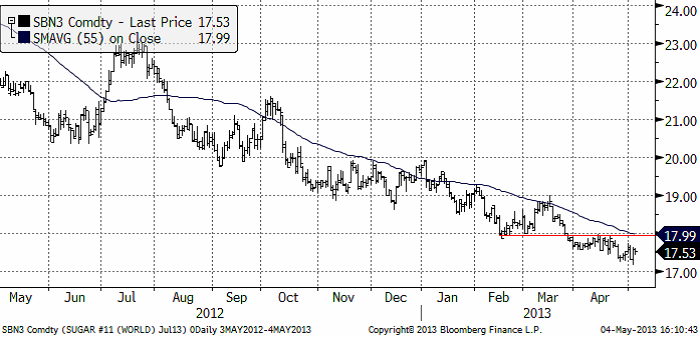
Sockerpriset (september 2013) fortsätter att ligga i fallande pristrend. Ingen skillnad från förra veckan. Socker och kaffe har följt varandra åt under lång tid, men medan kaffet visar lite tecken på trendvändning, ser man inte något alls av det i sockermarknaden. Vi fortsätter med neutral rekommendation.
[box]SEB Veckobrev Veckans råvarukommentar är producerat av SEB Merchant Banking och publiceras i samarbete och med tillstånd på Råvarumarknaden.se[/box]
Disclaimer
The information in this document has been compiled by SEB Merchant Banking, a division within Skandinaviska Enskilda Banken AB (publ) (“SEB”).
Opinions contained in this report represent the bank’s present opinion only and are subject to change without notice. All information contained in this report has been compiled in good faith from sources believed to be reliable. However, no representation or warranty, expressed or implied, is made with respect to the completeness or accuracy of its contents and the information is not to be relied upon as authoritative. Anyone considering taking actions based upon the content of this document is urged to base his or her investment decisions upon such investigations as he or she deems necessary. This document is being provided as information only, and no specific actions are being solicited as a result of it; to the extent permitted by law, no liability whatsoever is accepted for any direct or consequential loss arising from use of this document or its contents.
About SEB
SEB is a public company incorporated in Stockholm, Sweden, with limited liability. It is a participant at major Nordic and other European Regulated Markets and Multilateral Trading Facilities (as well as some non-European equivalent markets) for trading in financial instruments, such as markets operated by NASDAQ OMX, NYSE Euronext, London Stock Exchange, Deutsche Börse, Swiss Exchanges, Turquoise and Chi-X. SEB is authorized and regulated by Finansinspektionen in Sweden; it is authorized and subject to limited regulation by the Financial Services Authority for the conduct of designated investment business in the UK, and is subject to the provisions of relevant regulators in all other jurisdictions where SEB conducts operations. SEB Merchant Banking. All rights reserved.

Down on Friday. Up on Monday. The Brent June crude oil contract traded down 5.1% last week to a close of $90.38/b. It reached a high of $103.87/b last Monday and a low of $86.09/b on Friday as Iran announced that the Strait of Hormuz was fully open for transit. That quickly changed over the weekend as the US upheld its blockade of Iranian oil exports while Iran naturally responded by closing the SoH again. The US blew a hole in the engine room of the Iranian ship TOUSKA and took custody of the ship on Sunday. Brent crude is up 5.6% this morning to $95.4/b.

The cease-fire is expiring tomorrow. The US has said it will send a delegation for a second round of negotiations in Islamabad in Pakistan. But Iran has for now rejected a second round of talks as it views US demands as unrealistic and excessive while the US is also blocking the Strait of Hormuz.
While Brent is up 5% this morning, the financial market is still very optimistic that progress will be made. That talks will continue and that the SoH will fully open by the start of May which is consistent with a rest-of-year average Brent crude oil price of around $90/b with the market now trading that balance at around $88/b.
Financial optimism vs. physical deterioration. We have a divergence where the financial market is trading negotiations, improvements and resolution while at the same time the physical market is deteriorating day by day. Physical oil flows remain constrained by disrupted flows, longer voyage times and elevated freight and insurance costs.
Financial markets are betting that a US/Iranian resolution will save us in time from violent shortages down the road. But every day that the SoH remains closed is bringing us closer to a potentially very painful point of shortages and much higher prices.
The US blockade is also a weapon of leverage against its European and Asian allies. When Iran closed the SoH it held the world economy as a hostage against the US. The US blockade of the SoH is of course blocking Iranian oil exports. But it is also an action of disruption directed towards Europe and Asia. The US has called for the rest of the world to engaged in the war with Iran: ”If you want oil from the Persian Gulf, then go and get it”. A risk is that the US plays brinkmanship with the global oil market directed towards its European and Asian allies and maybe even towards China to force them to engage and take part. Maybe unthinkable. But unthinkable has become the norm with Trump in the White House.
Wild moves yesterday. Brent crude traded to a high of $114.43/b and a low of $96.0/b and closed at $99.94/b yesterday.
US – Iran negotiations ongoing or not? What a day. Donald Trump announced that good talks were ongoing between Iran and the US and that the 48 hour deadline before bombing Iranian power plants and energy infrastructure was postponed by five days subject to success of ongoing meetings. Iranian media meanwhile stated that no meetings were ongoing at all.
Today we are scratching our heads trying to figure out what yesterday was all about.
Friends and family playing the market? Was it just Trump and his friends and family who were playing with oil and equity markets with $580m and $1.46bn in bets being placed by someone in oil and equity markets just 15 minutes before Trump’s announcement?
Was Trump pulling a TACO as he reached his political and economic pain point: Brent at $112/b, US Gas at $4/gal, SPX below 200dma and US 10yr above 4.4%?
Different Iranian factions with Trump talking with one of them? Are there real negotiations going on but with the US talking to one faction in Iran while another, the hardliners, are not involved and are denying any such negotiations going on?
Extending the ultimatum to attack and invade Kharg island next weekend? Or, is the five day delay of the deadline a tactical decision to allow US amphibious assault ships and marines to arrive in the Gulf in the upcoming weekend while US and Israeli continues to degrade Iranian military targets till then. And then next weekend a move by the US/Israel to attack and conquer for example the Kharg island?
We do not really know which it is or maybe a combination of these.
We did get some kind of TACO ydy. But markets have been waiting for some kind of TACO to happen and yesterday we got some kind of TACO. And Brent crude is now trading at $101.5/b as a result rather than at $112-114/b as it did no the high yesterday.
But what really matters in our view is the political situation on the ground in Iran. Will hardliners continue to hold power or will a more pragmatic faction gain power?
If the hardliners remain in power then oil pain should extend all the way to US midterm elections. The hardliners were apparently still in charge as of last week. Iran immediately retaliated and damaged LNG infrastructure in Qatar after Israel hit Iranian South Pars. The SoH was still closed and all messages coming out of Iran indicated defiance. Hardliners continues in power has a huge consequence for oil prices going forward. The regime has played its ’oil-weapon’ (closing or chocking the Strait of Hormuz). It is using it to achieve political goals. Deterrence: it needs to be so politically and economically expensive to attack Iran that it won’t happen again in the future. Or at least that the US/Israel thinks 10-times over before they attack again. The highest Brent crude oil closing price since the start of the war is $112.19/b last Friday. In comparison the 20-year inflation adjusted Brent price is $103/b. So Brent crude last Friday at $112.19/b isn’t a shockingly high price. And it is still far below the nominal high of $148/b from 2008 which is $220/b if inflation adjusted. So once in a lifetime Iran activates its most powerful weapon. The oil weapon. It needs to show the power of this weapon and it needs to reap political gains. Getting Brent to $112/b and intraday high of $119.5/b (9 March) isn’t a display of the power of that weapon. And it is not a deterrence against future attacks.
So if the hardliners remain in power in Iran, then the SoH will likely remain chocked all the way to US midterm elections and Brent crude will at a minimum go above the historical nominal high of $148/b from 2008.
Thus the outlook for the oil price for the rest of the year doesn’t depend all that much of whether Trump pulls a TACO or not. Stops bombing or not. It depends more on who is in charge in Iran. If it is the hardliners, then deterrence against future attacks via chocking of the SoH and high oil prices is the likely line of action. It is impacting the world but the Iranian ’oil-weapon’ is directed towards the US president and the the US midterm elections.
If a pragmatic faction gets to power in Iran, then a very prosperous future is possible. However, if power is shifting towards a more pragmatic faction in Iran then a completely different direction could evolve. Such a faction could possibly be open for cooperation with the US and the GCC and possibly put its issues versus Israel aside. Then the prosperity we have seen evolving in Dubai could be a possible future also for Iran.
So far it looks like the hardliners are fully in charge. As far as we can see, the hardliners are still fully in control in Iran. That points towards continued chocking of the SoH and oil prices ticking higher as global inventories (the oil market buffers) are drawn lower. And not just for a few more weeks, but possibly all the way to the US midterm elections.
A brief sigh of relief yesterday as oil infra at Kharg wasn’t damaged. But higher today. Brent crude dabbled around a bit yesterday in relief that oil infrastructure at Iran’s Kharg island wasn’t damaged. It traded briefly below the 100-line and in a range of $99.54 – 106.5/b. Its close was near the low at $100.21/b.
No easy victorious way out for Trump. So no end in sight yet. Brent is up 3.2% today to $103.4/b with no signs that the war will end anytime soon. Trump has no easy way to declare victory and mission accomplished as long as Iran is in full control of the Strait of Hormuz while also holding some 440 kg of uranium enriched to 60% and not far from weapons grade at 90%. As long as these two factors are unresolved it is difficult for Trump to pull out of the Middle East. Naturally he gets increasingly frustrated over the situation as the oil price and US retail gas prices keeps ticking higher while the US is tied into the mess in the Middle East. Trying to drag NATO members into his mess but not much luck there.
When commodity prices spike they spike 2x, 3x, 4x or 5x. Supply and demand for commodities are notoriously inflexible. When either of them shifts sharply, the the price can easily go to zero (April 2022) or multiply 2x, 3x, or even 5x of normal. Examples in case cobalt in 2025 where Kongo restricted supply and the price doubled. Global LNG in 2022 where the price went 5x normal for the full year average. Demand for tungsten in ammunition is up strongly along with full war in the middle east. And its price? Up 537%.
Why hasn’t the Brent crude oil price gone 2x, 3x, 4x or 5x versus its normal of $68/b given close to full stop in the flow of oil of the Strait of Hormuz? We are after all talking about close to 20% of global supply being disrupted. The reason is the buffers. It is fairly easy to store oil. Commercial operators only hold stocks for logistical variations. It is a lot of oil in commercial stocks, but that is predominantly because the whole oil system is so huge. In addition we have Strategic Petroleum Reserves (SPRs) of close to 2500 mb of crude and 1000 mb of oil products. The IEA last week decided to release 400 mb from global SPR. Equal to 20 days of full closure of the Strait of Hormuz. Thus oil in commercial stocks on land, commercial oil in transit at sea and release of oil from SPRs is currently buffering the situation.
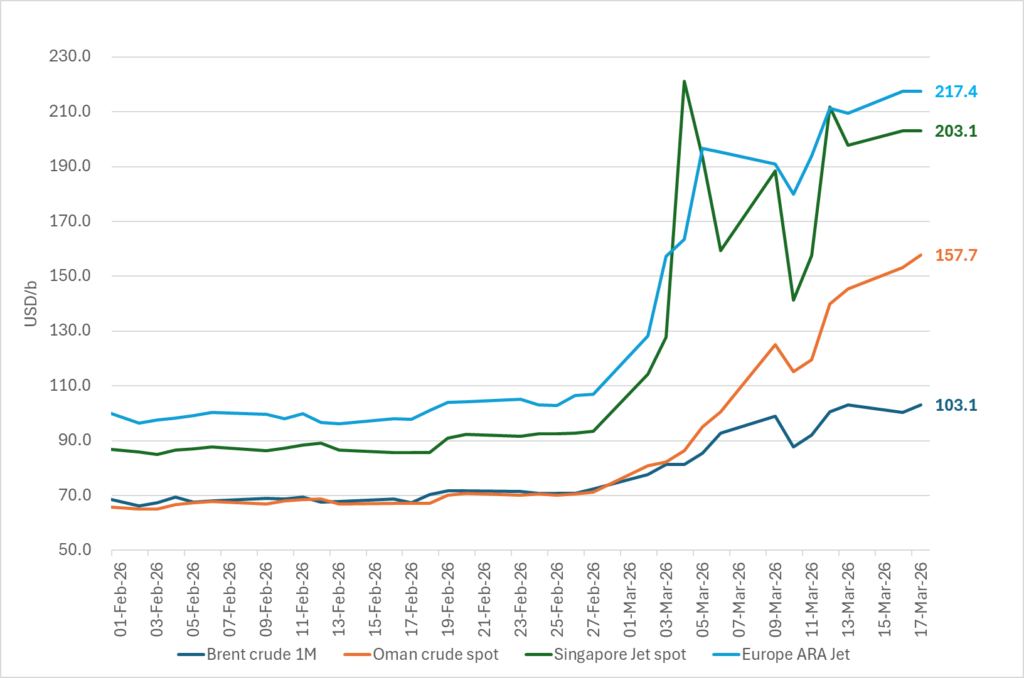
But we are running the buffers down day by day. As a result we see gradually increasing stress here and there in the global oil market. Asia is feeling the pinch the most. It has very low self sufficiency of oil and most of the exports from the Gulf normally head to Asia. Availability of propane and butane many places in India (LPG) has dried up very quickly. Local prices have tripled as a result. Local availability of crude, bunker oil, fuel oil, jet fuel, naphtha and other oil products is quickly running down to critical levels many places in Asia with prices shooting up. Oman crude oil is marked at $153/b. Jet fuel in Singapore is marked at $191/b.
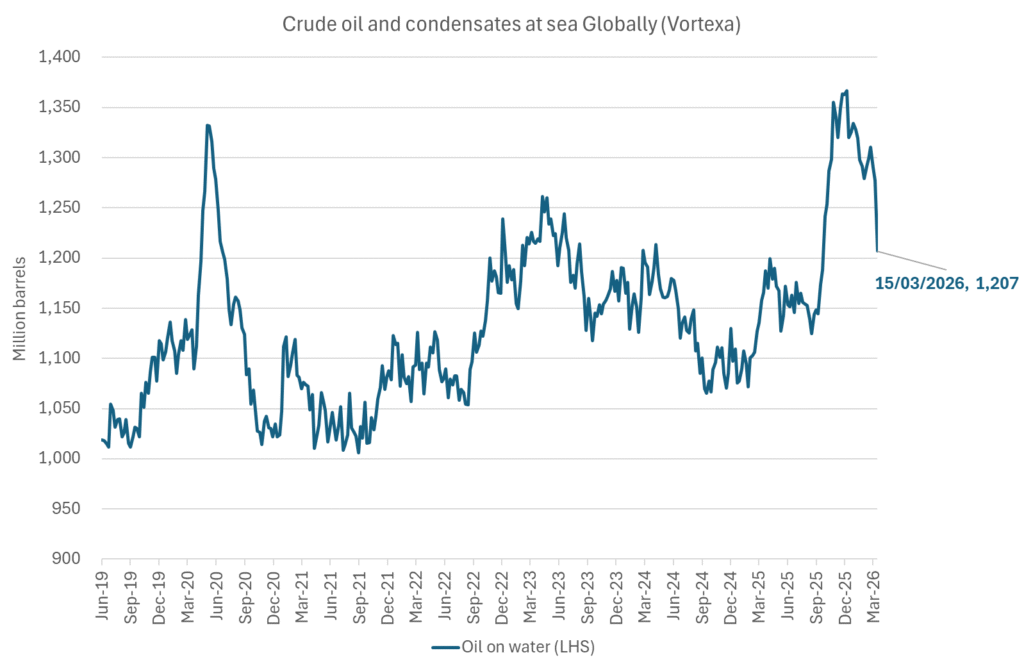
Oil at sea originating from Strait of Hormuz from before 28 Feb is rapidly emptied. Oil at sea is a large pool of commercial oil. An inventory of oil in constant move. If we assume that the average journey from the Persian Gulf to its destinations has a volume weighted average of 13.5 days then the amount of oil at sea originating from the Persian Gulf when the the US/Israel attacked on 28 Feb was 13.5 days * 20 mb/d = 269 mb. Since the strait closed, this oil has increasingly been delivered at its destinations. Those closest to the Strait, like Pakistan, felt the emptying of this supply chain the fastest. Propane prices shooting to 3x normal there already last week and restaurants serving cold food this week is a result of that. Some 50-60% of Asia’s imports of Naphtha normally originates from the Persian Gulf. So naphtha is a natural pain point for Asia. The Gulf also a large and important exporter of Jet fuel. That shut in has lifted jet prices above $200/b.
To simplify our calculations we assume that no oil has left the Strait since that date and that there is no increase in Saudi exports from Yanbu. Then the draining of this inventory at sea originated from the Persian Gulf will essentially look like this:
The supply chain of oil at sea originating from the Strait of Hormuz is soon empty. Except for oil allowed through the Strait of Hormuz by Iran and increased exports from Yanbu in the Red Sea. Not included here.
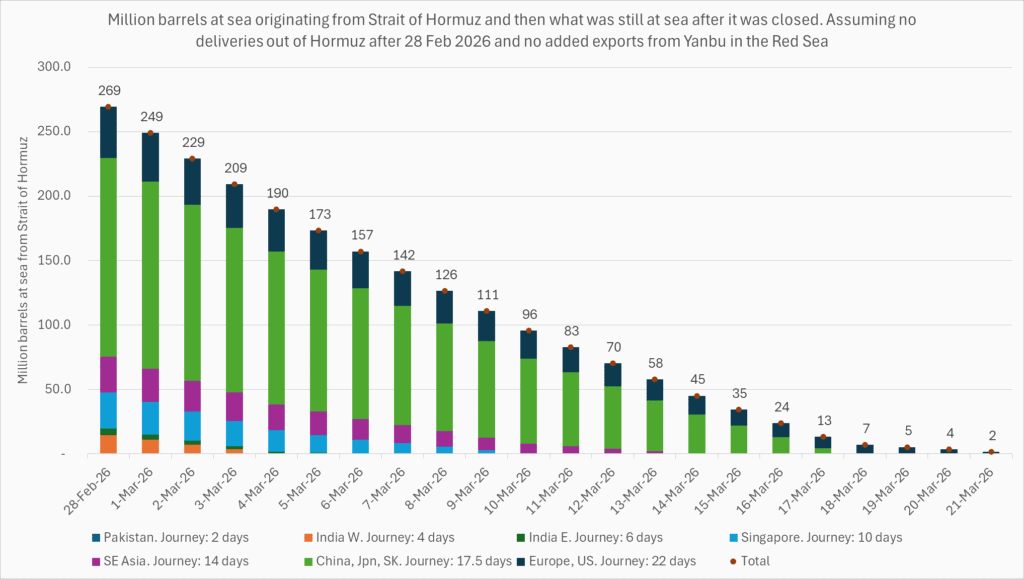
Oil at sea is falling fast as oil is delivered without any new refill in the Persian Gulf. Waivers for Russian crude is also shifting Russian crude to consumers. Brent crude will likely start to feel the pinch much more forcefully when oil at sea is drawn down another 200 mb to around 1000 mb. That is not much more than 10 days from here.
Oil and oil products are starting to become very pricy many places. Brent crude has still been shielded from spiking like the others.



Market Still Betting on Timely Resolution, But Each Day Raises Shortage Risk

Christian Kopfer om läget för oljan

Marknaden måste börja betrakta de höga kopparpriserna som det nya normala

Det fysiska spotpriset på brentolja har slagit nytt rekord

40 minuter med Javier Blas om hur världen verkligen påverkas av energikrisen
40 minuter med Javier Blas om hur världen verkligen påverkas av energikrisen

Elpriserna fördubblas, stor osäkerhet inför sommaren

MP Materials, USA:s svar på Kinas dominans över sällsynta jordartsmetaller
Det fysiska spotpriset på brentolja har slagit nytt rekord

Studsvik har idag ansökt om att få bygga 1200-1600 MW kärnkraft i Valdemarsvik
-
 Nyheter3 veckor sedan
40 minuter med Javier Blas om hur världen verkligen påverkas av energikrisen
-
 Nyheter4 veckor sedan
Elpriserna fördubblas, stor osäkerhet inför sommaren
-
 Nyheter4 veckor sedan
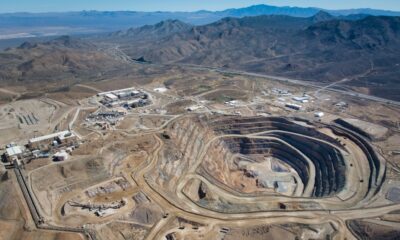
MP Materials, USA:s svar på Kinas dominans över sällsynta jordartsmetaller
-
 Nyheter2 veckor sedan
Det fysiska spotpriset på brentolja har slagit nytt rekord
-
 Nyheter4 veckor sedan
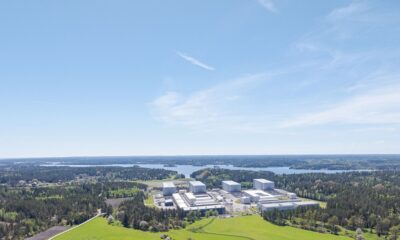
Studsvik har idag ansökt om att få bygga 1200-1600 MW kärnkraft i Valdemarsvik
-
 Nyheter2 veckor sedan
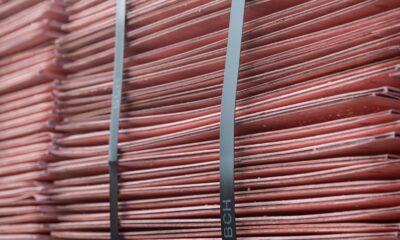
Marknaden måste börja betrakta de höga kopparpriserna som det nya normala
-
Analys4 veckor sedan
TACO (or Whatever It Was) Sends Oil Lower — Iran Keeps Choking Hormuz
-

 Nyheter4 veckor sedan
Matproduktion är beroende av gödsel, Gulfkriget skapar brist