

Analys
SHB Råvarubrevet 24 maj 2013

 Den senaste tiden har vi haft en negativ syn på makroutvecklingen. Makrostatistiken har överlag stött denna syn, som dock inte reflekterats i marknaderna. Visst finns det ljusglimtar, speciellt på hushållssidan i USA där konsumentförtroendet stigit kraftigt. Inköpschefsindex i Kina har dock fortsatt att falla, denna vecka det preliminära från HSBC, och trots viss återhämtning i Eurozonens inköpschefsindex tyder dessa på fortsatt recession.
Det var länge sedan vi såg så stora marknadsrörelser som under Fedchefen Bernankes utfrågning inför kongressens gemensamma ekonomiska utskott. Hans huvudbudskap var att Fed kan komma att dra ned på takten i sina tillgångsköp redan i närtid men att data kommer att avgöra. Vi tycker oss utläsa att Bernanke känner sig tvingad att spegla en spirande majoritets syn i frågan. Själv hade han förmodligen velat sända ett något mjukare budskap.
De guldpåverkande inflationsförväntningarna har också dämpats, och är nu något under nivåer förenliga med ett uppfyllande av Feds inflationsmål under nästföljande 10 år. Den låga inflationen riskerar att bli ett problem för USA:s centralbank. Arbetsmarknaden sitter fortsatt i förarsätet. Om sysselsättningen (non-farm payrolls) fortsätter att öka med mer än 200 000 per månad ter sig ett försök till mindre stimulanser rimlig, knappast i juni men kanske 31:e juli eller den 18:e september. Protokollet från Fed:s majmöte får sägas ha spätt på denna oro.
Basmetallerna
Ben skakar om
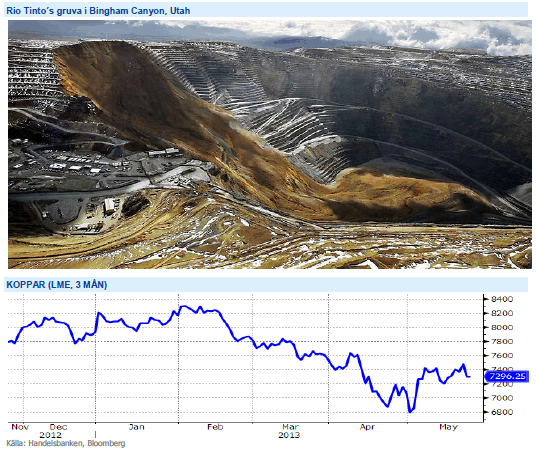
Basmetallerna handlas i princip oförändrade under veckan. Efter några starka dagar med stigande priser fick vi se priserna vända efter sämre kinadata än väntat och Ben Bernankes som talade om att dra tillbaka stimulans. Under maj månad har vi sett investerare gå ur sina korta positioner i koppar och priset har under månaden stigit med 7,4 %. Veckans svaga data från Kina har dock öppnat upp för att i en del korta positioner återupptas på oro om försvagad efterfråga från världens största kopparkonsument.
På utbudssidan lider kopparmarknaden av två olyckor – förra veckans ras i Freeports koppargruva i Grasberg, som nu tagit 28 människors liv, samt det jordskred i Utah för en månad sen som tvingat Rio Tintos gruva att göra uppehåll i produktionen. Tillsammans står dessa två gruvor för 4-5 % av den globala produktionen och om utbudstörningen håller i sig kommer det påverka priset på metallen.
Den fysiska marknaden för basmetaller är stark och efter vårens nedgång ser vi basmetallerna som köpvärda på dessa nivåer. Vi tror på: LONG BASMET H
Ädelmetaller
Guldet fortfarande dyrt
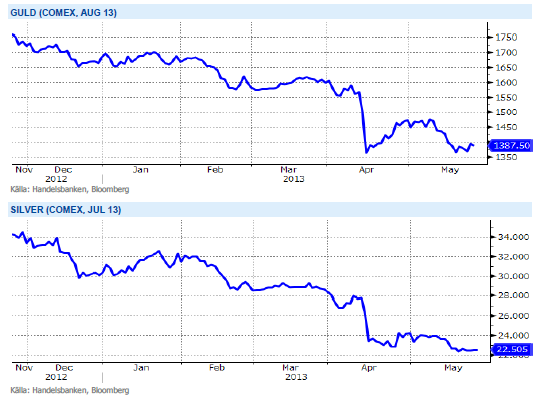
I måndags testade guldet på allvar bottennivåerna från april, och vi tillbringade flera timmar under 1350 dollar per uns. Nivåerna höll dock och vi fick en ganska kraftig rekyl upp till 1400 dollar mot slutet av dagen då en uppsjö av fyndköpare skulle in, och de som kortat guld under dagen fick täcka sina positioner. Sedan dess har vi haft utfrågning av Big Ben Bernanke, vi har haft lite röriga signaler från Japans centralbankschef, och marknaderna har rört sig åt olika håll. Vi summerar veckan med att börserna fallit, räntorna har stigit, och guldet har stigit. Guldet handlar 2,5 % över förra fredagens nivåer.
Vi kan inte annat än undra om inte de två senaste dagarnas börsfall egentligen borde skapat lite större köptryck på guldet, och de som fyndköpt under veckan kanske måste rannsaka sig snart igen. För nu ser det ut som att guldet och silvret inte kommer att generera några jätterörelser åt något håll. Vi är dock fortsatt väldigt negativa till guld, och om vi handlar ner under de nu väldigt viktiga 1350 dollar per uns så kommer det att öppna upp för ytterligare en stark våg av utförsäljningar. Fortfarande inte fyndköpsläge!
Urprisningen av QE driver ner guldet ytterligare samtidigt som dollarn stärks, vilket i sin tur ger lägre guld. Vi tror på: SHRT GULD H
Energi
Reviderad oljeprognos
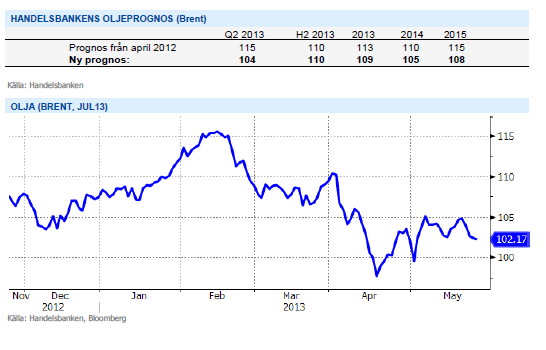
Vår oljeprognos för 2013 revideras visserligen ned en dollar till 109 men den svaga balansen, dvs kraftigt stigande efterfrågan, underhållsarbete och risk för produktionsbortfall under orkansäsongen senare i sommar gör att vi tror på fortsatt höga prisnivåer. Vi reviderar däremot oljeprognosen för 2014 med 10 dollar till 105 då reservkapaciteten ser ut att öka främst från OPEC. Vi bedömer dock fortfarande att risken finns på uppsidan till följd av en betydande politisk risk, främst kring Iran, samt att bättre balansera kapacitetsökningar och produktionsbortfall. Vi räknar också med att tillväxttakten för den amerikanska skifferproduktionen mattas av inom några år.
Inga större rörelser på elmarknaden men kontraktet Q32013 backar med 50 cent till 35.10 euro. Energibalansen ser ut att förbättras med ca 1.5 TWh till -18 TWh mot normalt samtidigt som såväl utsläppsrätter och kol handlas oförändrat. Det är egentligen bara spotpriset som överraskar på uppsidan och givet det blöta och varma vädret i kombination med en full vårflod får nivån betecknas som hög, snittet för maj har varit 36.85 euro hittills att jämföra med förra årets nivå om 28.6 euro. Kol och CO2 har stabiliserats så det skall till en kraftig förändring på energiblansen för att driva priset åt endera hållet.
Livsmedel
Vi tror på lägre priser
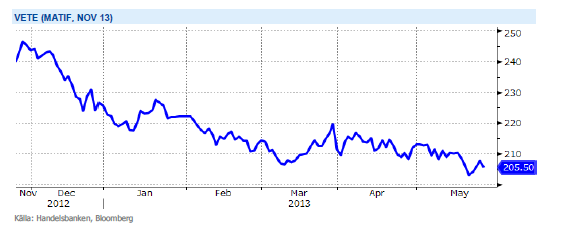
En rapport från det amerikanska jordbruksdepartementet, USDA, pekar mot en rekordskörd av vete och annat spannmål i år. Det har satt prisbilden i gungning och vi tror att vi kan få se ett prisfall på 15–20 procent. Skördeåret 2012/2013 var katastrofalt för flera av världens största veteproducenter. Den amerikanska mellanvästern noterade den torraste sommaren på 54 år och från Ryssland och Ukraina kom alarmerande rapporter om att stora delar av skörden torkade in. Det minskade utbudet ledde till att vetepriset gick i taket på råvarubörserna i Chicago och Paris. Rekordpriserna gav samtidigt producenterna incitament till att odla upp större arealer, vilket är en förklaring till årets väntade rekordsiffra.
Historiskt sett är det också högst ovanligt med två extrema väderår i följd. Sådana inträffar bara vart tionde år eller så. Det spär på förväntningarna på årets skörd. Enligt USDA uppskattas den globala veteskörden till 701 miljoner ton säsongen 2013/14, 45 miljoner ton mer än i fjol. Efter fjolårets svaga skörd är nivåerna i spannmålslagren låga. Det innebär att det finns en riskpremie i handeln som bromsar ett snabbare initialt prisfall efter USDAprognosen. Marknaden vill få bekräftelse på att förväntningarna på årets skörd verkligen infrias. På pappret ser allting väldigt bra ut. Nästa steg är att se att skörden verkligen matchar prognosen, sedan kommer priserna att börja handlas ned på allvar. Redan om tre, fyra veckor börjar skördetröskorna rulla i USA, följt av Ryssland och sedan Europa. Sist ut är Australien i slutet av året. Allteftersom skörden bärgas hem tror vi priserna också att faller. Scenariot förutsätter bra väder och det är alltid ett osäkerhetsmoment när det gäller spannmål. Men just nu ser det ut som att vi kommer att få den tredje största skörden någonsin.
Efter att alla frön är i jorden och prognoser på rekordskördar duggar tätt så finns alla förutsättningar för att priserna på de tre stora grödorna soja, majs och vete att falla fram till skörden är bärgad. Vi tror på: SHRT LIVSMEDEL H
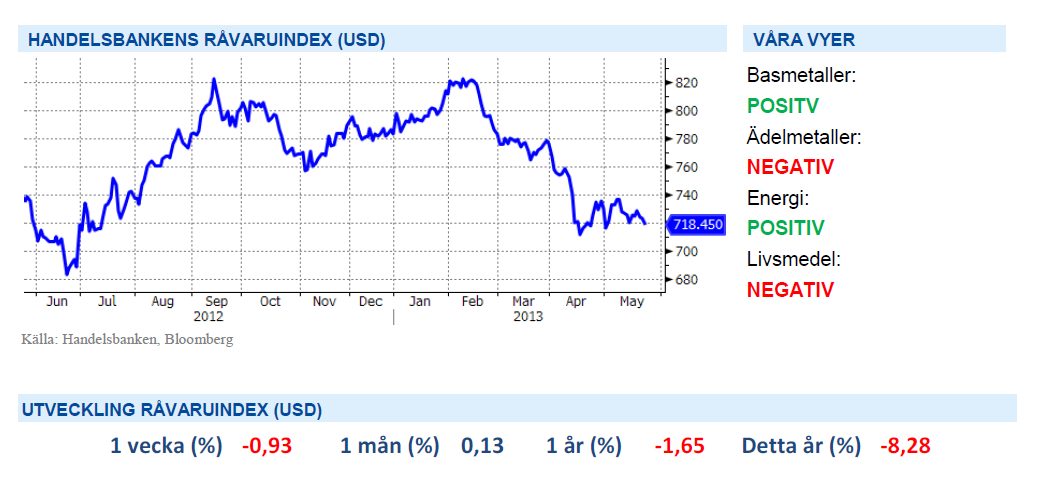
Handelsbankens Råvaruindex
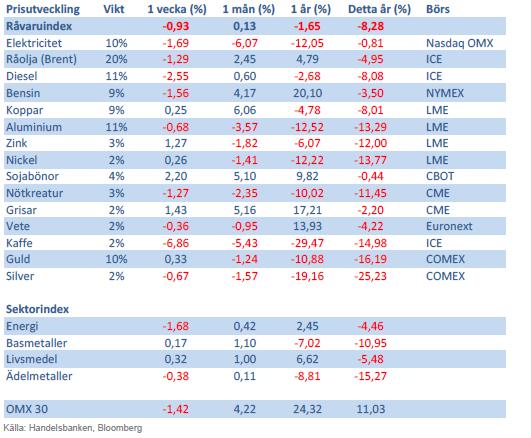
Handelsbankens råvaruindex består av de underliggande indexen för respektive råvara. Vikterna är bestämda till hälften från värdet av global produktion och till hälften från likviditeten i terminskontrakten.
[box]SHB Råvarubrevet är producerat av Handelsbanken och publiceras i samarbete och med tillstånd på Råvarumarknaden.se[/box]
Ansvarsbegränsning
Detta material är producerat av Svenska Handelsbanken AB (publ) i fortsättningen kallad Handelsbanken. De som arbetar med innehållet är inte analytiker och materialet är inte oberoende investeringsanalys. Innehållet är uteslutande avsett för kunder i Sverige. Syftet är att ge en allmän information till Handelsbankens kunder och utgör inte ett personligt investeringsråd eller en personlig rekommendation. Informationen ska inte ensamt utgöra underlag för investeringsbeslut. Kunder bör inhämta råd från sina rådgivare och basera sina investeringsbeslut utifrån egen erfarenhet.
Informationen i materialet kan ändras och också avvika från de åsikter som uttrycks i oberoende investeringsanalyser från Handelsbanken. Informationen grundar sig på allmänt tillgänglig information och är hämtad från källor som bedöms som tillförlitliga, men riktigheten kan inte garanteras och informationen kan vara ofullständig eller nedkortad. Ingen del av förslaget får reproduceras eller distribueras till någon annan person utan att Handelsbanken dessförinnan lämnat sitt skriftliga medgivande. Handelsbanken ansvarar inte för att materialet används på ett sätt som strider mot förbudet mot vidarebefordran eller offentliggörs i strid med bankens regler.


Wild moves yesterday. Brent crude traded to a high of $114.43/b and a low of $96.0/b and closed at $99.94/b yesterday.

US – Iran negotiations ongoing or not? What a day. Donald Trump announced that good talks were ongoing between Iran and the US and that the 48 hour deadline before bombing Iranian power plants and energy infrastructure was postponed by five days subject to success of ongoing meetings. Iranian media meanwhile stated that no meetings were ongoing at all.
Today we are scratching our heads trying to figure out what yesterday was all about.
Friends and family playing the market? Was it just Trump and his friends and family who were playing with oil and equity markets with $580m and $1.46bn in bets being placed by someone in oil and equity markets just 15 minutes before Trump’s announcement?
Was Trump pulling a TACO as he reached his political and economic pain point: Brent at $112/b, US Gas at $4/gal, SPX below 200dma and US 10yr above 4.4%?
Different Iranian factions with Trump talking with one of them? Are there real negotiations going on but with the US talking to one faction in Iran while another, the hardliners, are not involved and are denying any such negotiations going on?
Extending the ultimatum to attack and invade Kharg island next weekend? Or, is the five day delay of the deadline a tactical decision to allow US amphibious assault ships and marines to arrive in the Gulf in the upcoming weekend while US and Israeli continues to degrade Iranian military targets till then. And then next weekend a move by the US/Israel to attack and conquer for example the Kharg island?
We do not really know which it is or maybe a combination of these.
We did get some kind of TACO ydy. But markets have been waiting for some kind of TACO to happen and yesterday we got some kind of TACO. And Brent crude is now trading at $101.5/b as a result rather than at $112-114/b as it did no the high yesterday.
But what really matters in our view is the political situation on the ground in Iran. Will hardliners continue to hold power or will a more pragmatic faction gain power?
If the hardliners remain in power then oil pain should extend all the way to US midterm elections. The hardliners were apparently still in charge as of last week. Iran immediately retaliated and damaged LNG infrastructure in Qatar after Israel hit Iranian South Pars. The SoH was still closed and all messages coming out of Iran indicated defiance. Hardliners continues in power has a huge consequence for oil prices going forward. The regime has played its ’oil-weapon’ (closing or chocking the Strait of Hormuz). It is using it to achieve political goals. Deterrence: it needs to be so politically and economically expensive to attack Iran that it won’t happen again in the future. Or at least that the US/Israel thinks 10-times over before they attack again. The highest Brent crude oil closing price since the start of the war is $112.19/b last Friday. In comparison the 20-year inflation adjusted Brent price is $103/b. So Brent crude last Friday at $112.19/b isn’t a shockingly high price. And it is still far below the nominal high of $148/b from 2008 which is $220/b if inflation adjusted. So once in a lifetime Iran activates its most powerful weapon. The oil weapon. It needs to show the power of this weapon and it needs to reap political gains. Getting Brent to $112/b and intraday high of $119.5/b (9 March) isn’t a display of the power of that weapon. And it is not a deterrence against future attacks.
So if the hardliners remain in power in Iran, then the SoH will likely remain chocked all the way to US midterm elections and Brent crude will at a minimum go above the historical nominal high of $148/b from 2008.
Thus the outlook for the oil price for the rest of the year doesn’t depend all that much of whether Trump pulls a TACO or not. Stops bombing or not. It depends more on who is in charge in Iran. If it is the hardliners, then deterrence against future attacks via chocking of the SoH and high oil prices is the likely line of action. It is impacting the world but the Iranian ’oil-weapon’ is directed towards the US president and the the US midterm elections.
If a pragmatic faction gets to power in Iran, then a very prosperous future is possible. However, if power is shifting towards a more pragmatic faction in Iran then a completely different direction could evolve. Such a faction could possibly be open for cooperation with the US and the GCC and possibly put its issues versus Israel aside. Then the prosperity we have seen evolving in Dubai could be a possible future also for Iran.
So far it looks like the hardliners are fully in charge. As far as we can see, the hardliners are still fully in control in Iran. That points towards continued chocking of the SoH and oil prices ticking higher as global inventories (the oil market buffers) are drawn lower. And not just for a few more weeks, but possibly all the way to the US midterm elections.
A brief sigh of relief yesterday as oil infra at Kharg wasn’t damaged. But higher today. Brent crude dabbled around a bit yesterday in relief that oil infrastructure at Iran’s Kharg island wasn’t damaged. It traded briefly below the 100-line and in a range of $99.54 – 106.5/b. Its close was near the low at $100.21/b.
No easy victorious way out for Trump. So no end in sight yet. Brent is up 3.2% today to $103.4/b with no signs that the war will end anytime soon. Trump has no easy way to declare victory and mission accomplished as long as Iran is in full control of the Strait of Hormuz while also holding some 440 kg of uranium enriched to 60% and not far from weapons grade at 90%. As long as these two factors are unresolved it is difficult for Trump to pull out of the Middle East. Naturally he gets increasingly frustrated over the situation as the oil price and US retail gas prices keeps ticking higher while the US is tied into the mess in the Middle East. Trying to drag NATO members into his mess but not much luck there.
When commodity prices spike they spike 2x, 3x, 4x or 5x. Supply and demand for commodities are notoriously inflexible. When either of them shifts sharply, the the price can easily go to zero (April 2022) or multiply 2x, 3x, or even 5x of normal. Examples in case cobalt in 2025 where Kongo restricted supply and the price doubled. Global LNG in 2022 where the price went 5x normal for the full year average. Demand for tungsten in ammunition is up strongly along with full war in the middle east. And its price? Up 537%.
Why hasn’t the Brent crude oil price gone 2x, 3x, 4x or 5x versus its normal of $68/b given close to full stop in the flow of oil of the Strait of Hormuz? We are after all talking about close to 20% of global supply being disrupted. The reason is the buffers. It is fairly easy to store oil. Commercial operators only hold stocks for logistical variations. It is a lot of oil in commercial stocks, but that is predominantly because the whole oil system is so huge. In addition we have Strategic Petroleum Reserves (SPRs) of close to 2500 mb of crude and 1000 mb of oil products. The IEA last week decided to release 400 mb from global SPR. Equal to 20 days of full closure of the Strait of Hormuz. Thus oil in commercial stocks on land, commercial oil in transit at sea and release of oil from SPRs is currently buffering the situation.
But we are running the buffers down day by day. As a result we see gradually increasing stress here and there in the global oil market. Asia is feeling the pinch the most. It has very low self sufficiency of oil and most of the exports from the Gulf normally head to Asia. Availability of propane and butane many places in India (LPG) has dried up very quickly. Local prices have tripled as a result. Local availability of crude, bunker oil, fuel oil, jet fuel, naphtha and other oil products is quickly running down to critical levels many places in Asia with prices shooting up. Oman crude oil is marked at $153/b. Jet fuel in Singapore is marked at $191/b.
Oil at sea originating from Strait of Hormuz from before 28 Feb is rapidly emptied. Oil at sea is a large pool of commercial oil. An inventory of oil in constant move. If we assume that the average journey from the Persian Gulf to its destinations has a volume weighted average of 13.5 days then the amount of oil at sea originating from the Persian Gulf when the the US/Israel attacked on 28 Feb was 13.5 days * 20 mb/d = 269 mb. Since the strait closed, this oil has increasingly been delivered at its destinations. Those closest to the Strait, like Pakistan, felt the emptying of this supply chain the fastest. Propane prices shooting to 3x normal there already last week and restaurants serving cold food this week is a result of that. Some 50-60% of Asia’s imports of Naphtha normally originates from the Persian Gulf. So naphtha is a natural pain point for Asia. The Gulf also a large and important exporter of Jet fuel. That shut in has lifted jet prices above $200/b.
To simplify our calculations we assume that no oil has left the Strait since that date and that there is no increase in Saudi exports from Yanbu. Then the draining of this inventory at sea originated from the Persian Gulf will essentially look like this:
The supply chain of oil at sea originating from the Strait of Hormuz is soon empty. Except for oil allowed through the Strait of Hormuz by Iran and increased exports from Yanbu in the Red Sea. Not included here.

Oil at sea is falling fast as oil is delivered without any new refill in the Persian Gulf. Waivers for Russian crude is also shifting Russian crude to consumers. Brent crude will likely start to feel the pinch much more forcefully when oil at sea is drawn down another 200 mb to around 1000 mb. That is not much more than 10 days from here.

Oil and oil products are starting to become very pricy many places. Brent crude has still been shielded from spiking like the others.

Closing at highest since Aug 2022. Brent crude gained 9.2% yesterday. The trading range was limited to $95.2 – 101.85/b with a close at $100.46/b and higher than the Monday close of $98.96/b. Ydy close was the highest close since August 2022. This morning Brent is up 2% to $102.4/b and is trading at the highest intraday level since Monday when it high an intraday high of $119.5/b.
A military hit at Iran’s Kharg island would be a big, big bang for the oil price. The big, big risk for the weekend is that oil infrastructure could be damaged. For example Iran’s Kharg island which is Iran’s major oil export hub. If damaged we would have a longer lasting loss of supply stretching way beyond Trump’s announced ”two more weeks”. It will make the spot price spike higher and it will lift the curve. Brent crude 2027 swap would jump above $80/b immediately. An attack on Kharg island would naturally lead Iran to strike back at other oil infrastructures in the Gulf. Especially those belonging to countries who harbor US military bases. I.e. countries who essentially are supporting the attack by US and Israel towards Iran. Though if not in spirit, then in practical operational terms. An attack on Kharg island would not just lead to a lasting outage of supply from Iran until it would be repaired. It would immediately endanger other oil infrastructure in the region as well and additional lasting loss of supply.
No one in their right mind would dare to sit short oil over the coming weekend. Oil is thus set to close the week at a very strong note today.
Prepare for another 400 mb SPR release next week. This week’s announcement of a 400 mb release from Strategic Oil Reserves totally underwhelmed the market with the oil price going higher rather than lower following the announcement. For one it means that the market expects the war and the closure of the Strait of Hormuz to last longer than Trump’s recent announced ”two more weeks”. 400 mb only amounts to 20 days of lost supply to the world through Hormuz and we are already at day 14. So next week when we are getting close to the 20 day mark, we are likely to see another announcement of another 400 mb release of SPR stocks to the market. Preparing for the next 20 days of war.
Global oil logistics in total disarray. We have previously addressed the issue of the huge logistical web of the global oil market which is now in total disarray. The logistical disruption started to fry the oil market at the end of last week. Helped to spike the oil market on Monday. What we hear from our shipping clients is that the problems with supply of fuels locally in Korea, Singapore, India and Africa are getting worse with physical availability of fuels there drying up. It is getting increasingly difficult to find physical supply of bunker oil with local, physical prices shooting way higher than financial benchmarks. To the point that biofuels have become the cheap option many places. Availability of fuels in the US is still good. Not so surprising as the US is self-sufficient with crude and refineries.
The disruption in global oil logistics doesn’t seem to improve. Rather the opposite. If you cannot get fuel to run your ships, then how can you distribute fuels to where it is needed.
Buy Brent Dec-2026 calls with strike $150/b!! As the days goes by the oil price is ticking higher while Trump is getting one day closer to US midterm elections. Trump was betting that he could put this war to bead well before November. But that will probably not be up to him to decide. It will be up to Iran to decide when to reopen the Strait of Hormuz. It is very hard to imagine that Iran will let Trump easily off the hock after he has killed its Supreme Leader. This will likely go all the way to November. Buy Brent Dec-2026 calls with strike $150/b!!
Brent closed at highest since 2022 ydy. Will end this Friday at a very strong note! Consumers still dreaming of $60/b oil


Christian Kopfer om läget för oljan

Marknaden måste börja betrakta de höga kopparpriserna som det nya normala

Det fysiska spotpriset på brentolja har slagit nytt rekord

40 minuter med Javier Blas om hur världen verkligen påverkas av energikrisen

Efter tillväxten: Guldbrev satsar på expansion i Europa
40 minuter med Javier Blas om hur världen verkligen påverkas av energikrisen

Elpriserna fördubblas, stor osäkerhet inför sommaren

MP Materials, USA:s svar på Kinas dominans över sällsynta jordartsmetaller
Det fysiska spotpriset på brentolja har slagit nytt rekord

Studsvik har idag ansökt om att få bygga 1200-1600 MW kärnkraft i Valdemarsvik
-
 Nyheter2 veckor sedan
40 minuter med Javier Blas om hur världen verkligen påverkas av energikrisen
-
 Nyheter3 veckor sedan
Elpriserna fördubblas, stor osäkerhet inför sommaren
-
 Nyheter4 veckor sedan
MP Materials, USA:s svar på Kinas dominans över sällsynta jordartsmetaller
-
 Nyheter2 veckor sedan
Det fysiska spotpriset på brentolja har slagit nytt rekord
-
 Nyheter4 veckor sedan
Studsvik har idag ansökt om att få bygga 1200-1600 MW kärnkraft i Valdemarsvik
-
 Nyheter2 veckor sedan
Marknaden måste börja betrakta de höga kopparpriserna som det nya normala
-

 Nyheter4 veckor sedan
Matproduktion är beroende av gödsel, Gulfkriget skapar brist
-
Analys4 veckor sedan
TACO (or Whatever It Was) Sends Oil Lower — Iran Keeps Choking Hormuz