

Analys
SHB Råvarubrevet 22 november 2013

 Råvaror allmänt
Kina ger kött på benen
Till slut kom så beslutsdokumentet från Kinas högsta ledare efter landets strategiska högmöte som hålls vart tionde år och banar vägen för det centralstyrda jättelandets utveckling. Tyngdpunkten ligger på reformer och dessa är massiva. Effekterna beror slutligen på hur väl dessa lyckas implementeras men det kommer sannolikt att kosta tillväxt att genomföra. Det blir alltså fortsatt en balansakt för landets ledare att genomföra reformer i en takt som ekonomins utveckling tål. De stora förändringarna har adresserats kända krishärdar som statligt ägda bolags oförmåga att tjäna pengar och reformer av finansmarknaden.
I stora drag hittar vi inte mycket som har direkt påverkan på råvarumarknaden. Det är tydligt att fokus nu ligger på ”mjuka” variabler och tiden med högsta prioritet för antal km byggda järnvägar och motorvägar ligger bakom oss. Mycket infrastruktur kommer dock fortfarande krävas för att öka inkomstnivåerna utanför kustprovinserna men det är en långsam process. För råvarumarknaden blir därför slutsatsen att i närtid kommer balansakten på kniveggen då ledarna ska implementera reformer utan att stjäla tillväxt vara det viktigaste för prisbidraget från Kina.
Sammanfattar vi andra makrohändelser i veckan så har vi både bättre än väntat jobless claims från USA och amerikanskt markit PMI. Från Fed sa Bernanke i tal att nollräntan kan bestå en avsevärd tid efter att QE har avslutats och kanske även långt efter att arbetslöshetströskeln (6,5%) passerats. Tapering är åter på tapeten efter fedprotokollet publicerats där tapering kan väntas de kommande månaderna. HSBC´s preliminära PMI för Kina i november kom in sämre än väntat (50,4 mot väntat 50,8).
Basmetaller
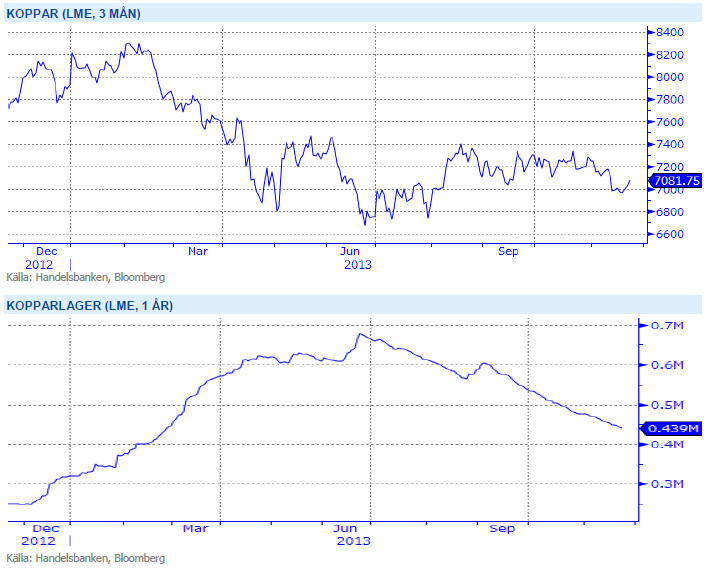
Lugn vecka för metallerna
Metallerna har handlats ganska oförändrat under veckan och vårt basmetallindex likaså. Koppar och nickel sticker dock ut där koppar stiger under veckan dels på grund av ökad import av koppar i Kina, världens största konsument av metallen, men även på fortsatt fallande lager. Nickel däremot slutar veckan på minus och tyngs till motsats till koppar på stigande lager. Nickel fortsätter att handlas långt under produktionskostnad vilket har fått några nickelproducenter att dra ner på kapacitet. Vi väntar att fler följer i samma spår. Nickel handlas nu på 13 560 USD/ton och med en marginalkostnad för produktion på 18 900 USD/ton blir bilden väldigt tydlig.
Det återstår att se vad Kina inköpschefsindex (PMI) kommer in på för november. Det publiceras inte förrän 1 december men under veckan har HSBC´s preliminära PMI visat för en siffra något är lägre än vad marknaden väntat sig. Oktobers PMI var 51,4 och förväntningar för november är något lägre på 51,0.
Vi tror att Kinas tillväxt kommer överraska positivt under Q4 och Q1, vilket kommer stärka metallerna. Vi tror på: LONG BASMETALLER
Ädelmetaller
Guldet fortsätter sin kräftgång
Vi är som bekant negativa till guldet sedan ganska lång tid, och dess kräftgång fortsätter. En analys från Bloomberg från igår hänger upp guldets snara återhämtning på att dollarn ska fortsätta falla, vilket i sig kan ifrågasättas givet Feds förestående nedtrappning kombinerat med ECB:s troligt låga räntor under lång tid framöver. Vår syn på guldets svaghet är upphängd primärt runt att det köps och säljs i syfte att tjäna pengar, alltmedan övriga råvaror köps för att förbrukas, i en förenklad förklaring. Detta gör att när guldköparna inte längre kan sälja till andra guldköpare till högre pris, ja då slutar man köpa. När priset börjar falla så blir det en form av ”chicken race” där man testas i sin uthållighet.
Under 2013 har guldet fallit mot alla valutor, inklusive årets största valutaförlorare, den Sydafrikanska randen. Detta får oss att misstänka att om 2014 blir ett år då dollarn kommer tillbaks, då är det inte omöjligt att det får stor negativ påverkan på guldet.
Veckan som gått har sett guldet falla ytterligare drygt 3.5 procent, och pengarna fortsätter att flöda ur guld-ETF:er (chicken-racet börjar bli smärtsamt). Nuvarande nivå, 1250 dollar per uns, var en motståndsnivå på uppsidan när det bröt igenom år 2010, vilket gör att det kan vara en känslig nivå om vi skulle falla under nu. I den närmast panikartade stämning som rådde i somras föll det så lågt som 1200, varför området mel-lan 1200 och 1250 borde ses som kritiskt. Ett brott här öppnar upp för en rörelse ner mot 1000 dollar per uns, en psykologiskt viktig nivå som ansträngda guldinnehavare inte önskar se.
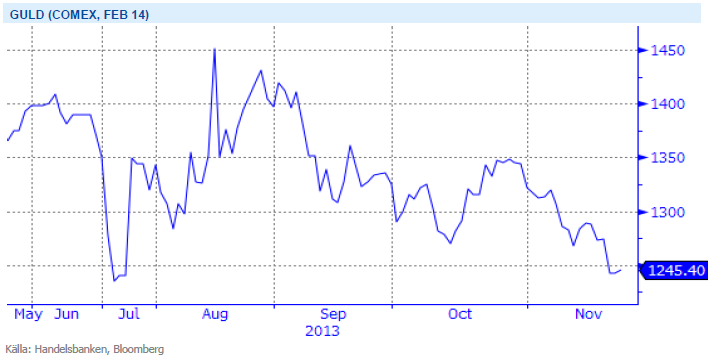
Efter en uppgång under sommaren tror vi åter att guldets väg lutar utför. Vi tror på: SHRT GULD H
Energi
Fortsatt utbudsproblem för oljan
Oljemarknaden stärks ytterligare 1.5 procent under veckan och handlas nu på 110 USD/fat. De två främst drivande faktorerna utöver veckans positiva sysselsättningssiffror och optimism kring USA (USA konsumerar 21 procent av världens olja så minsta förändring i den förväntade efterfrågan brukar slå på en marknad med låg reservkapacitet) är fortsatt Libyen´s utbudsproblem samt Iran där tidigare optimism kring den nukleära tvisten nu slagit om till skepticism och utdragna sanktioner vilket hindrar landets oljeexport. Iran´s produktion var i september endast 2.63 miljoner fat per dag och de lägsta på 23 år (Iran producerade som mest 6.6 mfpd under 1976) och är ned 1 mfpd sedan sanktionerna infördes. Den minskade exporten som fallit från 2.2 mfpd till 700,000 fpd innebär med andra ord att det kostat landet hela 4.2 miljarder USD. Så vad är då risken för att marknaden faller tillbaka vid en eventuell tillfällig lösning? Visst kan marknaden falla tillbaka några dollar direkt på en sådan nyhet men bör ganska snabbt återhämta rörelsen eftersom inget förändrats fundamentalt i marknaden och det lär dröja lång tid innan vi ser denna volym på exportmarknaden då något mer konkret och det kommer ta lång tid. Oljan har nu nått en mer balanserad nivå, dvs ca 5 dollars riskpremie över fundamental nivå om 105 dollar där varje produktionsbortfall och/eller politiskt upptrappning kring MENA´s produktionsländer bör skapa ytterligare möjlighet på uppsidan.
Förra veckans uppgång på elmarknaden raderades ut av kraftiga nederbördsfronter där en ny rekordhög energivolym noterades för Sverige och Norge på 4.1 TWh under ett dygn! Totalt fick vi närmare 3 TWh mer regn än normalt vilket innebär att energibalansen förbättrats till -9.16 TWh. Den långa kurvan (10 år) tappar 2.5 öre till lite drygt 34.5 öre /kWh (36.57 EUR/MWh). Samtidigt som utsläppsrätterna handlas oförändrat fortsätter den positiva trenden på kol, bilden nedan visar utvecklingen på Api2 som nu handlas på 82.20 USD/ ton för närmsta kvartalet och vi räknar med att den trenden håller i sig. Väderprognoserna pekar på ett mer normalbetonat väder de kommande 10-dagarna där vi förväntar oss en neutral till stark utveckling på marknaden nu när all nederbörd diskonterats för.
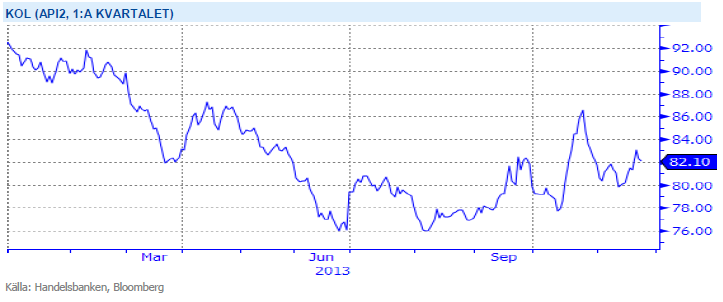
Energiunderskott tillsammans med osäkerhet kring kärnkraftsverken inför vintern talar för högre elpris. Vi tror på: LONG EL
Livsmedel
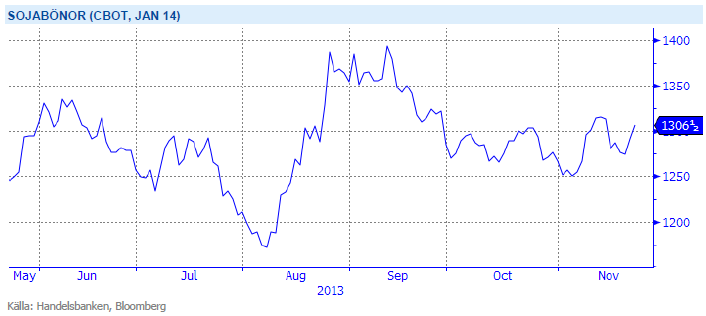
Bra utsikter för sydamerikansk soja
Priserna på majs i Chicago är i stort sett oförändrade jämfört med förra veckan. Skörden i USA är nästan helt klar och inte mycket kan överraska där nu. Argentina har länge varit väl torrt men har fått en del regn nu vilket ses som klart gynnsamt för pågående sådd även om mer önskas – omkring 55 procent av sådden uppges nu vara klar. Utan väderproblem i Sydamerika är det för tillfället svårt att se varför majspriserna skulle börja stiga då tillgången på majs globalt är väldigt god.
Priserna på sojabönor i Chicago noteras upp sedan förra veckan. Skörden i USA är i stort sett helt klar och lär inte bjuda på så mycket överraskningar. Mer intressant att följa nu är väderutvecklingen i Sydamerika, vilken hittills varit tillfredställande. I Argentina uppges sådden vara avklarad till 32 procent. Fortsätter vädret att utvecklas väl och nuvarande produktionsestimat håller kommer globala lager av sojabönor nå nära rekordnivå.
Efter flera år av rekordskördar handlas kaffe idag på femårslägsta. Vi finner kaffe köpvärd och ser risken på nedsidan begränsad. Vi tror på: BULL KAFFE
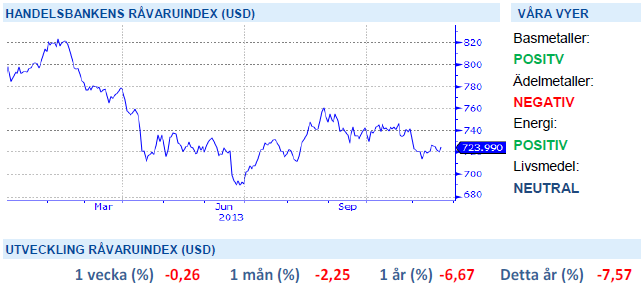
Handelsbankens Råvaruindex
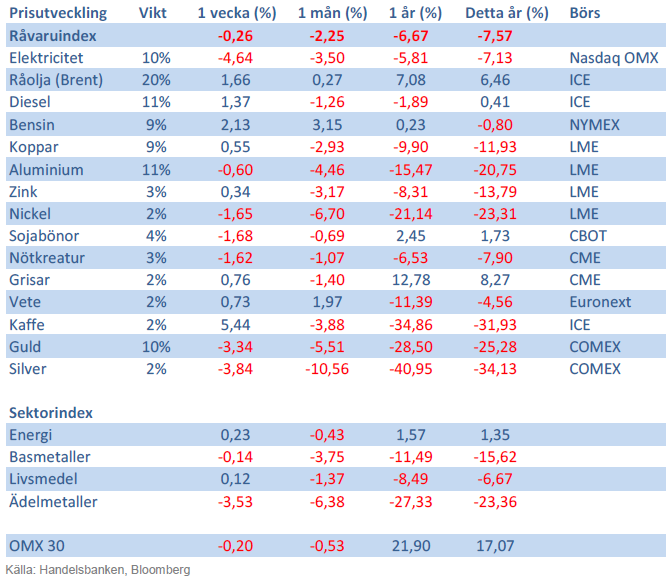
Handelsbankens råvaruindex består av de underliggande indexen för respektive råvara. Vikterna är bestämda till hälften från värdet av nordisk produktion (globala produktionen för sektorindex) och till hälften från likviditeten i terminskontrakten.
[box]SHB Råvarubrevet är producerat av Handelsbanken och publiceras i samarbete och med tillstånd på Råvarumarknaden.se[/box]
Ansvarsbegränsning
Detta material är producerat av Svenska Handelsbanken AB (publ) i fortsättningen kallad Handelsbanken. De som arbetar med innehållet är inte analytiker och materialet är inte oberoende investeringsanalys. Innehållet är uteslutande avsett för kunder i Sverige. Syftet är att ge en allmän information till Handelsbankens kunder och utgör inte ett personligt investeringsråd eller en personlig rekommendation. Informationen ska inte ensamt utgöra underlag för investeringsbeslut. Kunder bör inhämta råd från sina rådgivare och basera sina investeringsbeslut utifrån egen erfarenhet.
Informationen i materialet kan ändras och också avvika från de åsikter som uttrycks i oberoende investeringsanalyser från Handelsbanken. Informationen grundar sig på allmänt tillgänglig information och är hämtad från källor som bedöms som tillförlitliga, men riktigheten kan inte garanteras och informationen kan vara ofullständig eller nedkortad. Ingen del av förslaget får reproduceras eller distribueras till någon annan person utan att Handelsbanken dessförinnan lämnat sitt skriftliga medgivande. Handelsbanken ansvarar inte för att materialet används på ett sätt som strider mot förbudet mot vidarebefordran eller offentliggörs i strid med bankens regler.


Down on Friday. Up on Monday. The Brent June crude oil contract traded down 5.1% last week to a close of $90.38/b. It reached a high of $103.87/b last Monday and a low of $86.09/b on Friday as Iran announced that the Strait of Hormuz was fully open for transit. That quickly changed over the weekend as the US upheld its blockade of Iranian oil exports while Iran naturally responded by closing the SoH again. The US blew a hole in the engine room of the Iranian ship TOUSKA and took custody of the ship on Sunday. Brent crude is up 5.6% this morning to $95.4/b.

The cease-fire is expiring tomorrow. The US has said it will send a delegation for a second round of negotiations in Islamabad in Pakistan. But Iran has for now rejected a second round of talks as it views US demands as unrealistic and excessive while the US is also blocking the Strait of Hormuz.
While Brent is up 5% this morning, the financial market is still very optimistic that progress will be made. That talks will continue and that the SoH will fully open by the start of May which is consistent with a rest-of-year average Brent crude oil price of around $90/b with the market now trading that balance at around $88/b.
Financial optimism vs. physical deterioration. We have a divergence where the financial market is trading negotiations, improvements and resolution while at the same time the physical market is deteriorating day by day. Physical oil flows remain constrained by disrupted flows, longer voyage times and elevated freight and insurance costs.
Financial markets are betting that a US/Iranian resolution will save us in time from violent shortages down the road. But every day that the SoH remains closed is bringing us closer to a potentially very painful point of shortages and much higher prices.
The US blockade is also a weapon of leverage against its European and Asian allies. When Iran closed the SoH it held the world economy as a hostage against the US. The US blockade of the SoH is of course blocking Iranian oil exports. But it is also an action of disruption directed towards Europe and Asia. The US has called for the rest of the world to engaged in the war with Iran: ”If you want oil from the Persian Gulf, then go and get it”. A risk is that the US plays brinkmanship with the global oil market directed towards its European and Asian allies and maybe even towards China to force them to engage and take part. Maybe unthinkable. But unthinkable has become the norm with Trump in the White House.
Wild moves yesterday. Brent crude traded to a high of $114.43/b and a low of $96.0/b and closed at $99.94/b yesterday.
US – Iran negotiations ongoing or not? What a day. Donald Trump announced that good talks were ongoing between Iran and the US and that the 48 hour deadline before bombing Iranian power plants and energy infrastructure was postponed by five days subject to success of ongoing meetings. Iranian media meanwhile stated that no meetings were ongoing at all.
Today we are scratching our heads trying to figure out what yesterday was all about.
Friends and family playing the market? Was it just Trump and his friends and family who were playing with oil and equity markets with $580m and $1.46bn in bets being placed by someone in oil and equity markets just 15 minutes before Trump’s announcement?
Was Trump pulling a TACO as he reached his political and economic pain point: Brent at $112/b, US Gas at $4/gal, SPX below 200dma and US 10yr above 4.4%?
Different Iranian factions with Trump talking with one of them? Are there real negotiations going on but with the US talking to one faction in Iran while another, the hardliners, are not involved and are denying any such negotiations going on?
Extending the ultimatum to attack and invade Kharg island next weekend? Or, is the five day delay of the deadline a tactical decision to allow US amphibious assault ships and marines to arrive in the Gulf in the upcoming weekend while US and Israeli continues to degrade Iranian military targets till then. And then next weekend a move by the US/Israel to attack and conquer for example the Kharg island?
We do not really know which it is or maybe a combination of these.
We did get some kind of TACO ydy. But markets have been waiting for some kind of TACO to happen and yesterday we got some kind of TACO. And Brent crude is now trading at $101.5/b as a result rather than at $112-114/b as it did no the high yesterday.
But what really matters in our view is the political situation on the ground in Iran. Will hardliners continue to hold power or will a more pragmatic faction gain power?
If the hardliners remain in power then oil pain should extend all the way to US midterm elections. The hardliners were apparently still in charge as of last week. Iran immediately retaliated and damaged LNG infrastructure in Qatar after Israel hit Iranian South Pars. The SoH was still closed and all messages coming out of Iran indicated defiance. Hardliners continues in power has a huge consequence for oil prices going forward. The regime has played its ’oil-weapon’ (closing or chocking the Strait of Hormuz). It is using it to achieve political goals. Deterrence: it needs to be so politically and economically expensive to attack Iran that it won’t happen again in the future. Or at least that the US/Israel thinks 10-times over before they attack again. The highest Brent crude oil closing price since the start of the war is $112.19/b last Friday. In comparison the 20-year inflation adjusted Brent price is $103/b. So Brent crude last Friday at $112.19/b isn’t a shockingly high price. And it is still far below the nominal high of $148/b from 2008 which is $220/b if inflation adjusted. So once in a lifetime Iran activates its most powerful weapon. The oil weapon. It needs to show the power of this weapon and it needs to reap political gains. Getting Brent to $112/b and intraday high of $119.5/b (9 March) isn’t a display of the power of that weapon. And it is not a deterrence against future attacks.
So if the hardliners remain in power in Iran, then the SoH will likely remain chocked all the way to US midterm elections and Brent crude will at a minimum go above the historical nominal high of $148/b from 2008.
Thus the outlook for the oil price for the rest of the year doesn’t depend all that much of whether Trump pulls a TACO or not. Stops bombing or not. It depends more on who is in charge in Iran. If it is the hardliners, then deterrence against future attacks via chocking of the SoH and high oil prices is the likely line of action. It is impacting the world but the Iranian ’oil-weapon’ is directed towards the US president and the the US midterm elections.
If a pragmatic faction gets to power in Iran, then a very prosperous future is possible. However, if power is shifting towards a more pragmatic faction in Iran then a completely different direction could evolve. Such a faction could possibly be open for cooperation with the US and the GCC and possibly put its issues versus Israel aside. Then the prosperity we have seen evolving in Dubai could be a possible future also for Iran.
So far it looks like the hardliners are fully in charge. As far as we can see, the hardliners are still fully in control in Iran. That points towards continued chocking of the SoH and oil prices ticking higher as global inventories (the oil market buffers) are drawn lower. And not just for a few more weeks, but possibly all the way to the US midterm elections.
A brief sigh of relief yesterday as oil infra at Kharg wasn’t damaged. But higher today. Brent crude dabbled around a bit yesterday in relief that oil infrastructure at Iran’s Kharg island wasn’t damaged. It traded briefly below the 100-line and in a range of $99.54 – 106.5/b. Its close was near the low at $100.21/b.
No easy victorious way out for Trump. So no end in sight yet. Brent is up 3.2% today to $103.4/b with no signs that the war will end anytime soon. Trump has no easy way to declare victory and mission accomplished as long as Iran is in full control of the Strait of Hormuz while also holding some 440 kg of uranium enriched to 60% and not far from weapons grade at 90%. As long as these two factors are unresolved it is difficult for Trump to pull out of the Middle East. Naturally he gets increasingly frustrated over the situation as the oil price and US retail gas prices keeps ticking higher while the US is tied into the mess in the Middle East. Trying to drag NATO members into his mess but not much luck there.
When commodity prices spike they spike 2x, 3x, 4x or 5x. Supply and demand for commodities are notoriously inflexible. When either of them shifts sharply, the the price can easily go to zero (April 2022) or multiply 2x, 3x, or even 5x of normal. Examples in case cobalt in 2025 where Kongo restricted supply and the price doubled. Global LNG in 2022 where the price went 5x normal for the full year average. Demand for tungsten in ammunition is up strongly along with full war in the middle east. And its price? Up 537%.
Why hasn’t the Brent crude oil price gone 2x, 3x, 4x or 5x versus its normal of $68/b given close to full stop in the flow of oil of the Strait of Hormuz? We are after all talking about close to 20% of global supply being disrupted. The reason is the buffers. It is fairly easy to store oil. Commercial operators only hold stocks for logistical variations. It is a lot of oil in commercial stocks, but that is predominantly because the whole oil system is so huge. In addition we have Strategic Petroleum Reserves (SPRs) of close to 2500 mb of crude and 1000 mb of oil products. The IEA last week decided to release 400 mb from global SPR. Equal to 20 days of full closure of the Strait of Hormuz. Thus oil in commercial stocks on land, commercial oil in transit at sea and release of oil from SPRs is currently buffering the situation.
But we are running the buffers down day by day. As a result we see gradually increasing stress here and there in the global oil market. Asia is feeling the pinch the most. It has very low self sufficiency of oil and most of the exports from the Gulf normally head to Asia. Availability of propane and butane many places in India (LPG) has dried up very quickly. Local prices have tripled as a result. Local availability of crude, bunker oil, fuel oil, jet fuel, naphtha and other oil products is quickly running down to critical levels many places in Asia with prices shooting up. Oman crude oil is marked at $153/b. Jet fuel in Singapore is marked at $191/b.
Oil at sea originating from Strait of Hormuz from before 28 Feb is rapidly emptied. Oil at sea is a large pool of commercial oil. An inventory of oil in constant move. If we assume that the average journey from the Persian Gulf to its destinations has a volume weighted average of 13.5 days then the amount of oil at sea originating from the Persian Gulf when the the US/Israel attacked on 28 Feb was 13.5 days * 20 mb/d = 269 mb. Since the strait closed, this oil has increasingly been delivered at its destinations. Those closest to the Strait, like Pakistan, felt the emptying of this supply chain the fastest. Propane prices shooting to 3x normal there already last week and restaurants serving cold food this week is a result of that. Some 50-60% of Asia’s imports of Naphtha normally originates from the Persian Gulf. So naphtha is a natural pain point for Asia. The Gulf also a large and important exporter of Jet fuel. That shut in has lifted jet prices above $200/b.
To simplify our calculations we assume that no oil has left the Strait since that date and that there is no increase in Saudi exports from Yanbu. Then the draining of this inventory at sea originated from the Persian Gulf will essentially look like this:
The supply chain of oil at sea originating from the Strait of Hormuz is soon empty. Except for oil allowed through the Strait of Hormuz by Iran and increased exports from Yanbu in the Red Sea. Not included here.

Oil at sea is falling fast as oil is delivered without any new refill in the Persian Gulf. Waivers for Russian crude is also shifting Russian crude to consumers. Brent crude will likely start to feel the pinch much more forcefully when oil at sea is drawn down another 200 mb to around 1000 mb. That is not much more than 10 days from here.

Oil and oil products are starting to become very pricy many places. Brent crude has still been shielded from spiking like the others.


Market Still Betting on Timely Resolution, But Each Day Raises Shortage Risk

Christian Kopfer om läget för oljan

Marknaden måste börja betrakta de höga kopparpriserna som det nya normala

Det fysiska spotpriset på brentolja har slagit nytt rekord

40 minuter med Javier Blas om hur världen verkligen påverkas av energikrisen
40 minuter med Javier Blas om hur världen verkligen påverkas av energikrisen

Elpriserna fördubblas, stor osäkerhet inför sommaren

MP Materials, USA:s svar på Kinas dominans över sällsynta jordartsmetaller
Det fysiska spotpriset på brentolja har slagit nytt rekord

Studsvik har idag ansökt om att få bygga 1200-1600 MW kärnkraft i Valdemarsvik
-
 Nyheter3 veckor sedan
40 minuter med Javier Blas om hur världen verkligen påverkas av energikrisen
-
 Nyheter4 veckor sedan
Elpriserna fördubblas, stor osäkerhet inför sommaren
-
 Nyheter4 veckor sedan
MP Materials, USA:s svar på Kinas dominans över sällsynta jordartsmetaller
-
 Nyheter2 veckor sedan
Det fysiska spotpriset på brentolja har slagit nytt rekord
-
 Nyheter4 veckor sedan
Studsvik har idag ansökt om att få bygga 1200-1600 MW kärnkraft i Valdemarsvik
-
 Nyheter2 veckor sedan
Marknaden måste börja betrakta de höga kopparpriserna som det nya normala
-
Analys4 veckor sedan
TACO (or Whatever It Was) Sends Oil Lower — Iran Keeps Choking Hormuz
-

 Nyheter4 veckor sedan
Matproduktion är beroende av gödsel, Gulfkriget skapar brist