

Analys
SHB Råvarubrevet 16 augusti 2013

 Råvaror allmänt
Back to School
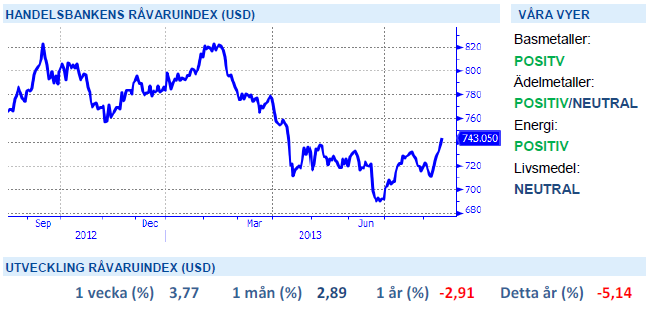
Efter sköna lata dagar är de flesta tillbaka på arbetsplatsen och fokus ligger åter på ekonomisk data och aktuella teman för hösten. Tre teman kommer dominera prisutvecklingen för industriråvaror under andra halvåret: Eurozonen, Fed och Kina. En glad överraskning efter sommaren var att Eurozonen hoppade upp ur recessionsträsket. 0,3 % tillväxt under Q2 är såklart välkommet som bidrag till globala tillväxten. Visserligen kommer inte positiv tillväxt i Eurozonen, skapad av Tyskland och Frankrike, att lösa de djupt rotade problemen i de perifera länderna i Europa, de kan till och med bli en negativ effekt spunnen ur den starkare eurokursen som kommer av starka kärnländer, men givet rådande låga förväntningar på EMU så tror vi att EMU data har potential att driva prisuppgångar framöver. Sammanfattningsvis är recensionen över medan skuldkrisen lever.
Om Eurozonen är marginellt bättre så kompenseras det av Feds påbörjan av att minska sitt bidrag till marknaden. Antagligen redan i september men i kombination med löften om att hålla räntorna låga mycket längre. Därför tror vi att ”tapering” endast får liten negativ inverkan på råvarupriser. Temat har varit känt sedan maj, övriga centralbanker är fortfarande expansiva och Fed väntas enbart trimma sina stödköp om USA:s ekonomi fortsätter att stärkas.
Om vi antar att dessa båda teman balanserar varandra (om än med övervikt åt positiv EMU effekt) så återstår Kina som det osäkra kortet. Senaste omgången med data var klart bättre än väntat. Handelsdata och råvaruimport var klarast lysande stjärnor. Råvaruimporten av de fyra stora, järnmalm, olja, koppar och sojabönor var den högsta på ett år. Ett sammanträffande som säger något då dessa råvaror används i vitt skilda sektorer. Uppgången har drivits av ökade investeringar och ökad kreditgivning tidigare i år. För råvarornas del tror vi att det handlar om en klassik ”restocking” där lagerkedjan är på mycket låga nivåer efter besvärliga tider och åtstramade krediter i Kina. Vårt argument för att det inte rör sig om en ökad slutkonsumtion är främst industri PMI som hovrar omkring 50-strecket. Icke desto mindre kan lagerrörelsen driva industriråvaror under en månad eller två.
Basmetaller
Kina stärker metallerna
Kinas ekonomi har tappat fart under 9 av de 10 senaste kvartalen. Efter en serie av små förändringar från beslutsfattare så har trenden (åtminstone tillfälligt) vänt. Under juli steg industriproduktion, investeringar och bostadsbyggande. De är de viktigaste kategorierna för basmetaller som följaktligen också har stigit i pris. Vårt basmetallindex steg med 6 % under första halvan av augusti där samtliga basmetaller har stärkts med 6-8 %.
Extra bränsle fick brasan av en urstark kinesisk råvaruimport. Denna är visserligen laggad då det tar 6 veckor att skeppa koppar från Chile och järnmalm och sojabönor från Brasilien till Kina men att importen var upp bland vitt skilda råvaror är ett styrketecken. Basmetaller har varit hårt nedtryckta av korta positioner och med en starkare dataström från Kina så ska många korta positioner ut ur LME metallerna. Vi tror på stigande basmetaller med nickel som favorit.
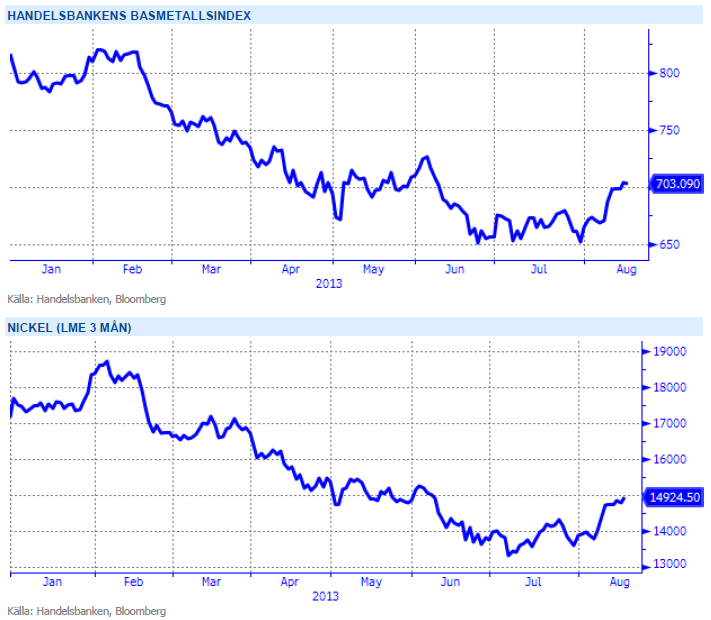
Nickel är den basmetall som gått ner mest under året och med många gruvor som går med förlust på dagens prisnivåer tror vi på stigande priser. Vi tror på: LONG NICKEL H
Ädelmetaller
Guldet fortsatt starkt
Den 1 juli presenterade vi ett kortsiktigt köpcase på guld, baserat på att priset då rasat väldigt mycket på kort tid, på att kvartalsskiftet orsakade extra stora försäljningar, och på att inflationsförväntningarna börjat stiga igen. Vidare såg guldet rent tekniskt ut att vara översålt. Sedan dess har guldet gått från 1240 dollar per uns till nuvarande 1360 dollar, en uppgång på ca.10 procent. Vi tror att uppgången har lite mer att hämta, även om vi alltjämt håller i vår mer långsiktigt negativa vy.
Den nuvarande drivkraften är primärt den tragiska utvecklingen i Egypten som skapar riskaversion och flykt till mer upplevt säkra tillgångar som guld. Det är dock viktigt att ”dansa nära nödutgången” när man handlar mot sin långsiktiga vy, så vi måste vara påpassliga för plötsliga prisfall orsakade av bättre riskaptit eller fallande inflationsförväntningar. Vi ser fortfarande 1450 som en rimlig nivå att nå i denna uppåtrörelse.
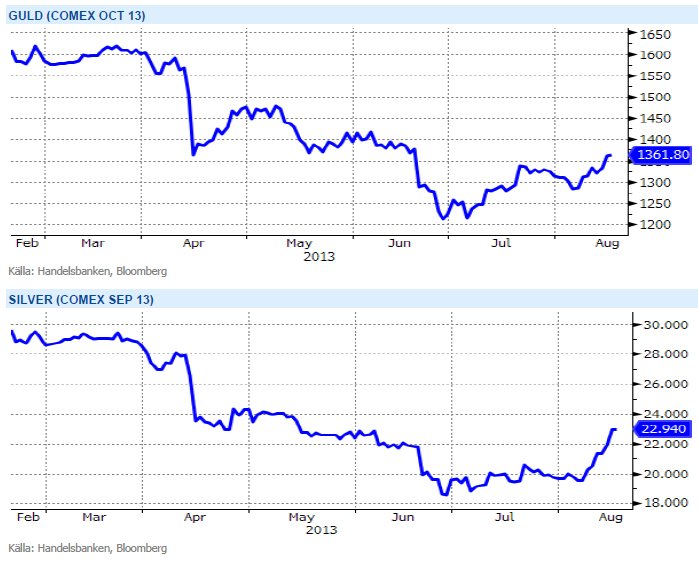
I ett läge där råvaror generellt har viktats ned av institutionella placerare kan guld och silver få en ”omotiverad” uppgång när dessa indexköpare återvänder till råvaror drivit av bättre utsikter för Kina och USA. Vi tror på : LONG GULD H och LONG SILVER H
Energi
Dyrare olja i sommar
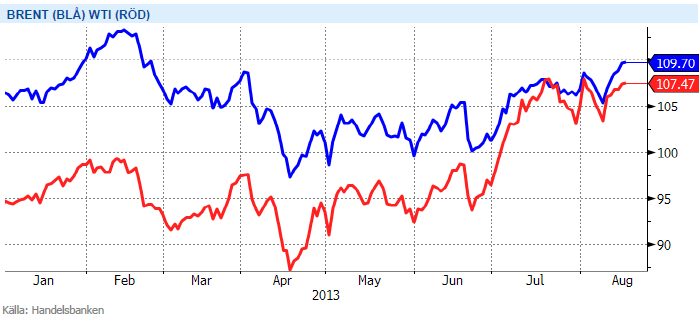
Stigande WTI olja och efterföljande Brent har dragit rubriker i sommar. För WTI handlar det mest om att logistiska knutar har lösts upp i USA och ökat utflödet från Cushing som är leveranspunkten för WTI. Lägre lager som sammanföll med stark bensinefterfrågan under driving season stärkte också priset. Brentoljan har också stigit, drivit av högre WTI och oroligheterna i Egypten/ Mellanöstern. Egypten i sig är inget stort oljeland men som stor ekonomi viktig för regionens (in)stabilitet. Presidentbyte i Iran har ännu inte lett till förändrad kommunikation kring sanktionerna. Rouhani är dock mer västvänlig än sin föregångare. I dagsläget är utbudstörningar i Irak mer prisdrivande. Ökat våld och politiskt vakuum har fått produktionsutsikterna på fall. Irak är idag OPEC:s näst största medlem sedan sanktionerna mot Iran infördes. Saudi har redan växlat upp produktionen för att kompensera vilket fått ner Brent något. Saudis roll är alltså inte över trots den boomande oljeproduktionen i USA.
Den korta elpriskurvan stärktes tillfälligt under sommaren med närmare 6 procent vilket främst orsakades av torrt väder och stigande kolpriser. Den hydrologiska balansen försämrades från -6 TWh till -11Twh för att sedan åter falla tillbaka till -6 TWh samtidigt som den negativa trenden på kolmarknaden fortsätter. Såväl gas som utsläppsrätterna handlas i stort sett oförändrat över sommaren samtidigt som spotpriserna i Norden kommer in på stabila nivåer, ca 30 öre per kWh i snitt sedan 1 juni och 33.5 öre i snitt hittills i år. Utsikterna framöver pekar på ett torrare scenario mot normalt vilket i kombination med något starkare kontinentala marknader bör ge fortsatt stöd i en semesterlugn elmarknad.
Utsikterna framöver pekar på ett torrare scenario mot normalt vilket i kombination med något starkare kontinentala marknader bör ge fortsatt stöd. Vi tror på: LONG EL
Livsmedel
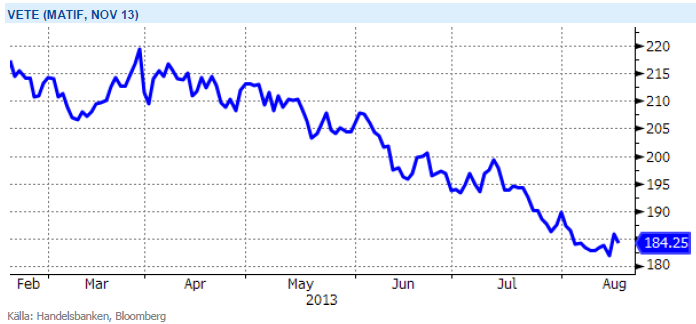
Goda skördar pressar priset
Priserna på de stora jordbruksgrödorna vete, majs och soja har fallit kraftigt under sommaren. I april skrev vi om ett lägre pris på vete framtill hösten på 15-18%, det har sedan dess fallit 15 % och därmed har vi sett det stora fall vi förväntade oss. Det finns fortfarande kvar risk på nedsidan men det kan vara dags att ta hem vinst för korta positioner. Anledningen till prisrasen är främst en generellt sett gynnsam utveckling för grödorna i flera viktiga odlingsområden. Majsen och sojan i USA fick en dålig och sen start men har därefter upplevt en ganska lång period av nära idealiska förhållanden. Förväntningarna på kommande skörd har med tiden skrivits upp flera gånger – det samtidigt som tiden för eventuella bakslag hela tiden minskat. Efter de stora prisfallen har priset på vete, majs och soja neutraliserats men vi ser fortsatt risk på nedsidan – om än mindre än tidigare.
För kakao har uteblivet regn och torka har ökat risken för minskad skörd i Elfenbenskusten, vilket har pressat upp priset till två års högsta. Vi ser också signaler på stigande konsumtion i tillväxtländerna och står därför kvar vid vår vy om fortsatt stigande kakaopris.
I många kaffeproducerande länder däremot, med Brasilien i spetsen, har det regnat i mängder under odlingsperioden och det råder viss oro kring kvalitén på kaffebönorna nu när vi går mot senare delen av skördeperioden. Förseningen har lett till att en del odlare sålt sin skörd till reducerade priser. Förutom nederbörden i Brasilien och fortsatta problem i Centralamerika och Mexico med svampsjukdomar väntas världsproduktionen på kaffe för säsongen 2013/-14 komma att minsta med 3 procent medan en blygsam ökning väntas på konsumtionssidan. Med andra ord så finns det än så länge gott om kaffe på marknaden varför vi tror på terminspris (frontkontrakt) under 1,25 dollar/Ib.
Sammanfattningsvis håller vi en neutral för vårt livsmedelsindex.
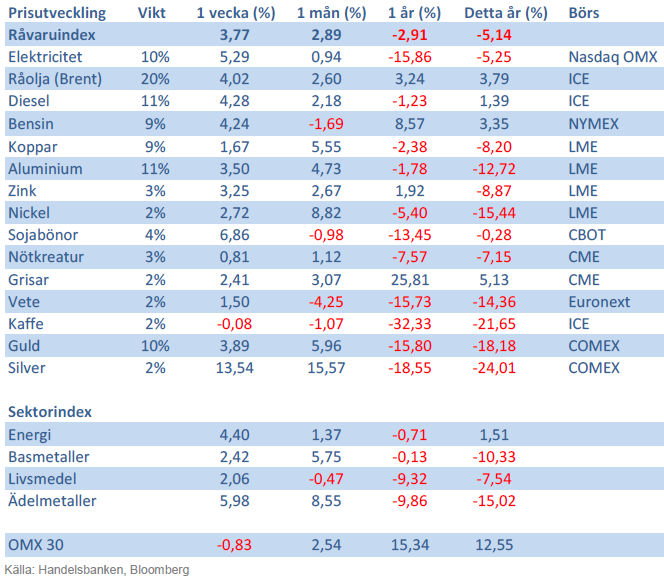
Handelsbankens råvaruindex
[box]SHB Råvarubrevet är producerat av Handelsbanken och publiceras i samarbete och med tillstånd på Råvarumarknaden.se[/box]
Ansvarsbegränsning
Detta material är producerat av Svenska Handelsbanken AB (publ) i fortsättningen kallad Handelsbanken. De som arbetar med innehållet är inte analytiker och materialet är inte oberoende investeringsanalys. Innehållet är uteslutande avsett för kunder i Sverige. Syftet är att ge en allmän information till Handelsbankens kunder och utgör inte ett personligt investeringsråd eller en personlig rekommendation. Informationen ska inte ensamt utgöra underlag för investeringsbeslut. Kunder bör inhämta råd från sina rådgivare och basera sina investeringsbeslut utifrån egen erfarenhet.
Informationen i materialet kan ändras och också avvika från de åsikter som uttrycks i oberoende investeringsanalyser från Handelsbanken. Informationen grundar sig på allmänt tillgänglig information och är hämtad från källor som bedöms som tillförlitliga, men riktigheten kan inte garanteras och informationen kan vara ofullständig eller nedkortad. Ingen del av förslaget får reproduceras eller distribueras till någon annan person utan att Handelsbanken dessförinnan lämnat sitt skriftliga medgivande. Handelsbanken ansvarar inte för att materialet används på ett sätt som strider mot förbudet mot vidarebefordran eller offentliggörs i strid med bankens regler.


Brent crude has climbed roughly USD 1.5-2 per barrel since Friday, yet falling USD 0.3 per barrel this mornig and currently trading near USD 67.25/bbl after yesterday’s climb. While the rally reflects short-term geopolitical tension, price action has been choppy, and crude remains locked in a broader range – caught between supply-side pressure and spot resilience.

Prices have been supported by renewed Ukrainian drone strikes targeting Russian infrastructure. Over the weekend, falling debris triggered a fire at the 20mtpa Kirishi refinery, following last week’s attack on the key Primorsk terminal.
Argus estimates that these attacks have halted ish 300 kbl/d of Russian refining capacity in August and September. While the market impact is limited for now, the action signals Kyiv’s growing willingness to disrupt oil flows – supporting a soft geopolitical floor under prices.
The political environment is shifting: the EU is reportedly considering sanctions on Indian and Chinese firms facilitating Russian crude flows, while the U.S. has so far held back – despite Bessent warning that any action from Washington depends on broader European participation. Senator Graham has also publicly criticized NATO members like Slovakia and Hungary for continuing Russian oil imports.
It’s worth noting that China and India remain the two largest buyers of Russian barrels since the invasion of Ukraine. While New Delhi has been hit with 50% secondary tariffs, Beijing has been spared so far.
Still, the broader supply/demand balance leans bearish. Futures markets reflect this: Brent’s prompt spread (gauge of near-term tightness) has narrowed to the current USD 0.42/bl, down from USD 0.96/bl two months ago, pointing to weakening backwardation.
This aligns with expectations for a record surplus in 2026, largely driven by the faster-than-anticipated return of OPEC+ barrels to market. OPEC+ is gathering in Vienna this week to begin revising member production capacity estimates – setting the stage for new output baselines from 2027. The group aims to agree on how to define “maximum sustainable capacity,” with a proposal expected by year-end.
While the IEA pegs OPEC+ capacity at 47.9 million barrels per day, actual output in August was only 42.4 million barrels per day. Disagreements over data and quota fairness (especially from Iraq and Nigeria) have already delayed this process. Angola even quit the group last year after being assigned a lower target than expected. It also remains unclear whether Russia and Iraq can regain earlier output levels due to infrastructure constraints.
Also, macro remains another key driver this week. A 25bp Fed rate cut is widely expected tomorrow (Wednesday), and commodities in general could benefit a potential cut.
Summing up: Brent crude continues to drift sideways, finding near-term support from geopolitics and refining strength. But with surplus building and market structure softening, the upside may remain capped.
Brent crude is essentially flat on the week, but after a volatile ride. Prices started Monday near USD 65.5/bl, climbed steadily to a mid-week high of USD 67.8/bl on Wednesday evening, before falling sharply – losing about USD 2/bl during Thursday’s session.
Brent is currently trading around USD 65.8/bl, right back where it began. The volatility reflects the market’s ongoing struggle to balance growing surplus risks against persistent geopolitical uncertainty and resilient refined product margins. Thursday’s slide snapped a three-day rally and came largely in response to a string of bearish signals, most notably from the IEA’s updated short-term outlook.
The IEA now projects record global oversupply in 2026, reinforcing concerns flagged earlier by the U.S. EIA, which already sees inventories building this quarter. The forecast comes just days after OPEC+ confirmed it will continue returning idle barrels to the market in October – albeit at a slower pace of +137,000 bl/d. While modest, the move underscores a steady push to reclaim market share and adds to supply-side pressure into year-end.
Thursday’s price drop also followed geopolitical incidences: Israeli airstrikes reportedly targeted Hamas leadership in Doha, while Russian drones crossed into Polish airspace – events that initially sent crude higher as traders covered short positions.
Yet, sentiment remains broadly cautious. Strong refining margins and low inventories at key pricing hubs like Europe continue to support the downside. Chinese stockpiling of discounted Russian barrels and tightness in refined product markets – especially diesel – are also lending support.
On the demand side, the IEA revised up its 2025 global demand growth forecast by 60,000 bl/d to 740,000 bl/d YoY, while leaving 2026 unchanged at 698,000 bl/d. Interestingly, the agency also signaled that its next long-term report could show global oil demand rising through 2050.
Meanwhile, OPEC offered a contrasting view in its latest Monthly Oil Market Report, maintaining expectations for a supply deficit both this year and next, even as its members raise output. The group kept its demand growth estimates for 2025 and 2026 unchanged at 1.29 million bl/d and 1.38 million bl/d, respectively.
We continue to watch whether the bearish supply outlook will outweigh geopolitical risk, and if Brent can continue to find support above USD 65/bl – a level increasingly seen as a soft floor for OPEC+ policy.
Brent crude makes some gains as Israel’s attack on Hamas in Qatar rattles markets. Brent crude spiked to a high of USD 67.38/b yesterday as Israel made a strike on Hamas in Qatar. But it wasn’t able to hold on to that level and only closed up 0.6% in the end at USD 66.39/b. This morning it is starting on the up with a gain of 0.9% at USD 67/b. Still rattled by Israel’s attack on Hamas in Qatar yesterday. Brent is getting some help on the margin this morning with Asian equities higher and copper gaining half a percent. But the dark cloud of surplus ahead is nonetheless hanging over the market with Brent trading two dollar lower than last Tuesday.

Geopolitical risk premiums in oil rarely lasts long unless actual supply disruption kicks in. While Israel’s attack on Hamas in Qatar is shocking, the geopolitical risk lifting crude oil yesterday and this morning is unlikely to last very long as such geopolitical risk premiums usually do not last long unless real disruption kicks in.
US API data yesterday indicated a US crude and product stock build last week of 3.1 mb. The US API last evening released partial US oil inventory data indicating that US crude stocks rose 1.3 mb and middle distillates rose 1.5 mb while gasoline rose 0.3 mb. In total a bit more than 3 mb increase. US crude and product stocks usually rise around 1 mb per week this time of year. So US commercial crude and product stock rose 2 mb over the past week adjusted for the seasonal norm. Official and complete data are due today at 16:30.
A 2 mb/week seasonally adj. US stock build implies a 1 – 1.4 mb/d global surplus if it is persistent. Assume that if the global oil market is running a surplus then some 20% to 30% of that surplus ends up in US commercial inventories. A 2 mb seasonally adjusted inventory build equals 286 kb/d. Divide by 0.2 to 0.3 and we get an implied global surplus of 950 kb/d to 1430 kb/d. A 2 mb/week seasonally adjusted build in US oil inventories is close to noise unless it is a persistent pattern every week.
US IEA STEO oil report: Robust surplus ahead and Brent averaging USD 51/b in 2026. The US EIA yesterday released its monthly STEO oil report. It projected a large and persistent surplus ahead. It estimates a global surplus of 2.2 m/d from September to December this year. A 2.4 mb/d surplus in Q1-26 and an average surplus for 2026 of 1.6 mb/d resulting in an average Brent crude oil price of USD 51/b next year. And that includes an assumption where OPEC crude oil production only averages 27.8 mb/d in 2026 versus 27.0 mb/d in 2024 and 28.6 mb/d in August.
Brent will feel the bear-pressure once US/OECD stocks starts visible build. In the meanwhile the oil market sits waiting for this projected surplus to materialize in US and OECD inventories. Once they visibly starts to build on a consistent basis, then Brent crude will likely quickly lose altitude. And unless some unforeseen supply disruption kicks in, it is bound to happen.
US IEA STEO September report. In total not much different than it was in January

US IEA STEO September report. US crude oil production contracting in 2026, but NGLs still growing. Close to zero net liquids growth in total.


Tyskland har så höga elpriser att företag inte har råd att använda elektricitet
Brent crude ticks higher on tension, but market structure stays soft

Kinas elproduktion slog nytt rekord i augusti, vilket även kolkraft gjorde

Det stigande guldpriset en utmaning för smyckesköpare

Aktier i guldbolag laggar priset på guld

Meta bygger ett AI-datacenter på 5 GW och 2,25 GW gaskraftverk
Aker BP gör ett av Norges största oljefynd på ett decennium, stärker resurserna i Yggdrasilområdet
Brent edges higher as India–Russia oil trade draws U.S. ire and Powell takes the stage at Jackson Hole

Mahvie Minerals är verksamt i guldrikt område i Finland
Increasing risk that OPEC+ will unwind the last 1.65 mb/d of cuts when they meet on 7 September
-
 Nyheter4 veckor sedan
Meta bygger ett AI-datacenter på 5 GW och 2,25 GW gaskraftverk
-
 Nyheter4 veckor sedan
Aker BP gör ett av Norges största oljefynd på ett decennium, stärker resurserna i Yggdrasilområdet
-
Analys4 veckor sedan
Brent edges higher as India–Russia oil trade draws U.S. ire and Powell takes the stage at Jackson Hole
-
 Nyheter3 veckor sedan
Mahvie Minerals är verksamt i guldrikt område i Finland
-
Analys4 veckor sedan
Increasing risk that OPEC+ will unwind the last 1.65 mb/d of cuts when they meet on 7 September
-

 Nyheter4 veckor sedan
Neil Atkinson spår att priset på olja kommer att stiga till 70 USD
-

 Nyheter2 veckor sedan
Eurobattery Minerals satsar på kritiska metaller för Europas självförsörjning
-
Analys2 veckor sedan
OPEC+ in a process of retaking market share