

Analys
SHB Råvarubrevet 15 november 2013

 Råvaror allmänt
Ökad sysselsättning i USA
Positiv data i form av Amerikansk sysselsättning gav stöd åt råvarumarknaden. Sysselsättningen för oktober steg kraftigt och sysselsättningen för september reviderades upp. Med tanke på nedstängningen av en del statliga myndigheter och de svårigheter som då uppstod var utfallet klart över förväntan. Det starka utfallet ökar på marginalen sannolikheten för att Federal Reserve påbörjar nedskalningen av obligationsköp och vilket fart på globala långräntor. Å andra sidan, med anledning av nedstängningen är oktoberdata svårtolkad, inte minst då statistiska undersökningar inte kunnat utföras enligt normala rutiner. Så det är inte helt självklart att sysselsättning förblir över 200 000 framöver.
Janet Yellen kommer med största sannolikhet att efterträda Fedchefen Ben Bernanke när hans mandatperiod tar slut den 31 januari. Yellen är en stark anhängare av kvantitativa lättnader (obligationsköp) och veckans utfrågning i Senaten var ett kvitto på att Fed lär fortsätta på inslagen linje under hennes ledning. Det bidrog till ökad riskaptit då investerare tolkade det som att en minskning av tillgångsköpen inte ligger runt hörnet ännu.
Utfallet från strategimötet i Kina som påbörjades förra fredagen har ännu inte publicerats. Tillväxtstarka uttalande kommer ge råvaror en fortsatt skjuts uppåt och vi ser speciellt basmetaller som köpvärda.
Basmetaller
Fallande priser för metallerna
Handelsbankens basmetallindex faller drygt 1 % under veckan. Yellens uttalande vid nomineringsutfrågningen i torsdags tolkades som mjuka av marknaden då inga tydliga besked om tapering gavs. Detta skapade visserligen uppgångar men de stora metallerna koppar, aluminium, nickel och zink slutar veckan på minus. Koppar leder nedgången med nästan 3 procent, bland annat till följd av data som visar på fallande investeringar i kraftnätverk i Kina, som är ner 20% y-o-y. Koppar till bland annat kraftledningar står för 40 % av Kinas totala kopparkonsumtion.
LME meddelade förra veckan att de inför kortare leveranstider från börsens lager från och med 1 april 2014. Långa kötider har som bekant pressat upp fysikiska premier (med 100-200 procent över 10 årsnittet). Regleringen innebär förkortning av leveranstiden från 100 till 50 dagar. Trots fallande priser denna vecka tycker vi metallerna ser köpvärda ut. Visar ledarna i Kina på starka tillväxtmål gäller det att vara positionerad för en uppgång.
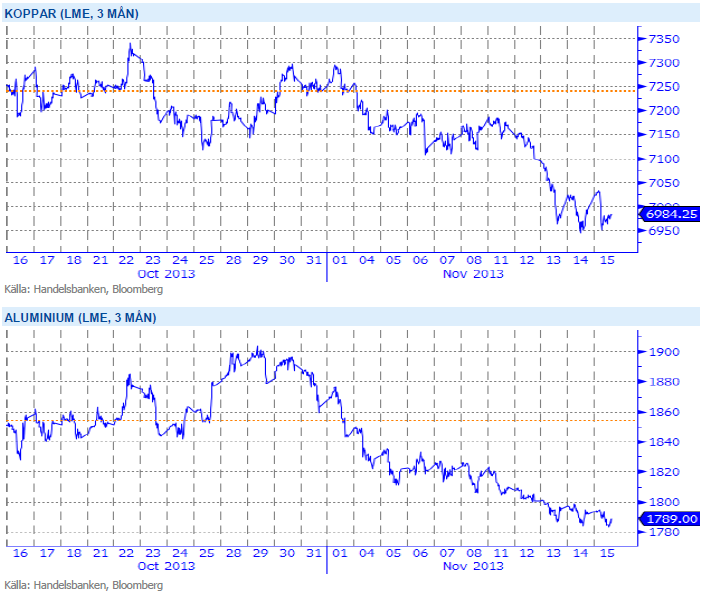
Vi tror att Kinas tillväxt kommer överraska positivt under Q4 och Q1, vilket kommer stärka metallerna. Vi tror på: LONG BASMETALLER
Ädelmetaller
Guldet fortsätter sin väg ned
En ganska händelsefattig vecka för guldet närmar sig sitt slut, och vi bibehåller vår negativa syn på ädelmetallsektorn. Guldet handlar nu 1.5 % lägre än förra veckan, och större delen av prisfallet inträffade vid förra fredagens starka arbetslöshetsstatistik från USA.
Den troliga utnämningen av Janet Yellen som Bernankes efterträdare vid Fed-rodret borde peka mot ytterligare stimulativ penningpolitik i USA (kvantitativa lättnader) och en förskjutning av tapering in i framtiden. Detta ska ställas mot förbättrad amerikansk ekonomisk statistik. Samtidigt ser bilden lite svagare ut i Europa igen efter ECB:s sänkning, och bilden för guldet är alltjämt oklar. Veckan som gått har sett ytterligare små utflöden ur guld-ETF:er, en trend som pågått ända sedan årsskiftet då guldet handlade strax under 1700 USD per uns. Investeringsflödena ger därmed inget stöd för någon teori om att guldets vändning uppåt skulle vara nära i antågande.
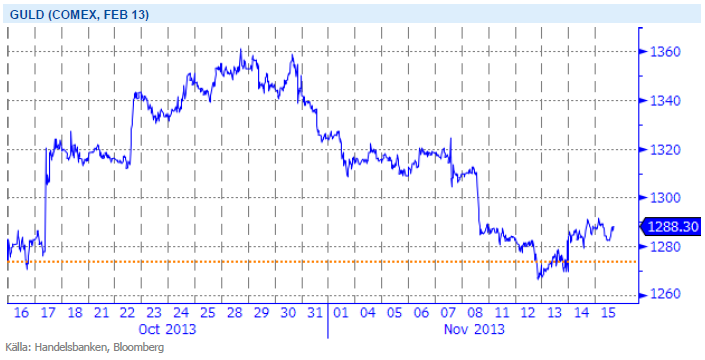
Efter en uppgång under sommaren tror vi åter att guldets väg lutar utför. Vi tror på: SHRT GULD H
Energi
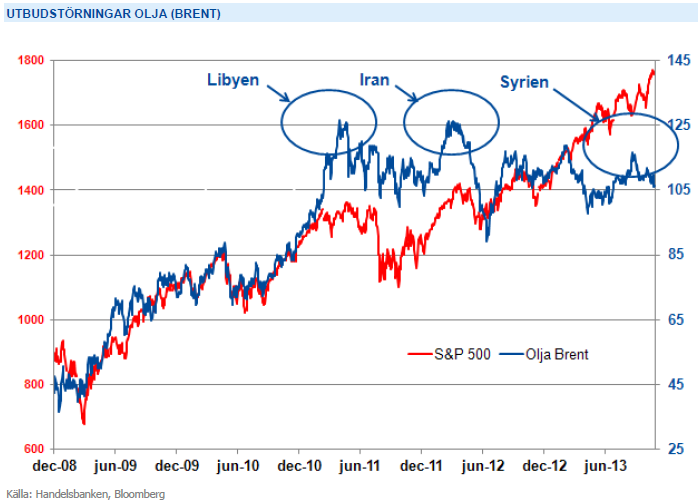
Osäkerhet i Libyen stärker oljan
Oljemarknaden stiger närmare 3 procent under veckan med stöd från amerikansk sysselsättningsstatistik och den politiska oron i Libyen. Även om amerikanska lagersiffror fortsätter stiga mot förväntan tror vi att oljepriset kan komma att stiga något ytterligare, främst med tanke på osäkerheten i Libyens utbud och det ständigt återkommande säkerhetsfrågorna kring Iran vilket motiverar en liten riskpremie även om det fundamentalt ser något bättre än för några veckor sedan. Vi går mot vintertid vilket snabbt kan driva på oron kring en låg reservkapacitet så vi ligger fast med vår syn om att Brentoljan alltid är köpvärd ner mot nivåer om 104-105 dollar med potential på uppsidan.
Elmarknaden fortsätter att stiga med närmare 2 procent denna vecka som ett resultat av en något starkare Tysk marknad och utsikter om mer normalt väder från inledningen av nästa vecka samtidigt som energikolet som väntat finner stöd på dessa låga nivåer. Energibalansen visar på ett underskott om 18 TWh mot normalen och Forsmark 1 har gått halvt ur drift pga av dränageläckage så vår positiva syn på prisutvecklingen kvarstår.
Energiunderskott tillsammans med osäkerhet kring kärnkraftsverken inför vintern talar för högre elpris. Vi tror på: LONG EL
Livsmedel
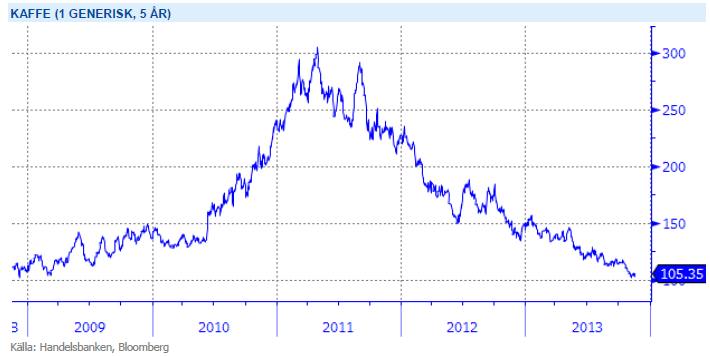
Kaffepriset ned 66% sedan maj 2012
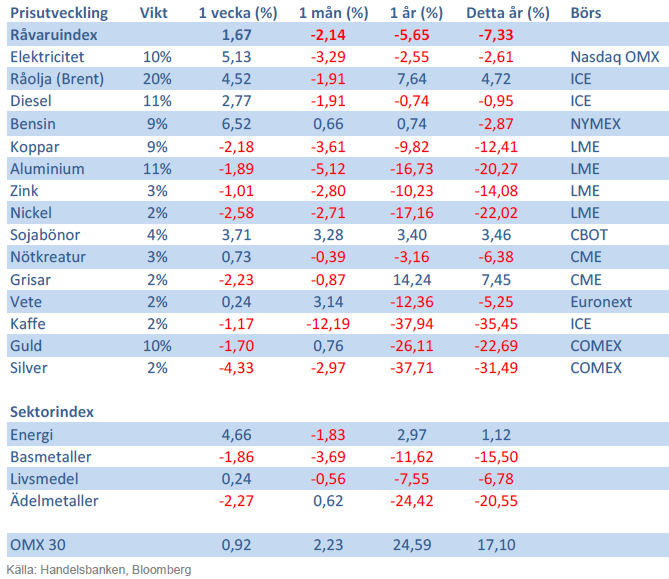
Terminspriset (marskontraktet) på Arabicakaffe i New York bröt genom 1.10 dollar/Ib nivån i slutet av oktober och har inte riktigt orkat ta sig upp igen sen dess. Kaffepriset har fallit 66 procent sedan maj 2011 och handlas idag på samma nivå som mars 2009. Den totala produktionen från de största kaffe-exportörerna för kaffeåret 2012/2013 uppskattas landa på rekordnivåer och likaså den totala exporten.
Det är naturligtvis för tidigt att göra en rättvis uppskattning av världsproduktionen för kaffeåret 2013/2014 och efter nästan tre raka år med fallande priser har vi ännu inte sett ett trendbrott. Men det som bl.a. talar för en uppsida är de låga priserna som kan komma att avskräcka kaffeodlarna från att vilja investera i kaffebönor. Även defekter från bladsvamp i Mexico och Centralamerika, som orsakade ett produktionsbortfall på 2.7 miljoner bags (1 bag=60 kg) 2012/2013, sägs ha en signifikant effekt på kommande skörd. Lägg därtill att världskonsumtionen väntas stiga med 2,4 procent i snitt årligen.
Försening av skörden efter längre perioder av nederbörd i Brasilien samt en stark brasiliansk real driver upp sockerpriset. Vi tror på: BULL SOCKER
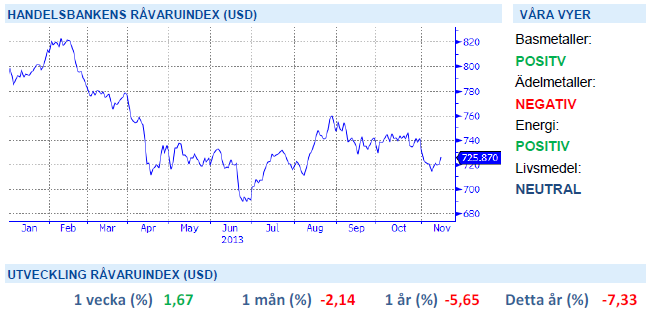
Handelsbankens Råvaruindex
Handelsbankens råvaruindex består av de underliggande indexen för respektive råvara. Vikterna är bestämda till hälften från värdet av nordisk produktion (globala produktionen för sektorindex) och till hälften från likviditeten i terminskontrakten.
[box]SHB Råvarubrevet är producerat av Handelsbanken och publiceras i samarbete och med tillstånd på Råvarumarknaden.se[/box]
Ansvarsbegränsning
Detta material är producerat av Svenska Handelsbanken AB (publ) i fortsättningen kallad Handelsbanken. De som arbetar med innehållet är inte analytiker och materialet är inte oberoende investeringsanalys. Innehållet är uteslutande avsett för kunder i Sverige. Syftet är att ge en allmän information till Handelsbankens kunder och utgör inte ett personligt investeringsråd eller en personlig rekommendation. Informationen ska inte ensamt utgöra underlag för investeringsbeslut. Kunder bör inhämta råd från sina rådgivare och basera sina investeringsbeslut utifrån egen erfarenhet.
Informationen i materialet kan ändras och också avvika från de åsikter som uttrycks i oberoende investeringsanalyser från Handelsbanken. Informationen grundar sig på allmänt tillgänglig information och är hämtad från källor som bedöms som tillförlitliga, men riktigheten kan inte garanteras och informationen kan vara ofullständig eller nedkortad. Ingen del av förslaget får reproduceras eller distribueras till någon annan person utan att Handelsbanken dessförinnan lämnat sitt skriftliga medgivande. Handelsbanken ansvarar inte för att materialet används på ett sätt som strider mot förbudet mot vidarebefordran eller offentliggörs i strid med bankens regler.


Parts of the Brent crude curve dipping into the high $50ies/b. Brent crude fell 2.3% over the week to Friday. It closed the week at $61.29/b, a slight gain on the day, but also traded to a low of $60.14/b that same day and just barely avoided trading into the $50ies/b. This morning it is risk-on in equities which seems to help industrial metals a little higher. But no such luck for oil. It is down 0.8% at $60.8/b. This week looks set for Brent crude to dip its feet in the $50ies/b. The Brent 3mth contract actually traded into the high $50ies/b on Friday.

The front-end backwardation has been on a weakening foot and is now about to fully disappear. The lowest point of the crude oil curve has also moved steadily lower and lower and its discount to the 5yr contract is now $6.8/b. A solid contango. The Brent 3mth contract did actually dip into the $50ies/b intraday on Friday when it traded to a low point of $59.93/b.
More weakness to come as lots of oil at sea comes to ports. Mid-East OPEC countries have boosted exports along with lower post summer consumption and higher production. The result is highly visibly in oil at sea which increased by 17 mb to 1,311 mb over the week to Sunday. Up 185 mb since mid-August. On its way to discharge at a port somewhere over the coming month or two.
Don’t forget that the oil market path ahead is all down to OPEC+. Remember that what is playing out in the oil market now is all by design by OPEC+. The group has decided that the unwind of the voluntary cuts is what it wants to do. In a combination of meeting demand from consumers as well as taking back market share. But we need to remember that how this plays out going forward is all at the mercy of what OPEC+ decides to do. It will halt the unwinding at some point. It will revert to cuts instead of unwind at some point.
A few months with Brent at $55/b and 40-50 US shale oil rigs kicked out may be what is needed. We think OPEC+ needs to see the exit of another 40-50 drilling rigs in the US shale oil patches to set US shale oil production on a path to of a 1 mb/d year on year decline Dec-25 to Dec-26. We are not there yet. But a 2-3 months period with Brent crude averaging $55/b would probably do it.
Oil on water increased 17 mb over the week to Sunday while oil in transit increased by 23 mb. So less oil was standing still. More was moving.

Crude oil floating storage (stationary more than 7 days). Down 11 mb over week to Sunday

The lowest point of the Brent crude oil curve versus the 5yr contract. Weakest so far this year.

Crude oil 1mth to 3mth time-spreads. Dubai held out strongly through summer, but then that center of strength fell apart in late September and has been leading weakness in crude curves lower since then.

Rebounding along with most markets. But concerns over solidity of Gaza peace may also contribute. Brent crude fell 0.8% yesterday to $61.91/b and its lowest close since May this year. This morning it is bouncing up 0.9% to $62.5/b along with a softer USD amid positive sentiment with both equities and industrial metals moving higher. Concerns that the peace in Gaza may be less solid than what one might hope for also yields some support to Brent. Bets on tech stocks are rebounding, defying fears of trade war. Money moving back into markets. Gold continues upwards its strong trend and a softer dollar helps it higher today as well.
US crude & products probably rose 5.6 mb last week (API) versus a normal seasonal decline of 2.4 mb. The US API last night partial and thus indicative data for US oil inventories. Their data indicates that US crude stocks rose 7.4 mb last week, gasoline stocks rose 3.0 mb while Distillate stocks fell 4.8 mb. Altogether an increase in commercial crude and product stocks of 5.6 mb. Commercial US crude and product stocks normally decline by 2.4 mb this time of year. So seasonally adjusted the US inventories rose 8 mb last week according to the indicative numbers by the API. That is a lot. Also, the counter seasonal trend of rising stocks versus normally declining stocks this time of year looks on a solid pace of continuation. If the API is correct then total US crude and product stocks would stand 41 mb higher than one year ago and 6 mb higher than the 2015-19 average. And if we combine this with our knowledge of a sharp increase in production and exports by OPEC(+) and a large increase in oil at sea, then the current trend in US oil inventories looks set to continue. So higher stocks and lower crude oil prices until OPEC(+) switch to cuts. Actual US oil inventory data today at 18:00 CET.
US commercial crude and product stocks rising to 1293 mb in week 41 if last nights indicative numbers from API are correct.

Crude oil soon coming to a port near you. OPEC has lifted production sharply higher this autumn. At the same time demand for oil in the Middle-East has fallen as we have moved out of summer heat and crude oil burn for power for air-conditioning. The Middle-East oil producers have thus been able to lift exports higher on both accounts. Crude oil and condensates on water has shot up by 177 mb since mid-August. This oil is now on its way to ports around the world. And when they arrive, it will likely help to lift stocks onshore higher. That is probably when we will lose the last bit of front-end backwardation the the crude oil curves. That will help to drive the front-month Brent crude oil price down to the $60/b line and revisit the high $50ies/b. Then the eyes will be all back on OPEC+ when they meet in early November and then again in early December.
Crude oil and condensates at sea have moved straight up by 177 mb since mid-August as OPEC(+) has produced more, consumed less and exported more.

When it starts to move lower it moves rather quickly. Gaza, China, IEA. Brent crude is down 2.1% today to $62/b after having traded as high as $66.58/b last Thursday and above $70/b in late September. The sell-off follows the truce/peace in Gaze, a flareup in US-China trade and yet another bearish oil outlook from the IEA.
A lasting peace in Gaze could drive crude oil at sea to onshore stocks. A lasting peace in Gaza would probably calm down the Houthis and thus allow more normal shipments of crude oil to sail through the Suez Canal, the Red Sea and out through the Bab-el-Mandeb Strait. Crude oil at sea has risen from 48 mb in April to now 91 mb versus a pre-Covid normal of about 50-60 mb. The rise to 91 mb is probably the result of crude sailing around Africa to be shot to pieces by the Houthis. If sailings were to normalize through the Suez Canal, then it could free up some 40 mb in transit at sea moving onshore into stocks.
The US-China trade conflict is of course bearish for demand if it continues.
Bearish IEA yet again. Getting closer to 2026. Credibility rises. We expect OPEC to cut end of 2025. The bearish monthly report from the IEA is what it is, but the closer we get to 2026, the more likely the IEA is of being ball-park right in its outlook. In its monthly report today the IEA estimates that the need for crude oil from OPEC in 2026 will be 25.4 mb/d versus production by the group in September of 29.1 mb/d. The group thus needs to do some serious cutting at the end of 2025 if it wants to keep the market balanced and avoid inventories from skyrocketing. Given that IEA is correct that is. We do however expect OPEC to implement cuts to avoid a large increase in inventories in Q1-26. The group will probably revert to cuts either at its early December meeting when they discuss production for January or in early January when they discuss production for February. The oil price will likely head yet lower until the group reverts to cuts.
Dubai: The Mid-East anchor dragging crude oil lower. Surplus emerging in Mid-East pricing. Crude oil prices held surprisingly strong all through the summer. A sign and a key source of that strength came from the strength in the front-end backwardation of the Dubai crude oil curve. It held out strong from mid-June and all until late September with an average 1-3mth time-spread premium of $1.8/b from mid-June to end of September. The 1-3mth time-spreads for Brent and WTI however were in steady deterioration from late June while their flat prices probably were held up by the strength coming from the Persian Gulf. Then in late September the strength in the Dubai curve suddenly collapsed. Since the start of October it has been weaker than both the Brent and the WTI curves. The Dubai 1-3mth time-spread now only stands at $0.25/b. The Middle East is now exporting more as it is producing more and also consuming less following elevated summer crude burn for power (Aircon) etc.
The only bear-element missing is a sudden and solid rise in OECD stocks. The only thing that is missing for the bear-case everyone have been waiting for is a solid, visible rise in OECD stocks in general and US oil stocks specifically. So watch out for US API indications tomorrow and official US oil inventories on Thursday.
No sign of any kind of fire-sale of oil from Saudi Arabia yet. To what we can see, Saudi Arabia is not at all struggling to sell its oil. It only lowered its Official Selling Prices (OSPs) to Asia marginally for November. A surplus market + Saudi determination to sell its oil to the market would normally lead to a sharp lowering of Saudi OSPs to Asia. Not yet at least and not for November.
The 5yr contract close to fixed at $68/b. Of importance with respect to how far down oil can/will go. When the oil market moves into a surplus then the spot price starts to trade in a large discount to the 5yr contract. Typically $10-15/b below the 5yr contract on average in bear-years (2009, 2015, 2016, 2020). But the 5yr contract is usually pulled lower as well thus making this approach a moving target. But the 5yr contract price has now been rock solidly been pegged to $68/b since 2022. And in the 2022 bull-year (Brent spot average $99/b), the 5yr contract only went to $72/b on average. If we assume that the same goes for the downside and that 2026 is a bear-year then the 5yr goes to $64/b while the spot is trading at a $10-15/b discount to that. That would imply an average spot price next year of $49-54/b. But that is if OPEC doesn’t revert to cuts and instead keeps production flowing. We think OPEC(+) will trim/cut production as needed into 2026 to prevent a huge build-up in global oil stocks and a crash in prices. But for now we are still heading lower. Into the $50ies/b.


Australien och USA investerar 8,5 miljarder USD för försörjningskedja av kritiska mineraler
Brent crude set to dip its feet into the high $50ies/b this week

Vad guldets uppgång egentligen betyder för världen

Spotpriset på guld över 4300 USD och silver över 54 USD
Crude oil soon coming to a port near you

OPEC+ missar produktionsmål, stöder oljepriserna

Ett samtal om guld, olja, fjärrvärme och förnybar energi

Goldman Sachs höjer prognosen för guld, tror priset når 4900 USD
Guld nära 4000 USD och silver 50 USD, därför kan de fortsätta stiga

Blykalla och amerikanska Oklo inleder ett samarbete
-
 Nyheter4 veckor sedan
OPEC+ missar produktionsmål, stöder oljepriserna
-
 Nyheter4 veckor sedan
Ett samtal om guld, olja, fjärrvärme och förnybar energi
-
 Nyheter2 veckor sedan
Goldman Sachs höjer prognosen för guld, tror priset når 4900 USD
-
 Nyheter3 veckor sedan
Guld nära 4000 USD och silver 50 USD, därför kan de fortsätta stiga
-
 Nyheter3 veckor sedan
Blykalla och amerikanska Oklo inleder ett samarbete
-
Analys4 veckor sedan
Are Ukraine’s attacks on Russian energy infrastructure working?
-

 Nyheter4 veckor sedan
Guldpriset uppe på nya höjder, nu 3750 USD
-
Nyheter3 veckor sedan
Ett samtal om guld, olja, koppar och stål