

Analys
SHB Råvarubrevet 12 april 2013

 Råvaror allmänt
Tilltagande makro-oro
Efter rädsla för den politiska processen kring Italien och Cypernröran i mars så har plötslig svaghet i både inköpschefsindex i EMU och USA gett motvind för sentimentet och de konjunkturhandlade råvarorna. Medan spridningseffekterna från Cypernstöket har blivit mycket modesta så oroar USA data oss. Amerikanska inköpschefsindex föll oväntat i mars, vilket lett till viss oro för att konjunkturdata kommer att upprepa resan vi sett under 2010-2012, då våren varit en tid med negativa överraskningar. Det oväntat låga sysselsättningsutfallet (payrolls) späder på denna oro. Även fredagens försäljningssiffror överraskade på nedsidan. Det intressanta är att den amerikanska börsen har skakat av sig denna plötsliga makrosvaghet helt och hållet medan räntemarknaden och råvaror har tagit den till sig med hull och hår.
Våra modeller antyder att USA inköpschefsindex bör stiga snarare än falla framöver. En stark börs brukar dessutom leda till förbättrad konsumtionstillväxt och högre investeringsefterfrågan. Finanspolitiken i USA har dock svängt om till åtstramning och kanske är detta vi nu ser i makro efter en oväntat stark inledning på året. Ännu vet vi inte vilken fot vi ska stå på men vi är klart försiktigare än tidigare under året. Kinadata har däremot varit bra under veckan med starkare import, lägre inflation och högre utlåning vilket fick de kinakänsliga basmetallerna att vända uppåt. Importen till Kina av de fyra viktigaste råvarorna, järnmalm, råolja, koppar och sojabönor var alla högre under mars än februari.
Basmetallerna
Kina stärker metallerna, USA tynger
Basmetaller har stigit under veckan och håller sina senaste stödnivåer efter att ökad optimism sprider sig kring utsikterna för ett starkare Q2 i Kina. Stark bankutlåning i mars och arbitragemöjligheter mellan kopparnoteringen på LME och Shanghai har ökat köpintresset hos kinesiska aktörer. Kopparpriset har följaktligen varit uppe och nosat på två veckors högsta under veckan, men föll tillbaka under fredagen och stänger veckan oförändrad.
Övriga metaller fick också se veckans tidigare uppgångar raderade efter sämre än väntade försäljningssiffror från USA. Störst nedgång noterades för tenn som under en timme föll med 3 %.
I tisdags gick 25 000 gruvarbetare i Chilenska koppargruvor ut i en 24 timmars strejk i ett försök att få bättre arbetsvillkor, säkerhetsregler och pensioner.
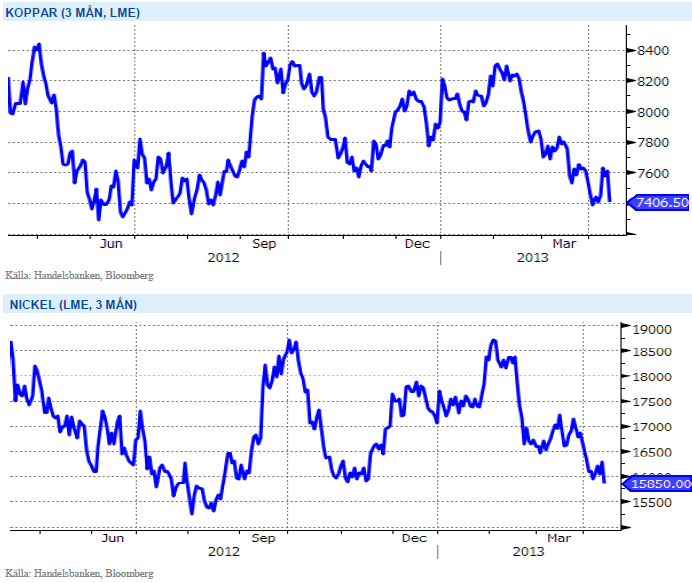
Trots nedgången senaste tiden tror vi på högre priser på basmetaller framöver och ser istället att dagens nivåer som köpvärda. Vi tror på: BASMET H
Ädelmetaller
Uppgång blev till nedgång
Efter att guldet har haft tillfälliga uppgångar drivit av Cypernoron och Japans QE aktion så tror vi åter att resan söderut fortsätter. Silver följer med som guldets spralliga lillebror medan vi behåller en långsiktig tro på högre pris på palladium och platina, givet deras betydelse som industrimetaller exponerade mot asiatisk fordonsindustri som går som tåget.
I förra veckan upprepade vi vår vy på fallande guld och bortsett ifrån en sväng uppe på nästan 1590, fick vi under veckan se resultatet av våra argument. Efter att ha brutit igenom stödnivån på 1550 föll guldet under fredag eftermiddag som lägst under 1500!
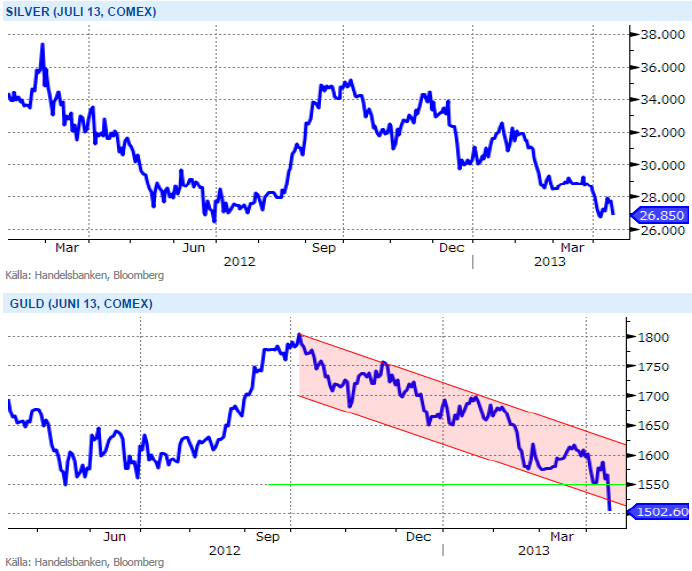
Starkare dollar och högre räntor blir utmanande för guldet samtidigt som inflationen väntas vara låg under året. Vi tror på: GULD S H
Energi
USA data fick oljan på fall
Oljan lyckades återhämta sig något under veckans första dagar för återigen försvagas på oro för Cypern och försäljningssiffror från USA inte motsvarade förväntningarna. Retail sales kom in på niomånaderslägsta vilket fick oljan ner till 101 USD/fat – på en nivå vi inte sett sedan juli 2012. Vi fortsätter tro att oljan har ett starkt stöd omkring 100 USD, såsom varit fallet i snart 2,5 år. Allt svagare makrodata har helt enkelt satt sina spår i makroråvaran nummer ett; oljan.
För elen har de senaste två veckornas rally drivits av den försenade våren och torrare väderlek ser ut att kunna fortsätta. Väderprognoserna som ligger inför nästa vecka visar på ett lågtryck som slår om mot högtryck med kallare och torrare väder. Energibalansen som försvagats ytterligare under veckan skulle därmed kunna försämras till hela -22 TWh vilket ger stöd för prisbilden. I övrigt förväntas nästa vecka handla mycket om EU Parlamentets omröstning nu på tisdag den 16/4 kring en eventuell backloadingplan.
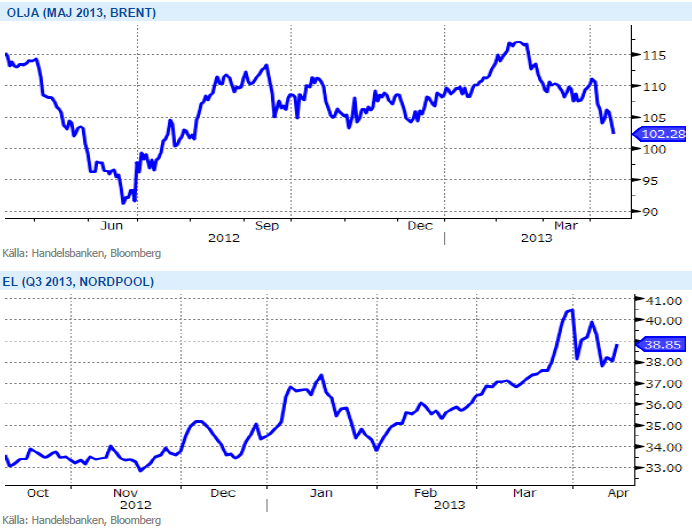
Vi tror att både olja och el är fortsatt köpvärda. Vi tror på : ENERGI H
Livsmedel
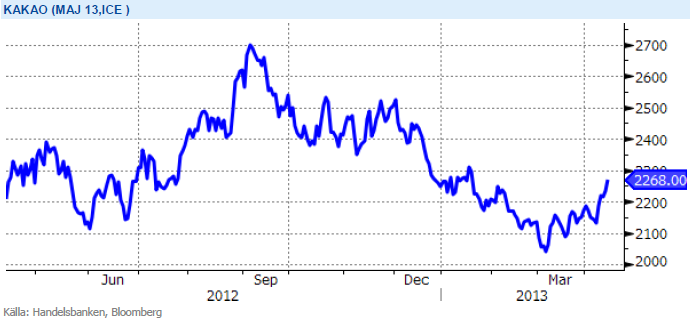
Stigande konsumtion stödjer kakaopriset
Vårt starka case på fallande priser för soja, majs och vete efter den amerikanska torkan har spelat ut efter att priserna har fallit tillbaka till nivåerna före torkan. Om normalt väder infaller i år finns det dock fortfarande en riskpremie i soja majs och vete som kommer prisas ur när dagens låga lagernivåer börjar normaliseras. För europeiskt vete som våra certifikat är kopplade till finns en större nedsida än i det amerikanska vetet då Europa och Ryssland har ett senare odlingsår. Därmed vet vi idag mindre om statusen på årets skörd och en högre riskpremie är därför befogad.
Världsmarknadspriset på kakao nådde årshögsta (2744 dollar/ton) under september förra året. Detta som en följd av uteblivet regn och temperaturer över normalen under odlingssäsongen i regioner kring Elfenbenskusten, världens största kakaoexportör. Det råder därför osäkerhet kring storleken och kvalitén på årets skörd och priskurvan har varit uppåtgående sen i början av mars. Under de senaste två åren har priset fallit ca 20 procent som en följd av goda väderförhållanden och höga skördar som har varit huvudorsaken till överskott på kakao. Men de låga kakaopriserna har lett till att fler och fler kakaoodlare överväger att odla andra tropiska råvaror samtidigt som kakaokonsumtionen utanför Europa och Nordamerika ökar. Med risk för minskad produktion och i takt med stigande konsumtion i tillväxtländerna tror vi på fortsatt uppgång av priset.
Då priserna har på de stora jordbruksråvarorna soja, majs och vete har fallit tillbaka till nivåer före torkan i USA, tror vi att en nedsida är begränsad på kort sikt och därför är vi neutrala till utvecklingen för denna sektor.
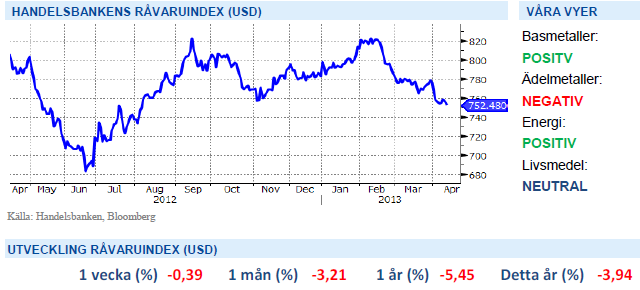
Handelsbankens Råvaruindex
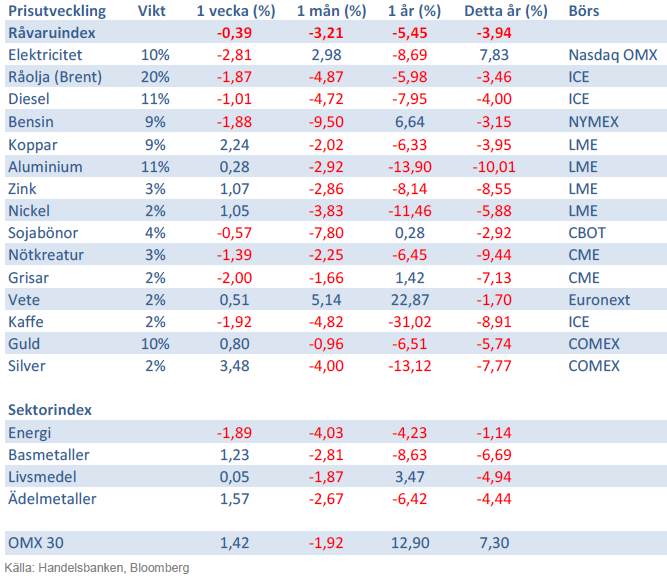
Handelsbankens råvaruindex består av de underliggande indexen för respektive råvara. Vikterna är bestämda till hälften från värdet av nordisk produktion (globala produktionen för sektorindex) och till hälften från likviditeten i terminskontrakten.
[box]SHB Råvarubrevet är producerat av Handelsbanken och publiceras i samarbete och med tillstånd på Råvarumarknaden.se[/box]
Ansvarsbegränsning
Detta material är producerat av Svenska Handelsbanken AB (publ) i fortsättningen kallad Handelsbanken. De som arbetar med innehållet är inte analytiker och materialet är inte oberoende investeringsanalys. Innehållet är uteslutande avsett för kunder i Sverige. Syftet är att ge en allmän information till Handelsbankens kunder och utgör inte ett personligt investeringsråd eller en personlig rekommendation. Informationen ska inte ensamt utgöra underlag för investeringsbeslut. Kunder bör inhämta råd från sina rådgivare och basera sina investeringsbeslut utifrån egen erfarenhet.
Informationen i materialet kan ändras och också avvika från de åsikter som uttrycks i oberoende investeringsanalyser från Handelsbanken. Informationen grundar sig på allmänt tillgänglig information och är hämtad från källor som bedöms som tillförlitliga, men riktigheten kan inte garanteras och informationen kan vara ofullständig eller nedkortad. Ingen del av förslaget får reproduceras eller distribueras till någon annan person utan att Handelsbanken dessförinnan lämnat sitt skriftliga medgivande. Handelsbanken ansvarar inte för att materialet används på ett sätt som strider mot förbudet mot vidarebefordran eller offentliggörs i strid med bankens regler.


Selling down on a ”deal”. Brent crude fell 6.2% last week with accelerated weakness towards the end of the week. Close of the week at $87.33/b and low of the week (and on Friday) of $85.8/b. Brent is falling another 4% this morning to $83.7/b on confirmation by Iran that a MoU text has been reached and that it will be signed on Friday this week.

So what is this ”deal” worth? Talk on the desk here this morning is that it is much like ”putting lipstick on a pig” where Trump has to sell this at home as a victory where ”the SoH has reopened”, the nuclear issue will be ironed out over the coming 60 days (or maybe 600 days?) and US consumers are getting a lower gasoline price and maybe US republicans survives the midterm elections.
The importance for Iran is that it emerges as the defacto winner of this war in the eyes of the non-US public world. That Iran now onwards is the ”ruler of the SoH” (combo of geography and new weapons systems like drones) or more softer: ”the guarantor of safe passage through the SoH”.
Iran doesn’t need nuclear weapons any more. Nuclear deterrence doesn’t work any more. Ukraine has made many attacks deep into Russia without being nuked in return. Plenty of Iranian ballistic rockets blasts over Israel but Iran wasn’t nuked in return.
There is no trust between the US and Iran. We don’t know all the details yet of the MoU. But what we do know is that there is no trust between the US and Iran what so ever. This is probably more like a descriptive text on how they can cooperate in a way where both sides keeps tactical leverage. Neither side makes irreversible concessions. Violations can be punished quickly. Cooperation produces immediate benefits.
This is a fragile structure. It can easily break down. There may be details which cannot be overcome. To be seen on Friday. The US has to show that it is willing put enough force behind managing and restraining Israel versus Hezbollah in Lebanon. We have seen that Netanyahu hasn’t listened all that much to Trump’s directives and wishes. This could be a major obstacle.
A gradual reopening is tactically preferable for Iran. A tactical leverage for Iran right now is that global oil stocks have been drawn down towards painful and increasingly dangerous levels with increasing risks for oil price spikes in mid-July to August. This together with US midterm elections on 3 November gives tactical leverage to Iran. Iran probably doesn’t want to fully give up on that leverage. A rapid, full reopening where global stocks are able to refill over the coming 60 days will significantly erode that leverage. If Iran reinstates a closure of the SoH after 60 days (if talks break down again), then the effect won’t be that impactful in terms of prices and the US midterm elections.
So a gradual and partial reopening where global markets gets the oil they need while they are unable to rebuild stocks could be a practical middle way for both parties. Trump can sell it as ”the SoH has reopened” and get affordable gasoline for US consumers. Iran can sell it as ”the SoH has fully reopened, but there is some friction” so flow is only 60-80% of normal.
Not much real demand destruction below $100/b. What we do know is that there is not much real price pain demand destruction for oil globally at an oil price below $100/b. A lot of demand-shock destruction. Fear. But demand should now come roaring back towards normal with fear for exceptionally high prices now is rapidly receding.
Sudden China demand destruction due to EVs? Bullocks. EV share of total Chinese carpool now around 13%. Share of new sales of EVs has reached 50%. This is a very gradual process. It doesn’t make oil demand fall like a rock over night. When EV new sales share reaches 100%, then the gasoline car pool will contract by some 5-10% per year. But that is only gasoline. Sudden reduction in Chinese oil demand is more about shock and risk.
Chinese crude oil imports will come roaring back. At what price? Today’s ”neutral” oil price is $70/b. That is the five year price which has steadily traded around the $70/b mark over the past 3-4 years. With still a risky picture one would think that China and the rest of the world will be big buyers of oil in the range of $70-85/b.
Global demand will likely snap back towards normal, forecasted demand and growth at such prices.
Physical reopening is a gradual process. The physical and practical reopening of the SoH will likely be gradual rather than sudden. And that probably suites Iran tactically as well.
Brent M1 price versus the Brent 5-yr (today’s ”normal” price)

Market is starting to take US/Iran headlines with a pinch of salt. Brent crude rose $2.8/b yesterday to an official close of $112.1/b. But after that it traded as low as $108.05/b before ending late night at around $109.7/b. Through the day it traded in a range of $106.87 – 112.72/b amid a flurry of news or rumors from Iran and the US. ”US temporary sanctions during negotiations” (falls alarm). ”We will bomb Iran” (not anyhow),… etc. While the market is still fluctuating to this kind of news flow, it is starting to take such headlines with a pinch of salt.
We’ll see. Maybe, maybe not. The Brent M1 contract is trading at $110.2/b this morning which very close to the average ticks through yesterday of $110.4/b.
Trump with bearish, verbal intervention whenever Brent trades above $110/b it seems. What seems to be a pattern is that Trump states something like ”very good negotiations going on with Iran”, ”New leaders in Iran are great,..”, ”Great progress in negotiations,…”, ”Deal in sight,..” etc whenever the Brent M1 contract trades above $110/b. An effort to cool the market. These hot air verbal interventions from Trump used to have a heavy bearish impact on prices, but they now seems to have less and less effect unless they are backed by reality.
As far as we can see there has been no real progress in the negotiations between the US and Iran with both sides still standing by their previous demands.
Iran is getting stronger while the cease fire lasts making a return to war for Trump yet harder. Iran is naturally in constant preparation for a return to war given Trump’s steady threats of bombing Iran again. Iran is naturally doing what ever is possible to prepare for a return to war. And every day the cease fire lasts it is better prepared. This naturally makes it more and more difficult and dangerous for the US to return to warring activity versus Iran as the consequences for energy infrastructure in the Persian Gulf will be more and more severe the longer the cease fire lasts. Israel seems to see it this way as well. That the war is not won and that current frozen state of a cease fire gives Iran opportunity to rebuild military and politically.
Global inventories are drawing down day by day. How much? In the meantime the Strait of Hormuz stays closed. There is varying measures and estimates of how much global inventories are drawing down. Our rough estimate, back of the envelope, is that global inventories are drawing down by at least some 10 mb/d or about 300 mb/d in a balance between loss of supply versus demand destruction. Other estimates we see are a monthly draw of 250-270 mb/d. The IEA only ’measured’ a draw in global observable stocks of 117 mb in April with oil on water rising 53 mb while on shore stocks fell 170 mb. But global stocks are hard to measure with large invisible, unmeasured stocks. As such a back of the envelope approach may be better.
Oil products is what the world is consuming. Oil product prices likely to rise while product stocks fall. Strategic Petroleum Reserves (SPR) are predominantly crude oil. Discharging oil from OECD SPR stocks, a sharp reduction in Chinese crude imports and a reduction in global refinery throughput of 6-7 mb/d has helped to keep crude oil markets satisfactorily supplied. But global inventories are drawing down none the less. And oil products is really what the world is consuming. So if global refinery throughput stays subdued, then demand will eventually have to match the supply of oil products. The likely path forward this summer is a steady draw down in jet fuel, diesel and gasoline. Higher prices for these. Then, if possible, higher refinery throughput and higher usage of crude in response to very profitable refinery margins. And lastly sharper draw in crude stocks and higher prices for these. But some 6 mb/d of oil products used to be exported through the Strait of Hormuz. And it may not be so easy to ramp up refinery activity across the world to compensate. Especially as Ukraine continues to damage Russian refineries as well as Russian crude production and export facilities.
Watch oil product stocks and prices as well as Brent calendar 2027. What to watch for this summer is thus oil product inventories falling and oil product premiums to crude rising. Another measure to watch is the Brent crude 2027 contract as it rises steadily day by day as the Strait of Hormuz stays closed and global oil inventories decline. The latter is close to the highest level since the start of the war and keeps rising.
The Brent M1 contract and the Brent 2027 prices and current price of jet fuel in Europe (ARA). All in USD/b

Our back of the envelope calculation of the global shortage created by the closure of the Strait of Hormuz. Note that 3.5 mb/d of discharge from SPR is also a draw. Note also that ’Forced demand loss’ of 2.5 mb/d is probably temporary and will fall back towards zero as logistics are sorted out leaving ’Price demand loss’ to do the job of balancing the market. Thus a shortfall of at least 9 mb/d created by the closure. More if SPR discharge is included and more if Forced demand loss recedes.

Brent is climbing higher. Front-month is at USD 106.3/bl this morning, close to a weekly high and a USD 9/bl jump from Mondays open. This is the move we flagged as a risk earlier in the week: the market shifting from ”a deal is around the corner” to ”this is going to take longer than we thought”.

Analyst Commodities, SEB
During April, rest-of-year Brent remained remarkably stable around USD 90/bl. A stability which rested on one single assumption: the SoH reopens around 1 May. That assumption is now slowly falling apart.
As we highlighted yesterday: every week of delay beyond 1 May adds (theoretically) ish USD 5/bl to the rest-of-year average, as global inventories draw 100 million barrels per week. i.e., a mid-May reopening implies rest-of-year Brent closer to USD 100/bl, and anything pushing into June or July takes us meaningfully higher.
What’s changed in the last 48 hours:
#1: The US military has formally warned that clearing suspected sea mines from SoH could take up to six months. That is a completely different timescale from what the financial market is pricing. Even a political deal tomorrow does not immediately reopen the strait.
#2: Trump has shifted his tone from urgency to ”strategic patience”. In yesterday’s press conference: ”Don’t rush me… I want a great deal.” The market is reading this as a president no longer feeling pressured by timelines, with the naval blockade running in the background.
#3: So far, the military activity is escalating, not de-escalating. Axios reports Iran is laying more mines in SoH. The US 3rd carrier strike group (USS George H.W. Bush) is arriving with two countermine vessels. Trump yesterday ordered the US Navy to destroy any Iranian boats caught laying mines. While CNN reports that the Pentagon is actively drawing up plans to strike Iranian SoH capabilities and individual Iranian military leaders if the ceasefire collapses. i.e., NOT a attitude consistent with an imminent deal!
Spot crude and product prices eased off the early-April highs on a combination of system rerouting and deal optimism. Both now weakening. Goldman estimates April Gulf output is reduced by 14.5 mbl/d, or 57% of pre-war supply, a number that keeps getting worse the longer this drags on.
Demand-side adaptation is ongoing: S. Korea has cut its Middle East crude dependence from 69% to 56% by pulling more from the Americas and Africa, and Japan is kicking off a second round of SPR releases from 1 May. But SPRs are finite.
Ref. to the negotiations, we should not bet on speed. The current Iranian leadership is dominated by genuine hardliners willing to absorb economic pain and run the clock to extract concessions. That is not a setup for a rapid resolution. US/Israeli media briefings keep framing the delay as ”internal Iranian divisions”, the reality is more complicated and points toward weeks and months, not days.
Our point is that the complexity is large, and higher prices have only just started (given a scenario where the negotiations drag out in time). The market spent April leaning on the USD 90/bl rest-of-year assumption; that case is diminishing by the hour. If ”early May reopening” is replaced by ”June, July or later” over the next week or two, both crude and products have meaningful room to reprice higher from here. There is a high risk being short energy and betting on any immediate political resolution(!).


Vattenfalls och Industrikrafts kärnkraftsbolag Videberg Kraft har valt Rolls-Royce SMR
Selling down on a ”deal”

Sommarväder skapar prisrally på elbörsen
Oil product price pain is set to rise as the Strait of Hormuz stays closed into summer

