

Analys
Råvaruplanket: Med stöd från Kina och OPEC

![]() OPEC byter strategi
OPEC byter strategi
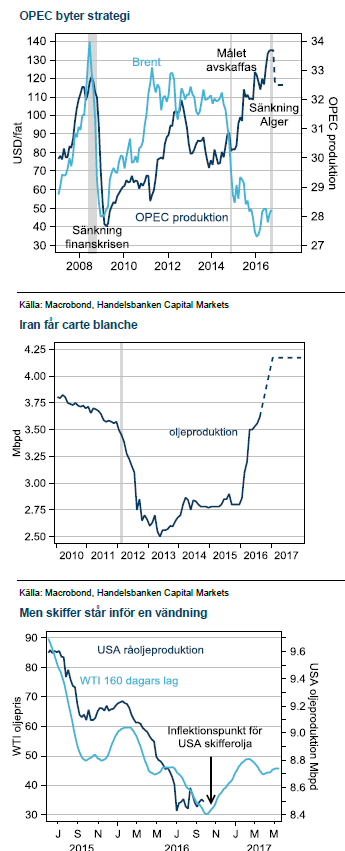
Inte sedan brinnande finanskris 2008 har OPEC enats om att sänka produktionen av råolja. Överraskningen efter beslutet att byta två års medvetet låga priser till ett försöka att minska produktionen vid det extra mötet i Alger i slutet av september var total.
 Något höll på att hända givet Saudiarabiens förändrade retorik inför mötet. Landet har hamnat allt mer i kläm efter två års budgetunderskott. Maktkampen med Iran har spelat ut i Irans favör och Saudiarabien valde till slut att göra en kovändning. Nu ska mycket bevisas, historiskt har alltid implementering varit svårare än beslut för OPEC, men vi tror diskussionerna räcker för att ge oljan stöd med omkring USD 10 och höjer vår tro från USD 40 till USD 50 vid slutet av året.
Kinas ”minicykel” börjar bli en ”mediumcykel”
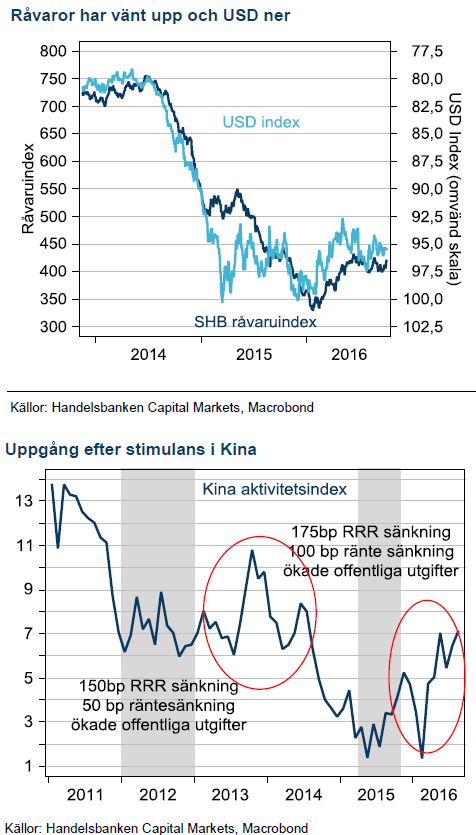
Basmetallerna som grupp har nu stigit tre kvartal på raken. Det har inte hänt sedan återhämtningen efter finanskrisen i slutet av 2010 till början av 2011. Kinas återhämtning det här året kommer från riktade stimulanser mot fastighetsmarknaden och infrastruktur under 2015. En gammal väl beprövad metod som konsumerar mycket industriella metaller. Vi trodde tidigare att cykeln skulle börja mattas i slutet av året men data fortsätter komma in på bra nivåer och vi tror därför på fortsatt stigande priser för basmetaller.
Slår Fed till i december?
Senaste vågen av bankrelaterad finansiell tumult i Europa med Deutsche Bank i centrum har inte väckt investerares behov av säker hamn i guld på samma sätt som tidigare. Sedan ett kraftigt kliv upp efter Brexit-valet har guld hamnat under svag press. Vi tror att marknadens förväntningar om en höjning från Fed i december skapar en tillfällig ovilja till guld. Efter en höjning ser vi nya möjligheter för guld och silver men utgångsläget är sämre i år då endast en räntehöjning är annonserad för 2017.
Vår syn för Q4 16 och Q1 2017:
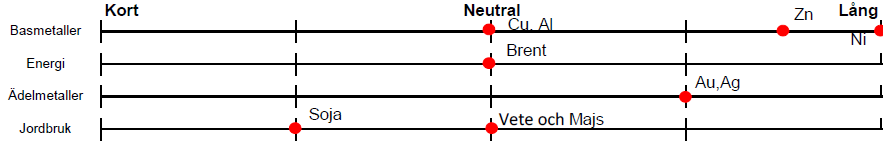
Basmetaller
 Efterfrågan ger stöd
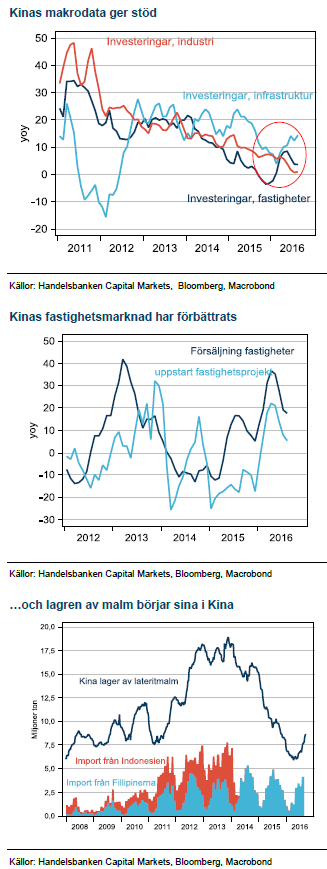
För första gången på två år har tunga industriråvaror som basmetaller, järnmalm och stål fått draghjälp från efterfrågesidan i prisekvationen. Kinas investeringsvåg i infrastruktur och fastigheter har triggat efterfrågan som får marknaden att minnas ”supercykeln”. I längden är den dock inte hållbar då den underliggande tillväxten trendar nedåt och det är staten som står bakom investeringarna. Frågan är hur länge vågen varar?
Räntor var första indikatorn på att politiken höll på att svänga till ultrastimulativ. Tillsammans med lägre krav på bostadsköpare fick det fart på försäljningen av fastigheter och så småning om också byggandet. Därefter kom statliga investeringar i infrastruktur. Dessa efterfrågar industriråvaror på bred front.
Vissa indikatorer tyder på att stimulanserna är på väg att rulla ut. Fastighetsdata är bästa exemplet på det. Politikerna vill inte ha för stora prisuppgångar och har därför åter börjat kyla ner den delen av ekonomin. Infrastruktur och inte minst senaste inköpschefsindex tyder på att aktiviteten kommer att bestå ytterligare en tid. Vi förlänger därför vår tro på positiva stimulanseffekter även under Q1.
Zink och nickel står starkt
Vår tro på högre zink och nickelpriser har besannats, och av rätt skäl. Brist i marknadsbalansen efter stängda gruvor för zink, då flera stora är utbrutna och för nickel, efter miljöutvärderingen på Filippinerna. Störst effekt i marknaden räknar vi med först under 2017 när höga lagernivåer betats av. Vi fortsätter därför att tro på stigande priser trots uppgångar på knappa 50% för zink och 20% för nickel det här året.
Stigande kopparproduktion hämmar
De divergerande förutsättningarna för basmetaller på utbudssidan spelar fortfarande in, trots Kinas starkare efterfrågan under året. Koppar handlas i princip oförändrad i år, trots Kinaeffekterna. Högre produktion från nya gruvor är förklaringen. Vi sätter därför en speciell varningsflagga för koppar på nedsidan när Kinas stimulanser rullar ut ur systemet.
Aluminium har stigit i bakvattnet av högre produktionskostnad när kol- och oljepriserna gått upp. Marknadsbalansen är dock välförsörjd.
Energi
 Saudiarabien blev desperat
OPEC:s informella möte i Alger slutade med en skräll när man meddelade att man var överrens om att skära ner på produktionen. Saudiarabien har varit prisnedgångens största påivrare av en fri marknaden som ska rebalansera sig själv när högkostnadsproducenter tvingas lägga ner produktionen. Strategin har visat sig fungera dåligt, högkostnadsproducenterna sänker sina produktionskostnader i takt med att priset faller och marknaden står idag, två år senare, kvar med ett stort överskott långt in i 2017.
Press från alla håll
Saudiarabien är det land som har svårast att skära ner på utgifterna. Rädslan för Arabiska vårens uppror är påtaglig och att finansiera budgetunderskottet med högre skuldsättning kommer att bli allt svårare när utsikterna för oljepriset att återhämta sig falnar. Landet sitter fast i ett högt oljeberoende och prins Mohammed Bin Salmans ambitiösa planer på att diversifiera ekonomin, bland annat genom att sälja delar av det statliga oljebolaget, Aramco har kommit i skymundan av prinsens problem med kriget mot Iran i Jemen. Det finns ingen strategi för Saudi att komma ur Jemen. Prinsen är även försvarsminister och hans stjärna har därför dalat.
Det bästa beviset på Saudiernas desperation är att de låter Iran undantas från avtalet. Iran kan fortsätta att öka sin produktion och samtidigt åtnjuta ett högre pris från övrigas neddragningar. Även Nigeria och Libyen ska exkluderas efter rådande utbudsstörningar enligt avsiktsförklaringen.
Mycket kvar till nytt jämviktspris
Nu ska OPEC först komma överrens om landskvoter. Därefter ska Ryssland förhandla om att delta. Vi tror att dessa diskussioner fram till nästa möte 30/11 i Wien kommer att ge stöd till oljepriset.
För 2017 är det mycket som ska bevisas. Historiskt har OPEC haft mycket svårt att solidariskt dela på minskad produktion. Den här gången lär dessutom Saudi vara extremt krävande. Samtidigt hotar ökad aktivitet i skifferindustrin. Därifrån ser vi ny press på oljan under kommande sex månader.
Ädelmetaller
 Feds huvudvärk är guldets gnista
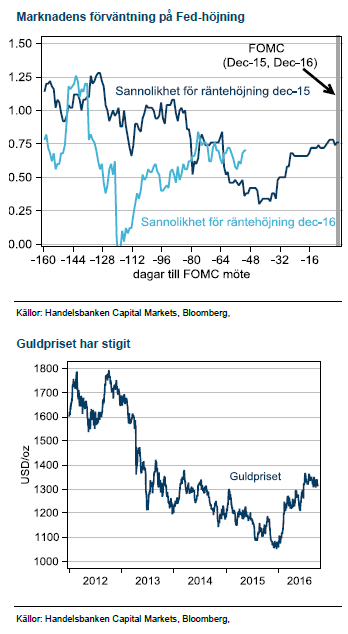
Efter en initial press på guld, sedan Fed startat sin räntehöjningscykel i december 2015, så fick guldet massor av drivkraft från att Fed och marknaden reviderade ner antalet räntehöjningar. Nu återstår bara en chans, vid decembermötet, om man antar att de vill ha en presskonferens i anslutning till mötet för att prata om sin höjning.
Vi tror att det blir en höjning i december. Det gör marknaden också som just nu prissätter omkring 60% sannolikhet för en höjning. Det gör sannolikt guld och silver något mindre attraktiva inför decembermötet, och förklarar guldets svaga utveckling de senaste veckorna, trots drivkraft från ökat tumult i Europa.
Ingen repris nästa år
För 2017 ser vi inte en enkel repris av 2016. För ett år sedan trodde marknaden på fler höjningar under 2016 och det signalerade även Fed. Det kom ju sedan på skam och guldet glänste. Den här gången har Fed bara en höjning under 2017 och marknaden har bara 80% sannolikhet för en höjning fram till slutet av 2017. Det betyder att det inte finns mycket utrymme för att revidera ner förväntansbilden på antalet höjningar från Fed.
Brexit bakom oss och framför oss
Storbritanniens önskan om att lämna EU blev en gnista för guld som säker hamn. Riskerna för spridning till andra länder, med kommande val i flera EU-länder, är den största risken i dag som skulle kunna trigga ett ökat intresse för guld. Storbritanniens del av Brexit ligger sannolikt bakom oss för guldets del. Nu väntar segdragna förhandlingar och guldet brukar snarare reagera på oväntade chocker än eventuellt försämrade utsikter för BNP tillväxt.
Jordbruk
 Sedvanlig skördeeffekt för vetepriserna
Vete i Paris har fallit tillbaka ned mot årets lägsta nivåer efter en uppgång i början av juli. Regn och översvämningar med efterföljande kvalitetsproblem i Europa och Ryssland låg bakom mycket av den tidigare uppgången.
När skörden runt om i världen nu i det närmaste är klar har den sedvanliga riskpremien fallit ur priserna. Veteskörden globalt blev volymmässigt bra och lokalt sämre skörd i Europa kompenseras av större skördar runt Svarta havet, USA och Australien. Globala vetelager går mot fjärde året i rad med stigande nivåer vilket pressat priserna, samt delvis skapat en buffert för eventuella problem framöver. Bland de stora exportörerna, med stor påverkan på världsmarknadspriset, är det främst USA vars lager nått väldigt höga nivåer – detta som följd av inte minst en stärkt dollar med försvårade exportmöjligheter. Lager hos flera övriga stora exportörer, däribland EU och Kanada har dock minskat och globala lager exklusive Kina (vilka för vete ej är så aktiva på export/ import) är faktiskt ned något från föregående säsong.
Om nästa års skörd ökar på nuvarande lager finns det fortfarande viss nedsida i vetepriser, låga priser är alltså ingen garanti för att undvika ännu lägre priser. Vi är dock i tron om att vetepriser nått eller åtminstone är väldigt nära en botten nu. Det är alltså främst i USA som lagernivån är riktigt hög och med rådande låga priser väntas de amerikanska lantbrukarna även i år minska vetearealen till förmån för andra grödor. Det begränsar möjligheten för fortsatt lageruppbyggnad i USA vilket i kombination med mer måttliga lager för flera övriga exportländer och kvalitetsproblem bör ge ett stöd åt vetepriser framgent.
Soja och majs
Majs- och sojaskörden i USA pågår för fullt, i söndags var majsskörden till 24 procent klar och sojaskörden till 26 procent klar – marginellt efter det normala. Avkastningsnivån är hög, förväntningar finns dock att USDA kommer få justera ned prognosen för majsen något, vilket ger visst stöd åt majspriset som handlas kring historiskt sett låga nivåer. Det råder ingen brist i världen på vare sig majs eller soja.
[box]SHB Råvarukommentar är producerat av Handelsbanken och publiceras i samarbete och med tillstånd på Råvarumarknaden.se[/box]
Ansvarsbegränsning
Detta material är producerat av Svenska Handelsbanken AB (publ) i fortsättningen kallad Handelsbanken. De som arbetar med innehållet är inte analytiker och materialet är inte oberoende investeringsanalys. Innehållet är uteslutande avsett för kunder i Sverige. Syftet är att ge en allmän information till Handelsbankens kunder och utgör inte ett personligt investeringsråd eller en personlig rekommendation. Informationen ska inte ensamt utgöra underlag för investeringsbeslut. Kunder bör inhämta råd från sina rådgivare och basera sina investeringsbeslut utifrån egen erfarenhet.
Informationen i materialet kan ändras och också avvika från de åsikter som uttrycks i oberoende investeringsanalyser från Handelsbanken. Informationen grundar sig på allmänt tillgänglig information och är hämtad från källor som bedöms som tillförlitliga, men riktigheten kan inte garanteras och informationen kan vara ofullständig eller nedkortad. Ingen del av förslaget får reproduceras eller distribueras till någon annan person utan att Handelsbanken dessförinnan lämnat sitt skriftliga medgivande. Handelsbanken ansvarar inte för att materialet används på ett sätt som strider mot förbudet mot vidarebefordran eller offentliggörs i strid med bankens regler.


Market is starting to take US/Iran headlines with a pinch of salt. Brent crude rose $2.8/b yesterday to an official close of $112.1/b. But after that it traded as low as $108.05/b before ending late night at around $109.7/b. Through the day it traded in a range of $106.87 – 112.72/b amid a flurry of news or rumors from Iran and the US. ”US temporary sanctions during negotiations” (falls alarm). ”We will bomb Iran” (not anyhow),… etc. While the market is still fluctuating to this kind of news flow, it is starting to take such headlines with a pinch of salt.

We’ll see. Maybe, maybe not. The Brent M1 contract is trading at $110.2/b this morning which very close to the average ticks through yesterday of $110.4/b.
Trump with bearish, verbal intervention whenever Brent trades above $110/b it seems. What seems to be a pattern is that Trump states something like ”very good negotiations going on with Iran”, ”New leaders in Iran are great,..”, ”Great progress in negotiations,…”, ”Deal in sight,..” etc whenever the Brent M1 contract trades above $110/b. An effort to cool the market. These hot air verbal interventions from Trump used to have a heavy bearish impact on prices, but they now seems to have less and less effect unless they are backed by reality.
As far as we can see there has been no real progress in the negotiations between the US and Iran with both sides still standing by their previous demands.
Iran is getting stronger while the cease fire lasts making a return to war for Trump yet harder. Iran is naturally in constant preparation for a return to war given Trump’s steady threats of bombing Iran again. Iran is naturally doing what ever is possible to prepare for a return to war. And every day the cease fire lasts it is better prepared. This naturally makes it more and more difficult and dangerous for the US to return to warring activity versus Iran as the consequences for energy infrastructure in the Persian Gulf will be more and more severe the longer the cease fire lasts. Israel seems to see it this way as well. That the war is not won and that current frozen state of a cease fire gives Iran opportunity to rebuild military and politically.
Global inventories are drawing down day by day. How much? In the meantime the Strait of Hormuz stays closed. There is varying measures and estimates of how much global inventories are drawing down. Our rough estimate, back of the envelope, is that global inventories are drawing down by at least some 10 mb/d or about 300 mb/d in a balance between loss of supply versus demand destruction. Other estimates we see are a monthly draw of 250-270 mb/d. The IEA only ’measured’ a draw in global observable stocks of 117 mb in April with oil on water rising 53 mb while on shore stocks fell 170 mb. But global stocks are hard to measure with large invisible, unmeasured stocks. As such a back of the envelope approach may be better.
Oil products is what the world is consuming. Oil product prices likely to rise while product stocks fall. Strategic Petroleum Reserves (SPR) are predominantly crude oil. Discharging oil from OECD SPR stocks, a sharp reduction in Chinese crude imports and a reduction in global refinery throughput of 6-7 mb/d has helped to keep crude oil markets satisfactorily supplied. But global inventories are drawing down none the less. And oil products is really what the world is consuming. So if global refinery throughput stays subdued, then demand will eventually have to match the supply of oil products. The likely path forward this summer is a steady draw down in jet fuel, diesel and gasoline. Higher prices for these. Then, if possible, higher refinery throughput and higher usage of crude in response to very profitable refinery margins. And lastly sharper draw in crude stocks and higher prices for these. But some 6 mb/d of oil products used to be exported through the Strait of Hormuz. And it may not be so easy to ramp up refinery activity across the world to compensate. Especially as Ukraine continues to damage Russian refineries as well as Russian crude production and export facilities.
Watch oil product stocks and prices as well as Brent calendar 2027. What to watch for this summer is thus oil product inventories falling and oil product premiums to crude rising. Another measure to watch is the Brent crude 2027 contract as it rises steadily day by day as the Strait of Hormuz stays closed and global oil inventories decline. The latter is close to the highest level since the start of the war and keeps rising.
The Brent M1 contract and the Brent 2027 prices and current price of jet fuel in Europe (ARA). All in USD/b

Our back of the envelope calculation of the global shortage created by the closure of the Strait of Hormuz. Note that 3.5 mb/d of discharge from SPR is also a draw. Note also that ’Forced demand loss’ of 2.5 mb/d is probably temporary and will fall back towards zero as logistics are sorted out leaving ’Price demand loss’ to do the job of balancing the market. Thus a shortfall of at least 9 mb/d created by the closure. More if SPR discharge is included and more if Forced demand loss recedes.

Brent is climbing higher. Front-month is at USD 106.3/bl this morning, close to a weekly high and a USD 9/bl jump from Mondays open. This is the move we flagged as a risk earlier in the week: the market shifting from ”a deal is around the corner” to ”this is going to take longer than we thought”.

Analyst Commodities, SEB
During April, rest-of-year Brent remained remarkably stable around USD 90/bl. A stability which rested on one single assumption: the SoH reopens around 1 May. That assumption is now slowly falling apart.
As we highlighted yesterday: every week of delay beyond 1 May adds (theoretically) ish USD 5/bl to the rest-of-year average, as global inventories draw 100 million barrels per week. i.e., a mid-May reopening implies rest-of-year Brent closer to USD 100/bl, and anything pushing into June or July takes us meaningfully higher.
What’s changed in the last 48 hours:
#1: The US military has formally warned that clearing suspected sea mines from SoH could take up to six months. That is a completely different timescale from what the financial market is pricing. Even a political deal tomorrow does not immediately reopen the strait.
#2: Trump has shifted his tone from urgency to ”strategic patience”. In yesterday’s press conference: ”Don’t rush me… I want a great deal.” The market is reading this as a president no longer feeling pressured by timelines, with the naval blockade running in the background.
#3: So far, the military activity is escalating, not de-escalating. Axios reports Iran is laying more mines in SoH. The US 3rd carrier strike group (USS George H.W. Bush) is arriving with two countermine vessels. Trump yesterday ordered the US Navy to destroy any Iranian boats caught laying mines. While CNN reports that the Pentagon is actively drawing up plans to strike Iranian SoH capabilities and individual Iranian military leaders if the ceasefire collapses. i.e., NOT a attitude consistent with an imminent deal!
Spot crude and product prices eased off the early-April highs on a combination of system rerouting and deal optimism. Both now weakening. Goldman estimates April Gulf output is reduced by 14.5 mbl/d, or 57% of pre-war supply, a number that keeps getting worse the longer this drags on.
Demand-side adaptation is ongoing: S. Korea has cut its Middle East crude dependence from 69% to 56% by pulling more from the Americas and Africa, and Japan is kicking off a second round of SPR releases from 1 May. But SPRs are finite.
Ref. to the negotiations, we should not bet on speed. The current Iranian leadership is dominated by genuine hardliners willing to absorb economic pain and run the clock to extract concessions. That is not a setup for a rapid resolution. US/Israeli media briefings keep framing the delay as ”internal Iranian divisions”, the reality is more complicated and points toward weeks and months, not days.
Our point is that the complexity is large, and higher prices have only just started (given a scenario where the negotiations drag out in time). The market spent April leaning on the USD 90/bl rest-of-year assumption; that case is diminishing by the hour. If ”early May reopening” is replaced by ”June, July or later” over the next week or two, both crude and products have meaningful room to reprice higher from here. There is a high risk being short energy and betting on any immediate political resolution(!).
Down on Friday. Up on Monday. The Brent June crude oil contract traded down 5.1% last week to a close of $90.38/b. It reached a high of $103.87/b last Monday and a low of $86.09/b on Friday as Iran announced that the Strait of Hormuz was fully open for transit. That quickly changed over the weekend as the US upheld its blockade of Iranian oil exports while Iran naturally responded by closing the SoH again. The US blew a hole in the engine room of the Iranian ship TOUSKA and took custody of the ship on Sunday. Brent crude is up 5.6% this morning to $95.4/b.
The cease-fire is expiring tomorrow. The US has said it will send a delegation for a second round of negotiations in Islamabad in Pakistan. But Iran has for now rejected a second round of talks as it views US demands as unrealistic and excessive while the US is also blocking the Strait of Hormuz.
While Brent is up 5% this morning, the financial market is still very optimistic that progress will be made. That talks will continue and that the SoH will fully open by the start of May which is consistent with a rest-of-year average Brent crude oil price of around $90/b with the market now trading that balance at around $88/b.
Financial optimism vs. physical deterioration. We have a divergence where the financial market is trading negotiations, improvements and resolution while at the same time the physical market is deteriorating day by day. Physical oil flows remain constrained by disrupted flows, longer voyage times and elevated freight and insurance costs.
Financial markets are betting that a US/Iranian resolution will save us in time from violent shortages down the road. But every day that the SoH remains closed is bringing us closer to a potentially very painful point of shortages and much higher prices.
The US blockade is also a weapon of leverage against its European and Asian allies. When Iran closed the SoH it held the world economy as a hostage against the US. The US blockade of the SoH is of course blocking Iranian oil exports. But it is also an action of disruption directed towards Europe and Asia. The US has called for the rest of the world to engaged in the war with Iran: ”If you want oil from the Persian Gulf, then go and get it”. A risk is that the US plays brinkmanship with the global oil market directed towards its European and Asian allies and maybe even towards China to force them to engage and take part. Maybe unthinkable. But unthinkable has become the norm with Trump in the White House.


Sommarväder skapar prisrally på elbörsen
Oil product price pain is set to rise as the Strait of Hormuz stays closed into summer

Solkraften pressar elpriserna dagtid

Michel Gubel ger sin syn på oljemarknaden