

Analys
OPEC lämnar produktionen oförändrad

![]() Förra veckan skickade vi ut en rapport med förutsättningarna inför OPEC mötet. Vi argumenterade för sannolikheten att OPEC skulle låta produktionen fortsätta oförändrad på 30 Mbpd. Igår fick vi beskedet från Wien, OPEC fortsätter producera mot sitt tidigare mål och man vidtar inga åtgärder för att stärka disciplinen inom gruppen. Marknaden kommer nu hamna i överskott under första halvåret och priset kommer falla ytterligare. Brentoljan föll 6,6 % igår och vi har påbörjat en ny era för oljemarknaden. Femton år av stigande pris har nu abrupt nått sitt slut.
Förra veckan skickade vi ut en rapport med förutsättningarna inför OPEC mötet. Vi argumenterade för sannolikheten att OPEC skulle låta produktionen fortsätta oförändrad på 30 Mbpd. Igår fick vi beskedet från Wien, OPEC fortsätter producera mot sitt tidigare mål och man vidtar inga åtgärder för att stärka disciplinen inom gruppen. Marknaden kommer nu hamna i överskott under första halvåret och priset kommer falla ytterligare. Brentoljan föll 6,6 % igår och vi har påbörjat en ny era för oljemarknaden. Femton år av stigande pris har nu abrupt nått sitt slut.
Stor uppmärksamhet kring OPEC-mötet i Wien
Oljeminstrarna och deras delegationer samlas i stora salen i OPEC:s huvudkvarter i Wien. De ger presentationer av marknadsläget och drar sig sedan undan till ett eget rum där förhandlingarna kring produktionskvoten sker. När en överrenskommelse har nåtts ger de en intervju till media och sedan följer en presskonferens där analytiker och journalister får ställa frågor.
OPEC är en unik organisation. Inom OPEC finns inga svurna fiender eller vänner. Det finns bara ett gemensamt intresse för olja. Denna gång räckte inte det intresset till för att hindra oljepriset från att falla.
Nästa OPEC-möte förlades till den 6:e juni 2015. Det tyder på att OPEC är komfortabel med sitt beslut. Med ett möte i slutet av februari kunde OPEC först observerat prisutvecklingen under den säsongsmässigt starkare efterfrågan under vintern och sedan korrigerat produktionen inför det svagare andra kvartalet. Nu är det uppenbart att OPEC har valt att låta USA:s skifferproducenter reglera produktionen i takt med att de blir olönsamma.
Marknaden ska balansera produktionen – Inte OPEC
Saudiarabien gjorde precis vad de har sagt i upprinnelsen till gårdagens möte – låter marknaden och priset reglera produktionen – inte Saudiarabien och inte OPEC. Under de senaste veckorna har det kommit en uppsjö av estimat för produktionskostnaden av skifferolja i USA. Vi håller oss till den vy vi presenterade i förra veckans rapport ”USA-OPEC: 1-0” där vi argumenterar för att lejonparten tål priser ner mot WTI 65 USD/fat, där risken ligger på nedsidan när många, om inte de flesta, producenter är skyddade av hedgar under nästkommande sex månader. Marknaden ska nu gå till en punkt då tillväxttakten och produktionen i USA:s skifferfält verkligen minskar. Ingen vet var den punkten ligger.
Saudiarabien bestämde agendan I Wien
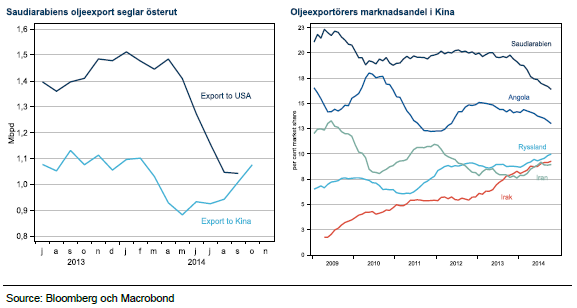
Det finns en mycket enkel förklaring till vad som hände i Wien: Den marknadsandel som Saudiarabien prioriterar i längden finns i Asien. Den asiatiska marknaden kommer bära upp hela tillväxten i efterfrågan det kommande decenniet. Saudiarabien har förlorat marknadsandelar i USA under 2014, samtidigt som konkurrensen om marknaden i Kina har ökat. Ryssland, Irak och Iran strider alla för sin del av kakan och ingen av dem skulle deltagit i en produktionsminskning, varför Saudiarabien skulle bära risken för alla prishöjande minskningar av produktionen.
Saudiarabien överger sin roll som oljekran
Utsikterna för USA: skifferproducenter har fått Saudiarabien att överge sin roll som swing producent, för att istället fokusera på sin egen marknadsandel. De övriga elva medlemmarna i OPEC har förlitat sig på Saudiarabiens intresse att minska produktionen när priset gått för lågt. Samtidigt har de övriga ofta valt att själva fortsätta producera i samma takt. Saudiarabien vill inte längre ge upp marknadsandelar för att hjälpa de övriga OPEC-medlemmarna. Landet har stora monetära reserver och USA:s skifferproducenter har dykt upp som en ny pålitligt swing producent i marknaden.
Capex and opex kan inte betalas med Amex
Nu kommer breakevenkostnader att hamna i fokus och det är värt att påtala skillnaderna mellan skifferproducenter och konventionella oljeproducenter. Investeringskostnaden, capex + rörlig produktionskostnad, opex motsvarar produktionskostnaden för ett nytt fält. Dessa mått inkluderar prospektering, utveckling och drift och är inte relevant för prisgolv. I det korta perspektivet (1-3 år) är det opex som sätter prisgolvet före produktionen verkligen börjar minska. Så länge opex har täckning kommer producenterna fortsätta att pumpa. Det är därför som producenternas hedgar är så viktiga när priserna börjar falla. Marknaden överraskas så gott som alltid över vilka låga priser som producenterna kan utstå, men även för högkostnadsfält som Kanadas oljesand där capex+opex kan vara omkring 90 usd/fat är opex endast 30 usd/fat. Djuphavsfält med en capex+opex i samma härrad kan ha opex på omkring 40 usd/fat.
Skiffer är annorlunda
Skifferfälten har en mycket mindre skillnad mellan capex och opex. Det betyder att skillnaden mellan priserna som ger incitament att öka investeringar och att minska produktionen ligger närmare varandra. Produktionen av skifferolja karaktäriseras också av skarpt vikande produktion redan andra året. I genomsnitt är produktionen endast 40 % av år ett under andra året. Produktionen kommer därför snabbt att anpassa sig till rådande pris. Den finansiella strukturen för skifferolja gör den till en ideal swing producent som kommer fylla alla Saudiarabiens behov av en aktör som begränsar marknadens totala produktion.


Brent is climbing higher. Front-month is at USD 106.3/bl this morning, close to a weekly high and a USD 9/bl jump from Mondays open. This is the move we flagged as a risk earlier in the week: the market shifting from ”a deal is around the corner” to ”this is going to take longer than we thought”.

Analyst Commodities, SEB
During April, rest-of-year Brent remained remarkably stable around USD 90/bl. A stability which rested on one single assumption: the SoH reopens around 1 May. That assumption is now slowly falling apart.
As we highlighted yesterday: every week of delay beyond 1 May adds (theoretically) ish USD 5/bl to the rest-of-year average, as global inventories draw 100 million barrels per week. i.e., a mid-May reopening implies rest-of-year Brent closer to USD 100/bl, and anything pushing into June or July takes us meaningfully higher.
What’s changed in the last 48 hours:
#1: The US military has formally warned that clearing suspected sea mines from SoH could take up to six months. That is a completely different timescale from what the financial market is pricing. Even a political deal tomorrow does not immediately reopen the strait.
#2: Trump has shifted his tone from urgency to ”strategic patience”. In yesterday’s press conference: ”Don’t rush me… I want a great deal.” The market is reading this as a president no longer feeling pressured by timelines, with the naval blockade running in the background.
#3: So far, the military activity is escalating, not de-escalating. Axios reports Iran is laying more mines in SoH. The US 3rd carrier strike group (USS George H.W. Bush) is arriving with two countermine vessels. Trump yesterday ordered the US Navy to destroy any Iranian boats caught laying mines. While CNN reports that the Pentagon is actively drawing up plans to strike Iranian SoH capabilities and individual Iranian military leaders if the ceasefire collapses. i.e., NOT a attitude consistent with an imminent deal!
Spot crude and product prices eased off the early-April highs on a combination of system rerouting and deal optimism. Both now weakening. Goldman estimates April Gulf output is reduced by 14.5 mbl/d, or 57% of pre-war supply, a number that keeps getting worse the longer this drags on.
Demand-side adaptation is ongoing: S. Korea has cut its Middle East crude dependence from 69% to 56% by pulling more from the Americas and Africa, and Japan is kicking off a second round of SPR releases from 1 May. But SPRs are finite.
Ref. to the negotiations, we should not bet on speed. The current Iranian leadership is dominated by genuine hardliners willing to absorb economic pain and run the clock to extract concessions. That is not a setup for a rapid resolution. US/Israeli media briefings keep framing the delay as ”internal Iranian divisions”, the reality is more complicated and points toward weeks and months, not days.
Our point is that the complexity is large, and higher prices have only just started (given a scenario where the negotiations drag out in time). The market spent April leaning on the USD 90/bl rest-of-year assumption; that case is diminishing by the hour. If ”early May reopening” is replaced by ”June, July or later” over the next week or two, both crude and products have meaningful room to reprice higher from here. There is a high risk being short energy and betting on any immediate political resolution(!).
Down on Friday. Up on Monday. The Brent June crude oil contract traded down 5.1% last week to a close of $90.38/b. It reached a high of $103.87/b last Monday and a low of $86.09/b on Friday as Iran announced that the Strait of Hormuz was fully open for transit. That quickly changed over the weekend as the US upheld its blockade of Iranian oil exports while Iran naturally responded by closing the SoH again. The US blew a hole in the engine room of the Iranian ship TOUSKA and took custody of the ship on Sunday. Brent crude is up 5.6% this morning to $95.4/b.

The cease-fire is expiring tomorrow. The US has said it will send a delegation for a second round of negotiations in Islamabad in Pakistan. But Iran has for now rejected a second round of talks as it views US demands as unrealistic and excessive while the US is also blocking the Strait of Hormuz.
While Brent is up 5% this morning, the financial market is still very optimistic that progress will be made. That talks will continue and that the SoH will fully open by the start of May which is consistent with a rest-of-year average Brent crude oil price of around $90/b with the market now trading that balance at around $88/b.
Financial optimism vs. physical deterioration. We have a divergence where the financial market is trading negotiations, improvements and resolution while at the same time the physical market is deteriorating day by day. Physical oil flows remain constrained by disrupted flows, longer voyage times and elevated freight and insurance costs.
Financial markets are betting that a US/Iranian resolution will save us in time from violent shortages down the road. But every day that the SoH remains closed is bringing us closer to a potentially very painful point of shortages and much higher prices.
The US blockade is also a weapon of leverage against its European and Asian allies. When Iran closed the SoH it held the world economy as a hostage against the US. The US blockade of the SoH is of course blocking Iranian oil exports. But it is also an action of disruption directed towards Europe and Asia. The US has called for the rest of the world to engaged in the war with Iran: ”If you want oil from the Persian Gulf, then go and get it”. A risk is that the US plays brinkmanship with the global oil market directed towards its European and Asian allies and maybe even towards China to force them to engage and take part. Maybe unthinkable. But unthinkable has become the norm with Trump in the White House.
Wild moves yesterday. Brent crude traded to a high of $114.43/b and a low of $96.0/b and closed at $99.94/b yesterday.
US – Iran negotiations ongoing or not? What a day. Donald Trump announced that good talks were ongoing between Iran and the US and that the 48 hour deadline before bombing Iranian power plants and energy infrastructure was postponed by five days subject to success of ongoing meetings. Iranian media meanwhile stated that no meetings were ongoing at all.
Today we are scratching our heads trying to figure out what yesterday was all about.
Friends and family playing the market? Was it just Trump and his friends and family who were playing with oil and equity markets with $580m and $1.46bn in bets being placed by someone in oil and equity markets just 15 minutes before Trump’s announcement?
Was Trump pulling a TACO as he reached his political and economic pain point: Brent at $112/b, US Gas at $4/gal, SPX below 200dma and US 10yr above 4.4%?
Different Iranian factions with Trump talking with one of them? Are there real negotiations going on but with the US talking to one faction in Iran while another, the hardliners, are not involved and are denying any such negotiations going on?
Extending the ultimatum to attack and invade Kharg island next weekend? Or, is the five day delay of the deadline a tactical decision to allow US amphibious assault ships and marines to arrive in the Gulf in the upcoming weekend while US and Israeli continues to degrade Iranian military targets till then. And then next weekend a move by the US/Israel to attack and conquer for example the Kharg island?
We do not really know which it is or maybe a combination of these.
We did get some kind of TACO ydy. But markets have been waiting for some kind of TACO to happen and yesterday we got some kind of TACO. And Brent crude is now trading at $101.5/b as a result rather than at $112-114/b as it did no the high yesterday.
But what really matters in our view is the political situation on the ground in Iran. Will hardliners continue to hold power or will a more pragmatic faction gain power?
If the hardliners remain in power then oil pain should extend all the way to US midterm elections. The hardliners were apparently still in charge as of last week. Iran immediately retaliated and damaged LNG infrastructure in Qatar after Israel hit Iranian South Pars. The SoH was still closed and all messages coming out of Iran indicated defiance. Hardliners continues in power has a huge consequence for oil prices going forward. The regime has played its ’oil-weapon’ (closing or chocking the Strait of Hormuz). It is using it to achieve political goals. Deterrence: it needs to be so politically and economically expensive to attack Iran that it won’t happen again in the future. Or at least that the US/Israel thinks 10-times over before they attack again. The highest Brent crude oil closing price since the start of the war is $112.19/b last Friday. In comparison the 20-year inflation adjusted Brent price is $103/b. So Brent crude last Friday at $112.19/b isn’t a shockingly high price. And it is still far below the nominal high of $148/b from 2008 which is $220/b if inflation adjusted. So once in a lifetime Iran activates its most powerful weapon. The oil weapon. It needs to show the power of this weapon and it needs to reap political gains. Getting Brent to $112/b and intraday high of $119.5/b (9 March) isn’t a display of the power of that weapon. And it is not a deterrence against future attacks.
So if the hardliners remain in power in Iran, then the SoH will likely remain chocked all the way to US midterm elections and Brent crude will at a minimum go above the historical nominal high of $148/b from 2008.
Thus the outlook for the oil price for the rest of the year doesn’t depend all that much of whether Trump pulls a TACO or not. Stops bombing or not. It depends more on who is in charge in Iran. If it is the hardliners, then deterrence against future attacks via chocking of the SoH and high oil prices is the likely line of action. It is impacting the world but the Iranian ’oil-weapon’ is directed towards the US president and the the US midterm elections.
If a pragmatic faction gets to power in Iran, then a very prosperous future is possible. However, if power is shifting towards a more pragmatic faction in Iran then a completely different direction could evolve. Such a faction could possibly be open for cooperation with the US and the GCC and possibly put its issues versus Israel aside. Then the prosperity we have seen evolving in Dubai could be a possible future also for Iran.
So far it looks like the hardliners are fully in charge. As far as we can see, the hardliners are still fully in control in Iran. That points towards continued chocking of the SoH and oil prices ticking higher as global inventories (the oil market buffers) are drawn lower. And not just for a few more weeks, but possibly all the way to the US midterm elections.


Solkraften pressar elpriserna dagtid

Michel Gubel ger sin syn på oljemarknaden

Svag vårflod dubblar elpriserna
Brent crude up USD 9/bl on the week… ”deal around the corner” narrative fades
Market Still Betting on Timely Resolution, But Each Day Raises Shortage Risk
Market Still Betting on Timely Resolution, But Each Day Raises Shortage Risk
Brent crude up USD 9/bl on the week… ”deal around the corner” narrative fades
Michel Gubel ger sin syn på oljemarknaden
Solkraften pressar elpriserna dagtid
Svag vårflod dubblar elpriserna
-
Analys3 veckor sedan
Market Still Betting on Timely Resolution, But Each Day Raises Shortage Risk
-
Analys3 veckor sedan
Brent crude up USD 9/bl on the week… ”deal around the corner” narrative fades
-
 Nyheter2 veckor sedan
Michel Gubel ger sin syn på oljemarknaden
-
 Nyheter2 veckor sedan
Solkraften pressar elpriserna dagtid
-
Nyheter2 veckor sedan
Svag vårflod dubblar elpriserna