

Analys
Modity om elpriset vecka 9 2015

Veckans marknadskommentar
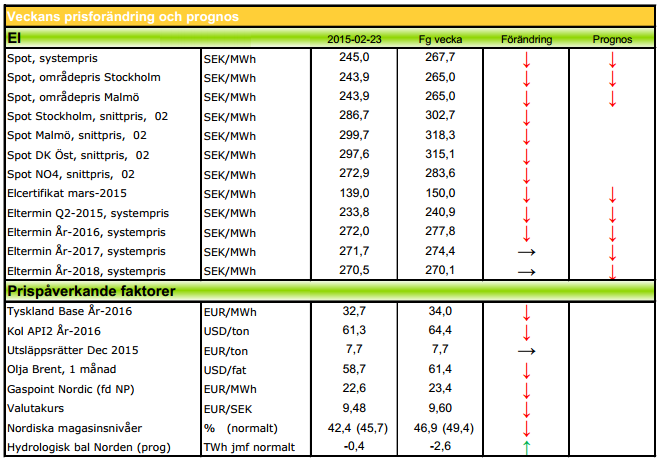
Kol och olja har vänt ned igen, på överutbud, och påverkar det mesta. Elen är ned på varma, blöta och blåsiga prognoser. Utsläppsrätterna vacklar men osäkerhet inför omröstningen. Hydrobalansen håller sig positiv och väntas stärkas ytterligare i det närmaste. Elcerten visar det största fallet och sätter nya lägstanoteringar.
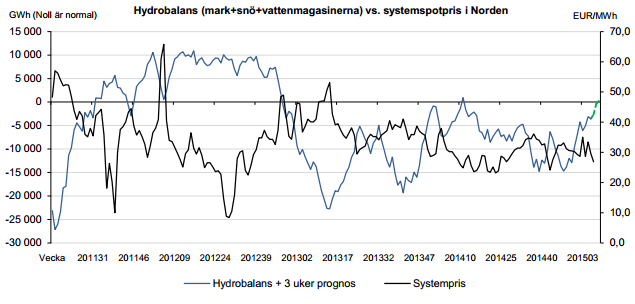
Hydrobalansen ligger v07 på 0,5 TWh över normalen. Det är lite mindre än vad som var väntat. Den största osäkerhetsfaktorn är i snömängden. Det har kommit snö rätt ojämnt fördelat över Skandinavien, väldigt mycket på sina ställen och väldigt lite på andra. Den rådande värmen gör också att avsmältningen pågår. Det är fortfarande så att prognoserna ser blöta och milda ut så en fortsatt upplagring av energi över normalen verkar det bli!
Kärnkraftverken i Norden har idag den 23/2 en produktion på 81 % (10 046 MW). Ringhals 4 kör nu aningen reducerat. Annars är Oskarshamn 2 kvar ute till september och Ringhals 2 till november. Finska Olkiluoto 2 förväntas nu starta i kväll för att vara i full drift igen under morgondagen. PRESSTOPP! Nu precis kom en blänka om att man senarelägger starten till i morgon bitti kl 06! De finska verken körs därmed 68 %.
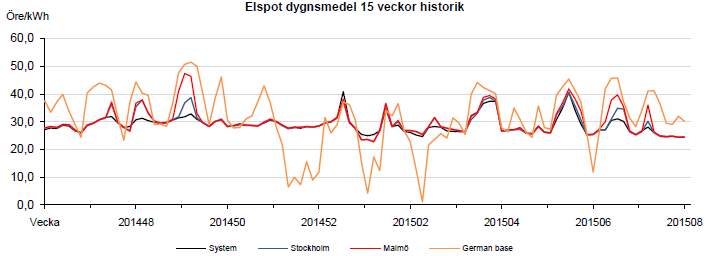
Systemspotpriset förra veckan blev 26,87 €/MWh. Det var en tillbakagång på nästan tre euro. I prisområde SE3 blev den 27,87 och i SE4 28,0. En stark press på vattenkraften i och med att det finns mycket vatten som måste tas hand om innan snösmältningen sätter igång. Särsilt i östra Norge har man haft ett högt flöde och varnat för ”flom”. När nu väderläget är varmt även på kontinenten kommer det att resultera i ytterligare sjunkande priser. Vi ser att vattenkraftproducenterna har sänkt sina priser, särskilt under nattimmarna.
Terminspriser
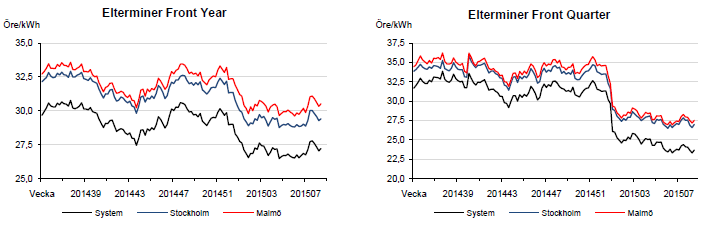
Nu har allt blivit som vanligt. Och med som vanligt menar jag fallande priser. Det är inte många faktorer som just nu pekar på en förändring. Hydroläget är mycket gott, för att bli bättre. Press på spotpriserna förväntas. Värme utöver det normala samt nederbörd i den närmsta perioden med flera TWh över normalt. Svårt att se att det ska bli någon rusning att köpa elterminer, just nu. Q2 är snart tillbaka på sitt all-time-low sedan förra veckan, YR-16 har en liten bit kvar. När nu både oljan och kolet är på väg ned igen känns terminsmarknaden på den längre sidan också svag. Q2 omsätts i skrivande stund på 24,55. År 16 handlas nu på 28,35 €/MWh.
Bränslemarknaden
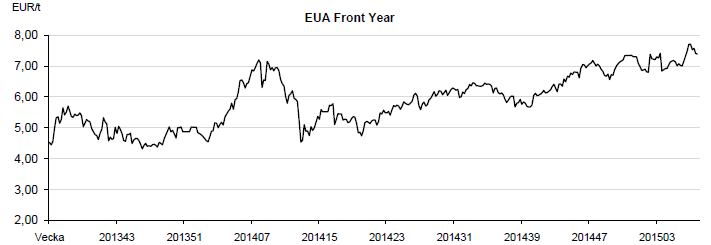
Utsläppsrätter, CO2
Nu är det många som vill analysera ett utfall utifrån olika scenarior. De flesta tror på höjda priser. Debatten står om huruvida miljösidan (ENVI), som vill ha start för MSR redan 2017, verkligen får igenom det. ”Motståndarna”, EPP, som behövs för majoritet, har antytt kompromissvilja till 2018 – ett närmande med ett år från tidigare 2019. Det finns för många utsläppsrätter i marknaden och fråga blir sedan vad man ska göra med backloadingrätterna – ut på marknaden, in i MSR eller tas bort. Inget om det finns förslag på just nu.
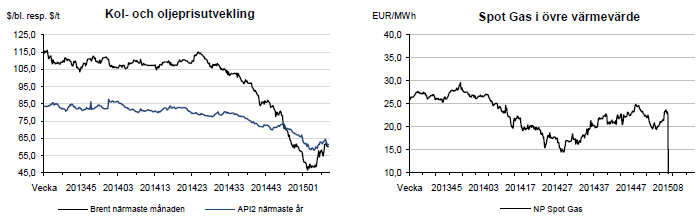
Olja: Oljan befinner sig i ett starkt utbudsöverskott. Det är svårt att bli av med den amerikanska WTI-oljan om man inte får utöka sin infrastruktur på den kontinenten. Priskurvorna pekar nu nedåt på dessa båda oljemarknader. Bara Brent, närmsta månadet, har kommit tillbaka ca 3 USD sedan förra veckan. Kan vara ett tecken på att den uppåtrekyl som kom vid 44,53 USD/bbn, bara var just en rekyl, orsakad av vinstintressen. Det mesta tyder på en fortsatt nedgång i oljepriset. Det finns en sak som kan antyda motsatsen – det är att det kinesiska nyårsfirande är över. Osäkerheten i marknaden om huruvida Kina nu ska börja konsumera olja, kan påverka prisbilden. Det första som i så fall tyder på det är att fraktraterna kommer att stiga. Fundamentalt borde oljepriset sjunka.
Kol: Här menar alla att marknaden har ett enormt överskott. Ändå har priset gått upp senaste veckan och omsattes senast på 64,40 USD/ton. Anledningen till det är att det följer oljepriset, men tycks reagera långsammare. Därför har det inte vänt ned igen, som oljan, ännu.
Naturgas: Neddragningen i gasproduktion i holländska Groningen uppgår till ca 40 % på årsbasis. Groningen står normalt för ca 10 % av hela Europas behov så begränsningen är inte marginell. De tidigare så välfyllda gaslagren har använts till stor del och man är nu tvungen att köpa mer på marknaden igen. Detta kommer att påverka priserna för nästa år. Men – det är har varit och kommer att vara relativt varmt över kontinenten vilket gör att efterfrågan är låg. Det är även fortsatt högt inflöde av billig LNG på marknaden, vilket sammantaget påverkar nedåt.
Elcertifikat
Det har blåst kraftigt – elcert har producerats med vindens hastighet! Priserna har följaktligen sjunkit. Mer än någonsin och vi kan notera all-time-low för alla produkter. Att efterfrågan har varit låg på grund av värmen hjälper till att trycka nedåt. Mars -15 stängde i fredags på 140 SEK. Övriga priser: Mars-16 141 SEK och Mars-17 143 SEK.
Valuta
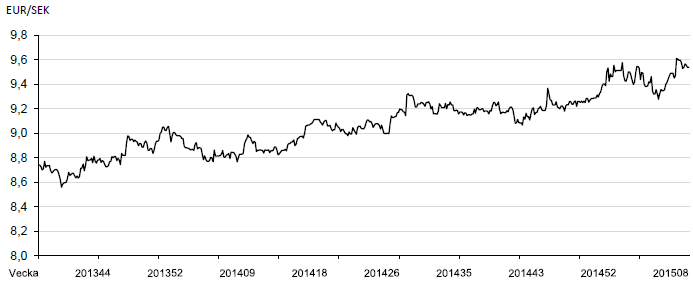
Valutakommentar
I fredags kväll kom Grekland och EU:s finansministrar överrens om en uppgörelse som räddar grekerna kvar i Eurosamarbetet. Det har inte inneburit någon nämnvärd reaktion för kronan mot euron utan vi handlar sidledes på 9,56 senast där toppen av rangen är 9,70 och botten är 9,30. Vi förväntar oss en starkare krona framöver som borde stärkas mot stödet nere vid 9,30. Mot dollarn är kronan alltjämt svag och man får hosta upp 8,45 på spotmarknaden för en dollar. Vi har nu 11 månader bakom oss med högre bottnar och högre toppar. Rekyler är köpvärda.
Teknisk analys
Teknisk analys Q2-15
Q2 handlades mellan 24,35 och 25,25 €/MWh förra veckan. Just nu handlas den på 24,30 och vi har ytterligare en vecka med lägre botten. Nedåttrenden är alltså intakt. Vi har numera 7 veckor med fallande toppar på frontkvartalet och vi bedömer att sannolikheten att vi fortsätter ner är stor. På uppsidan drar vi öronen åt oss om vi handlar över 25,50 då trenden får anses vara bruten. På nedsidan finns inga tal att förhålla sig till eftersom det är nya lägstanoteringar på kontraktet.
Teknisk analys År-16
År-16 handlades mellan 28,25 och 29,00 €/MWh förra veckan. Vi hade då en situation där årskontraktet gav oss en köpsignal samtidigt som frontkvartalet fortsatt var på en säljsignal. Som vi sa i föregående uppdatering var sannolikheten större att vi handlar ned än upp. Mycket riktigt så blev kontraktet avvisat från toppen av den aktuella rangen (ca 28,00 – 29,00) för att nu omsättas på 28,20. Det innebär att även årskontraktet är tillbaka på en säljsignal där vi noterar att vi har en lägre botten och att vi möjligen får se en fortsättning av nedåttrenden. 27,95 har tidigare varit stöd vid två tillfällen. Det kallas en dubbelbotten. Det finns egentligen inget begrepp som heter en trippelbotten och därmed ökar risken för att vi bryter igenom stödet om det utmanas på nytt.
[box]Denna energimarknadskommentar om elpriset publiceras på Råvarumarknaden.se med tillstånd och i samarbete med Modity Energy Trading.[/box]
Ansvarsfriskrivning
Energimarknadskommentaren har producerats av Modity Energy Trading. Informationen är rapporterad i god tro och speglar de aktuella åsikterna hos medarbetarna, dessa kan ändras utan varsel. Modity Energy Trading tar inget ansvar för handlingar baserade på informationen.
Om Modity Energy Trading
Modity Energy Trading erbjuder energibolag och större företag den erfarenhet, kompetens och analysredskap som krävs för en trygg och effektiv förvaltning av energiportföljen. Modity bedriver handel med allt från el och gas, till elcertifikat, valutor och utsläppsrätter. Företagets kunder får dessutom ta del av deras analysprodukter som t.ex det fullständiga marknadsbrevet med ytterligare kommentarer och prognoser. För ytterligare information se hemsidan.

Analys
Physical easing. Iran risk easing. But Persian Gulf risk cannot fully fade before US war ships are pulled away

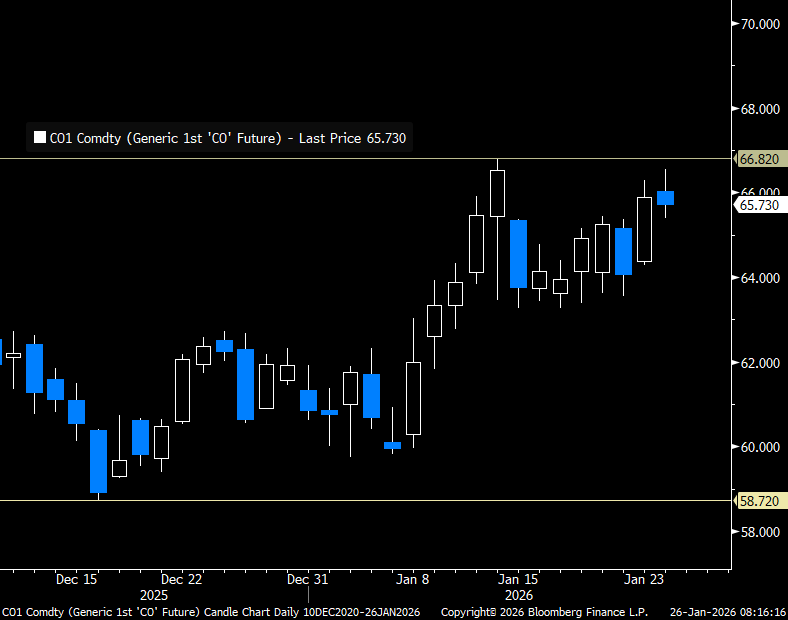
Traded down 3.7% last week as Iranian risk faded a bit. Brent crude traded in a range of $65.19 – 69.76/b last week. In the end it traded down 3.7% with a close of $68.05/b. It was unable to challenge the peak of $71.89/b from the previous week when the market got its first nervous shake as Trump threatened Iran with an armada of US war ships.

The market has started to cool down a bit with US and Iran in talks in Oman on Friday and Brent crude is easing 0.9% this morning to $67.4/b in an extension of that. As we have stated before we think the probability is very low for a scenario where the US attacks Iran in such a way that it risks an uncontrollable escalation with possible large scale disruption of oil out of the Strait of Hormuz and thus a massive spike in the oil price. That would endanger Trump’s mid-term election which is already challenged with unhappy US voters complaining about affordability and that Trump is spending too much time on foreign issues.
A statement by Trump last week that India had agreed not to buy Russian crude turns out to have little substance as India has agreed to no such thing on paper. The statement last week naturally supported oil prices as the market is already struggling with a two tire market with legal versus illegal barrels. There is a lot of friction in the market for sanctioned crude oil barrels from Iran and Russia. If India had agreed not to buy Russian crude oil then the market for legal barrels would have been tighter.
The physical market has been tighter than expected. And the recent concerns over Iranian risk has come on top of that. The market is probably starting calm down regarding the Iranian risk. But the physical tightness is also going to ease gradually over the coming couple of weeks. CPC blend exports averaged 1.5 mb/d last year, but were down to less than 1 mb/d in January due to a combination of factors. Drone attacks by Ukraine in late November. The Tengiz field has been disrupted by fires. Adverse winter weather has also been a problem. US crude oil production has also been disrupted by a fierce winter storm. But these issues are fading with supply reviving over the next couple of weeks.
The physical tightness is likely going to ease over the next couple of weeks. The market may also have started to get used to the Iranian situation. But the Iranian risk premium cannot be fully defused as long as US warships are located where they are with their guns and rockets pointing towards Iran.
Brent crude rose 2.7% last week to $65.88/b with a gain on Friday of 2.8%. Unusually cold US winter weather with higher heating oil demand and likely US oil supply outages was probably part of the bullish drive at the end of last week. But US threats towards Iran with USS Abraham Lincoln being deployed to the Middle East was probably more important.
Brent crude has maintained the gains it got from 8 January onwards when it rose from the $60/b-line and up to around $65/b on the back of Iranian riots where the US added fuel to the fire by threatening to attack Iran in support of the rioters. This morning Brent has tested the upside to $66.54/b. That is short of the $66.82/b from 14 January and Brent has given back part of the early gains this morning and is currently trading close to unchanged versus Friday’s close with a dollar decline of 0.4% not enough to add much boost to the price yet at least.
Brent crude front-month prices in USD/b
The rally in Brent crude from the $60/b-line to its current level of $65-66/b seems to be tightly linked to an elevated risk of the US attacking Iran in support of the rioters. Bloomberg reported on Saturday that the US has dispatched the USS Abraham Lincoln aircraft carrier and its associated strike group to the Middle East. It is a similar force which the US deployed to the Caribbean Sea just weeks before the 3 January operation where Maduro was captured. The probability of a US/Israeli attack on Iran is pegged at 65-70% by geopolitical risk assessment firms Eurasia Group and Rapidan Energy Group. Such a high probability explains much of the recent rally in Brent crude.
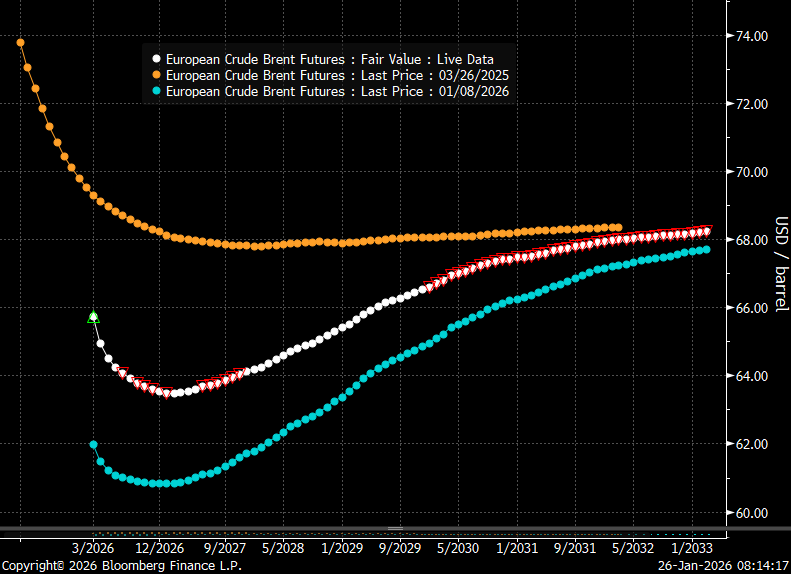
The recent rally in Brent crude is not a signal from the oil market that the much discussed global surplus has been called off. If we look at the shape of the Brent crude oil curve it is currently heavily front-end backwardated with the curve sloping upwards in contango thereafter. It signals front-end tightness or near term geopolitical risk premium followed by surplus. If the market had called off the views of a surplus, then the whole Brent forward curve would have been much flatter and without the intermediate deep dip in the curve. The shape of the Brent curve is telling us that the market is concerned right now for what might happen in Iran, but it still maintains and overall view of surplus and stock building unless OPEC+ cuts back on supply.
It also implies that Brent crude will fall back if the US pulls back from its threats of attacking Iran.
Brent crude forward curves in USD/b.
Falling back this morning. Brent crude traded from an intraday low of $59.75/b last Monday to an intraday high of $63.92/b on Friday and a close that day of $63.34/b. Driven higher by the rising riots in Iran. Brent is trading slightly lower this morning at $63.0/b.
Iranian riots and risk of supply disruption in the Middle East takes center stage. The Iranian public is rioting in response to rapidly falling living conditions. The current oppressive regime has been ruling the country for 46 years. The Iranian economy has rapidly deteriorated the latest years along with the mismanagement of the economy, a water crisis, encompassing corruption with the Iranian Revolutionary Guard Corps at the center and with US sanctions on top. The public has had enough and is now rioting. SEB’s EM Strategist Erik Meyersson wrote the following on the Iranian situation yesterday: ”Iran is on the brink – but of what?” with one statement being ”…the regime seems to lack a comprehensive set of solutions to solve the socioeconomic problems”. That is of course bad news for the regime. What can it do? Erik’s takeaway is that it is an open question what this will lead to while also drawing up different possible scenarios.
Personally I fear that this may end very badly for the rioters. That the regime will use absolute force to quash the riots. Kill many, many more and arrest and torture anyone who still dare to protest. I do not have high hopes for a transition to another regime. I bet that Iranian’s telephone lines to its diverse group of autocratic friends currently are running red-hot with ”friendly” recommendations of how to quash the riots. This could easily become the ”Tiananmen Square” moment (1989) for the current Iranian regime.
The risks to the oil market are:
1) The current regime applies absolute force. The riots die out and oil production and exports continue as before. Continued US and EU sanctions with Iranian oil mostly going to China. No major loss of supply to the global market in total. Limited impact on oil prices. Current risk premium fades. Economically the Iranian regime continues to limp forward at a deteriorating path.
2) The regime applies absolute force as in 1), but the US intervenes kinetically. Escalation ensues in the Middle East to the point that oil exports out of the Strait of Hormuz are curbed. The price of oil shots above $150/b.
3) Riots spreads to affect Iranian oil production/exports. The current regime does not apply sufficient absolute force. Riots spreads further to affect oil production and export facilities with the result that the oil market loses some 1.5 mb/d to 2.0 mb/d of exports from Iran. Thereafter a messy aftermath regime wise.
Looking at the oil market today the Brent crude oil price is falling back 0.6% to $63/b. As such the oil market is assigning very low risk for scenario 2) and probably a very high probability for scenario 1).
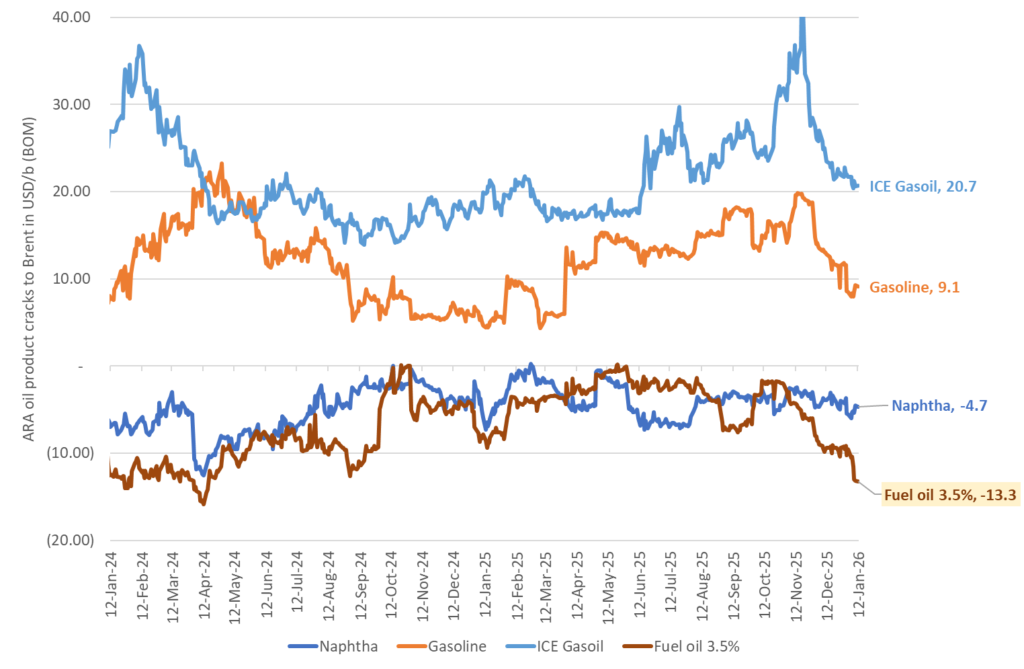
Venezuela: Heavy sour crude and product prices falls sharply on prospect of reduced US sanctions on Venezuelan oil exports. The oil market take on Venezuela has quickly shifted from fear of losing what was left of its production and exports to instead expecting more heavy oil from Venezuela to be released into the market. Not at least easier access to Venezuelan heavy crude for USGC refineries. The US has started to partially lift sanctions on Venezuelan crude oil exports with the aim of releasing 30mn-50mn bl of Venezuelan crude from onshore and offshore stocks according to the US energy secretary Chris Wright. But a significant increase in oil production and exports is far away. It is estimated that it will take $10bn in capex spending every year for 10 years to drive its production up by 1.5 mb/d to a total of 2.5 mb/d. That is not moving the needle a lot for the US which has a total hydrocarbon liquids production today of 23.6 mb/d (2025 average). At the same time US oil majors are not all that eager to invest in Venezuela as they still hold tens of billions of dollars in claims against the nation from when it confiscated their assets in 2007. Prices for heavy crude in the USGC have however fallen sharply over the prospect of getting easier access to more heavy crude from Venezuela. The relative price of heavy sour crude products in Western Europe versus Brent crude have also fallen sharply into the new year.
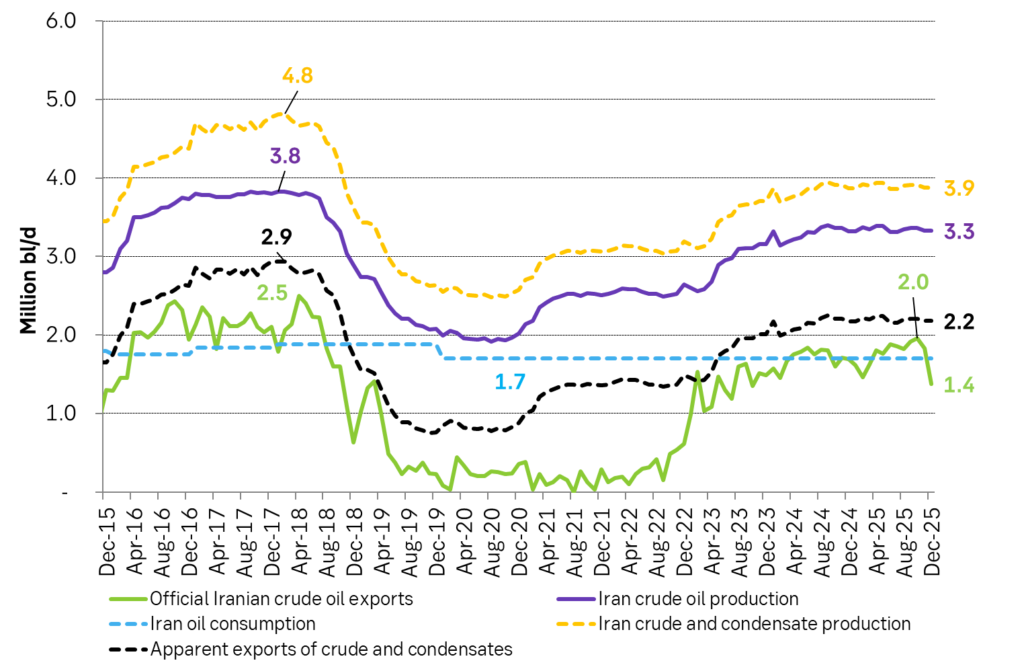
Iran officially exported 1.75 mb/d of crude on average in 2025 falling sharply to 1.4 mb/d in December. But it also produces condensates. Probably in the magnitude of 0.5-0.6 mb/d. Total production of crude and condensates probably close to 3.9 mb/d.
The price of heavy, sour fuel oil has fallen sharply versus Brent crude the latest days in response to the prospect of more heavy sour crude from Venezuela.


Lappland Guldprospektering säkrar kapital för en påskyndad tidsplan

Ett samtal om ädelmetaller ur ett längre perspektiv
Physical easing. Iran risk easing. But Persian Gulf risk cannot fully fade before US war ships are pulled away

Under 2025 byggde Kina klart 78 GW ny kolkraft

Samtal om den senaste tidens råvarurörelser

Silverpriset stiger över 100 USD per uns

Guldpriset stiger till över 5000 USD per uns

Samtal om guld och andra råvaror när flera priser rusar i höjden

Christian Kopfer om marknadens olika råvaror

Silver utgör nu 30 procent av kostnaden för att producera solcellspaneler
-
 Nyheter4 veckor sedan
Silverpriset stiger över 100 USD per uns
-
 Nyheter3 veckor sedan
Guldpriset stiger till över 5000 USD per uns
-
 Nyheter3 veckor sedan
Samtal om guld och andra råvaror när flera priser rusar i höjden
-
 Nyheter4 veckor sedan
Christian Kopfer om marknadens olika råvaror
-
 Nyheter4 veckor sedan
Silver utgör nu 30 procent av kostnaden för att producera solcellspaneler
-

 Nyheter2 veckor sedan
Kall och nederbördsfattig månad driver upp elpriset
-

 Nyheter3 veckor sedan
Indien kommer inte att göra slut med kol
-

 Nyheter3 veckor sedan
Kylan lyfter elpriset i vinter, minst 40 procent högre än väntat