

Analys
LME Week 2014 på tre minuter

![]() LME veckan är dagarna då industrin för basmetaller samlas i London och försöker bilda sig en uppfattning om var priserna på metallerna ska ta vägen nästa år. Upptakten till årets konferens var allt annat än positivt när basmetallerna kommit ner i pris och investmentbankerna sänkt utsikterna inför nästa år. Hemma efter årets LME-vecka sammanfattar vi diskussioner, teman och frågor.
LME veckan är dagarna då industrin för basmetaller samlas i London och försöker bilda sig en uppfattning om var priserna på metallerna ska ta vägen nästa år. Upptakten till årets konferens var allt annat än positivt när basmetallerna kommit ner i pris och investmentbankerna sänkt utsikterna inför nästa år. Hemma efter årets LME-vecka sammanfattar vi diskussioner, teman och frågor.
Förväntningar
Inför årets tillställning reste vi till London med förväntansbilden av att Indonesiens exportförbud skulle föra nickel till årets snackis, tätt följt av de fysiska premierna för aluminium och LME:s aktion att införa en börshandlad fysisk premie efter att ha misslyckats lösa situationen med de långa köerna för att få ut aluminium ur LME-lagerhusen. I vår förväntansbild fanns inte det generellt negativa sentimentet kring makroutsikterna och metallmarknaderna inför 2015. Att Kina bromsar in har vi haft i korten i flera år och borde inte vara en överraskning för någon i branschen.
LME-seminariet
LME:s Vd, Gary Jones adresserade problemet med köer till lagerhusen redan i öppningsanförandet. Stora ord krävdes för att klä arbetet med att ta bort köerna men de maskerade inte LME:s misslyckande och kvittot kom när LME lanserade ett kontrakt för den fysiska premien. På så vis kan metallhandlare handla risken för att köerna och därmed premierna ska gå upp eller ner. En häpnadsväckande raffinerad lösning på ett problem med att få ut metalltackor ur ett plåthus med en gaffeltruck.
Generella teman
- Utbudet är viktigare än efterfrågan för priserna 2015
- Ökad nationalisering av naturtillgångar (Indonesien, nickel)
- Metallerna divergerar med allt mer åtskiljd fundamenta
- Lägre energipriser sänker metallprisgolvet genom lägre produktionskostnad
- Kinas husmarknad största orosmolnet på makrosidan
- Ökad volatilitet efter lanseringen av minikontrakt för retailmarknaden i Kina via LME:s kommande Hong Kong-kontrakt
- Lagerstatistik har blivit svårtolkad då stora lager finns utanför LME-husen
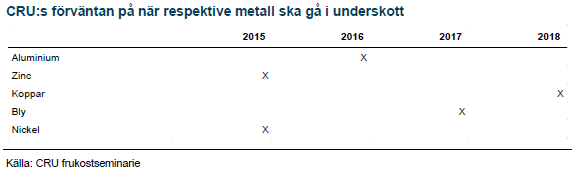
- Konsensus förväntan på när underskott ska uppstå per metall:
LME Week metall för metall
Nedan sammanfattar vi intrycken från diskussionerna per metall. Av de tre, zink, aluminium och koppar, som avhandlades på det officiella LME-seminariet trodde åhörarna att risken för prisuppgång var störst för Zn 43 % följt av Al 42% och sist koppar med 15%.
Koppar
Alla metaller pressas av ökat utbud utom koppar som pressas av förväntan om ökat utbud. Utbudstoppen har flyttats från 2014 till 2015 efter flera förseningar bland de stora projekten och Grasbergs minskade export under 2014 under Indonesiens exportförbud. Riskerna för utbudstoppen nästa år är mycket mindre då 30% av den kommer från normalisering i produktionen i vissa stora gruvor (bland annat Grasberg), 35% infasning av nya gruvor som börjat producera (de är förbi det mest kritiska stadiet) och 35% från nya greenfield- eller brownfieldprojekt. Kinas årliga tillväxt i kopparimport väntas falla till den lägsta på 6 år och kombinationen gör att priserna väntas ner under 2015 men sedan åter upp 2016 då pipelinen för kopparprojekt är tunn längre fram. Viktigaste produktionsfaktorerna under 2015 är Sierra Goroda, Sisha, Oyu Tolgoi, Caserones, Toromocho och Mine minestro Hales. Vi håller kvar vårt scenario med en koppardipp till 5500 USD/ton 2015 men där medelpriset blir mellan 5750 USD/ton.
Aluminium
Första halvan av 2014 dominerades av uppskruvade förväntningar på efterfrågan från Amerikansk bilindustri. I kombination med mycket trendföljande spekulation steg priset snabbt. Utsikterna för aluminium i bilindustrin har sedan dess delvis grusats när nästa generations bilar verkar gå från aluminium till höghållfasta supertunna stål. Indonesiens exportförbud har inte drivit upp priset på råvaran bauxit och avställd smältverkskapacitet finns hela tiden i bilden, redo att kliva in och dämpa långsiktiga prisrallyn. Det finns ingen brist på aluminium globalt men en del vittnar om brist i statistiken med oväntade poster på 850 Kt i Mexico ämnad för amerikanska marknaden. Kina och resten av världen är delvis separerade men om ex Kina går i underskott kommer Kinas export av halvfabrikat täcka upp. Vi behåller vårt scenario för 2015 med aluminium mellan 1800-2000 och 1900 USD/ton i medelpris.
Zink
Annalkande gruvstängningar börjar etablera sig som tema och zink är nu nästa nickel i mångas sinne. Tesen fick dock visst motstånd där man menar att det visserligen ska stängas några få riktigt stora gruvor men det finns å andra sidan ett stort antal små gruvor som kommer expandera med strategin att ta marknadsandelar i bakvattnet av de utbrutna. Svårt att bedöma sannolikheten med många små expansioner men vi står kvar i relativt positiv syn på zink med 2250 USD/ton som medelpris 2015
Nickel
Tveklöst den metall där deltagarna har störst tro på högre priser inför 2015. Underliggande fundamenta har förvärrats under året och kunskapen kring Filipinernas säsongsmönster i exporten som har täckt upp för Indonesiens exportförbud så här lång börjar sprida sig. Filipinerna går nu in i monsunperioden då regnfall minskar möjligheterna att exportera malm radikalt. Deltagarna räknar med att nickelmarknaden hamnar i underskott nästa år och att lagernivåer kommer konsumeras för att balansera marknaden. Högre prisestimat är ett tema och vårt scenario med snittpris på 23 000 USD/ton är visserligen en stor rörelse men finner relativt god acceptans. Nickel är i våra ögon den enda basmetall som har risk för prisuppgång på mer än 50 % under 2015 från dagens nivåer.


Hesitant today. Brent jumped to an intraday high of $66.36/b yesterday after having touched an intraday low of $60.07/b on Monday as Indian and Chinese buyers cancelled some Russian oil purchases and instead redirected their purchases towards the Middle East due to the news US sanctions. Brent is falling back 0.4% this morning to $65.8/b.

It’s our strong view that the only sensible thing is to sell this rally. In all Trump’s unpredictability he has become increasingly predictable. Again and again he has rumbled about how he is going to be tough on Putin. Punish Putin if he won’t agree to peace in Ukraine. Recent rumbling was about the Tomahawk rockets which Trump threatened on 10 October and 12 October to sell/send to Ukraine. Then on 17 October he said that ”the U.S. didn’t want to give away weapons (Tomahawks) it needs”.
All of Trump’s threats towards Putin have been hot air. So far Trump’s threats have been all hot air and threats which later have evaporated after ”great talks with Putin”. After all these repetitions it is very hard to believe that this time will be any different. The new sanctions won’t take effect before 21. November. Trump has already said that: ”he was hoping that these new sanctions would be very short-lived in any case”. Come 21. November these new sanctions will either evaporate like all the other threats Trump has thrown at Putin before fading them. Or the sanctions will be postponed by another 4 weeks or 8 weeks with the appearance that Trump is even more angry with Putin. But so far Trump has done nothing that hurt Putin/Russia. We can’t imagine that this will be different. The only way forward in our view for a propre lasting peace in Ukraine is to turn Ukraine into defensive porcupine equipped with a stinging tail if need be.
China will likely stand up to Trump if new sanctions really materialize on 21 Nov. Just one country has really stood up to Trump in his tariff trade war this year: China. China has come of age and strength. I will no longer be bullied. Trump upped tariffs. China responded in kind. Trump cut China off from high-end computer chips. China put on the breaks on rare earth metals. China won’t be bullied any more and it has the power to stand up. Some Chinese state-owned companies like Sinopec have cancelled some of their Russian purchases. But China’s Foreign Ministry spokesperson Guo Jiakun has stated that China “oppose unilateral sanctions which lack a basis in international law and authorization of the UN Security Council”. Thus no one, not even the US shall unilaterally dictate China from whom they can buy oil or not. This is yet another opportunity for China to show its new strength and stand up to Trump in a show of force. Exactly how China choses to play this remains to be seen. But China won’t be bullied by over something as important as its oil purchases. So best guess here is that China will defy Trump on this. But probably China won’t need to make a bid deal over this. Firstly because these new sanctions will either evaporate as all the other threats or be postponed once we get to 21 November. Secondly because the sanctions are explicit towards US persons and companies but only ”may” be enforced versus non-US entities.
Sanctions is not a reduction in global supply of oil. Just some added layer of friction. Anyhow, the new sanctions won’t reduce the supply of Russian crude oil to the market. It will only increase the friction in the market with yet more need for the shadow fleet and ship to ship transfer of Russian oil to dodge the sanctions. If they materialize at all.
The jump in crude oil prices is probably due to redirections of crude purchases to the Mid-East and not because all speculators are now turned bullish. Has oil rallied because all speculators now suddenly have turned bullish? We don’t think so. Brent crude has probably jumped because some Indian and Chinese oil purchasers of have redirected their purchases from Russia towards the Mid-East just in case the sanctions really materializes on 21 November.
Parts of the Brent crude curve dipping into the high $50ies/b. Brent crude fell 2.3% over the week to Friday. It closed the week at $61.29/b, a slight gain on the day, but also traded to a low of $60.14/b that same day and just barely avoided trading into the $50ies/b. This morning it is risk-on in equities which seems to help industrial metals a little higher. But no such luck for oil. It is down 0.8% at $60.8/b. This week looks set for Brent crude to dip its feet in the $50ies/b. The Brent 3mth contract actually traded into the high $50ies/b on Friday.
The front-end backwardation has been on a weakening foot and is now about to fully disappear. The lowest point of the crude oil curve has also moved steadily lower and lower and its discount to the 5yr contract is now $6.8/b. A solid contango. The Brent 3mth contract did actually dip into the $50ies/b intraday on Friday when it traded to a low point of $59.93/b.
More weakness to come as lots of oil at sea comes to ports. Mid-East OPEC countries have boosted exports along with lower post summer consumption and higher production. The result is highly visibly in oil at sea which increased by 17 mb to 1,311 mb over the week to Sunday. Up 185 mb since mid-August. On its way to discharge at a port somewhere over the coming month or two.
Don’t forget that the oil market path ahead is all down to OPEC+. Remember that what is playing out in the oil market now is all by design by OPEC+. The group has decided that the unwind of the voluntary cuts is what it wants to do. In a combination of meeting demand from consumers as well as taking back market share. But we need to remember that how this plays out going forward is all at the mercy of what OPEC+ decides to do. It will halt the unwinding at some point. It will revert to cuts instead of unwind at some point.
A few months with Brent at $55/b and 40-50 US shale oil rigs kicked out may be what is needed. We think OPEC+ needs to see the exit of another 40-50 drilling rigs in the US shale oil patches to set US shale oil production on a path to of a 1 mb/d year on year decline Dec-25 to Dec-26. We are not there yet. But a 2-3 months period with Brent crude averaging $55/b would probably do it.
Oil on water increased 17 mb over the week to Sunday while oil in transit increased by 23 mb. So less oil was standing still. More was moving.

Crude oil floating storage (stationary more than 7 days). Down 11 mb over week to Sunday

The lowest point of the Brent crude oil curve versus the 5yr contract. Weakest so far this year.

Crude oil 1mth to 3mth time-spreads. Dubai held out strongly through summer, but then that center of strength fell apart in late September and has been leading weakness in crude curves lower since then.

Rebounding along with most markets. But concerns over solidity of Gaza peace may also contribute. Brent crude fell 0.8% yesterday to $61.91/b and its lowest close since May this year. This morning it is bouncing up 0.9% to $62.5/b along with a softer USD amid positive sentiment with both equities and industrial metals moving higher. Concerns that the peace in Gaza may be less solid than what one might hope for also yields some support to Brent. Bets on tech stocks are rebounding, defying fears of trade war. Money moving back into markets. Gold continues upwards its strong trend and a softer dollar helps it higher today as well.
US crude & products probably rose 5.6 mb last week (API) versus a normal seasonal decline of 2.4 mb. The US API last night partial and thus indicative data for US oil inventories. Their data indicates that US crude stocks rose 7.4 mb last week, gasoline stocks rose 3.0 mb while Distillate stocks fell 4.8 mb. Altogether an increase in commercial crude and product stocks of 5.6 mb. Commercial US crude and product stocks normally decline by 2.4 mb this time of year. So seasonally adjusted the US inventories rose 8 mb last week according to the indicative numbers by the API. That is a lot. Also, the counter seasonal trend of rising stocks versus normally declining stocks this time of year looks on a solid pace of continuation. If the API is correct then total US crude and product stocks would stand 41 mb higher than one year ago and 6 mb higher than the 2015-19 average. And if we combine this with our knowledge of a sharp increase in production and exports by OPEC(+) and a large increase in oil at sea, then the current trend in US oil inventories looks set to continue. So higher stocks and lower crude oil prices until OPEC(+) switch to cuts. Actual US oil inventory data today at 18:00 CET.
US commercial crude and product stocks rising to 1293 mb in week 41 if last nights indicative numbers from API are correct.

Crude oil soon coming to a port near you. OPEC has lifted production sharply higher this autumn. At the same time demand for oil in the Middle-East has fallen as we have moved out of summer heat and crude oil burn for power for air-conditioning. The Middle-East oil producers have thus been able to lift exports higher on both accounts. Crude oil and condensates on water has shot up by 177 mb since mid-August. This oil is now on its way to ports around the world. And when they arrive, it will likely help to lift stocks onshore higher. That is probably when we will lose the last bit of front-end backwardation the the crude oil curves. That will help to drive the front-month Brent crude oil price down to the $60/b line and revisit the high $50ies/b. Then the eyes will be all back on OPEC+ when they meet in early November and then again in early December.
Crude oil and condensates at sea have moved straight up by 177 mb since mid-August as OPEC(+) has produced more, consumed less and exported more.


Sell the rally. Trump has become predictable in his unpredictability

Gruvbolaget Boliden överträffade analytikernas förväntningar

Australien och USA investerar 8,5 miljarder USD för försörjningskedja av kritiska mineraler
Brent crude set to dip its feet into the high $50ies/b this week

Vad guldets uppgång egentligen betyder för världen

OPEC+ missar produktionsmål, stöder oljepriserna

Goldman Sachs höjer prognosen för guld, tror priset når 4900 USD

Blykalla och amerikanska Oklo inleder ett samarbete

Guld nära 4000 USD och silver 50 USD, därför kan de fortsätta stiga

Leading Edge Materials är på rätt plats i rätt tid
-
 Nyheter4 veckor sedan
OPEC+ missar produktionsmål, stöder oljepriserna
-
 Nyheter2 veckor sedan
Goldman Sachs höjer prognosen för guld, tror priset når 4900 USD
-
 Nyheter3 veckor sedan
Blykalla och amerikanska Oklo inleder ett samarbete
-
 Nyheter3 veckor sedan
Guld nära 4000 USD och silver 50 USD, därför kan de fortsätta stiga
-
 Nyheter2 veckor sedan
Leading Edge Materials är på rätt plats i rätt tid
-

 Nyheter2 veckor sedan
Nytt prisrekord, guld stiger över 4000 USD
-

 Nyheter3 veckor sedan
Ett samtal om guld, olja, koppar och stål
-
Analys3 veckor sedan
OPEC+ will likely unwind 500 kb/d of voluntary quotas in October. But a full unwind of 1.5 mb/d in one go could be in the cards