

Analys
Kinafrossa inför 2018 – Råvaruplanket

![]() Kina och OPEC-feber 2017
Kina och OPEC-feber 2017
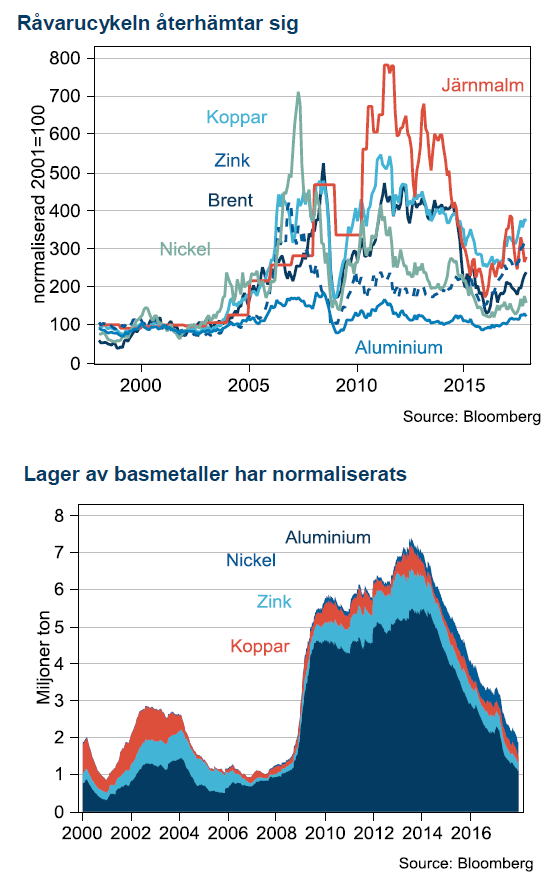
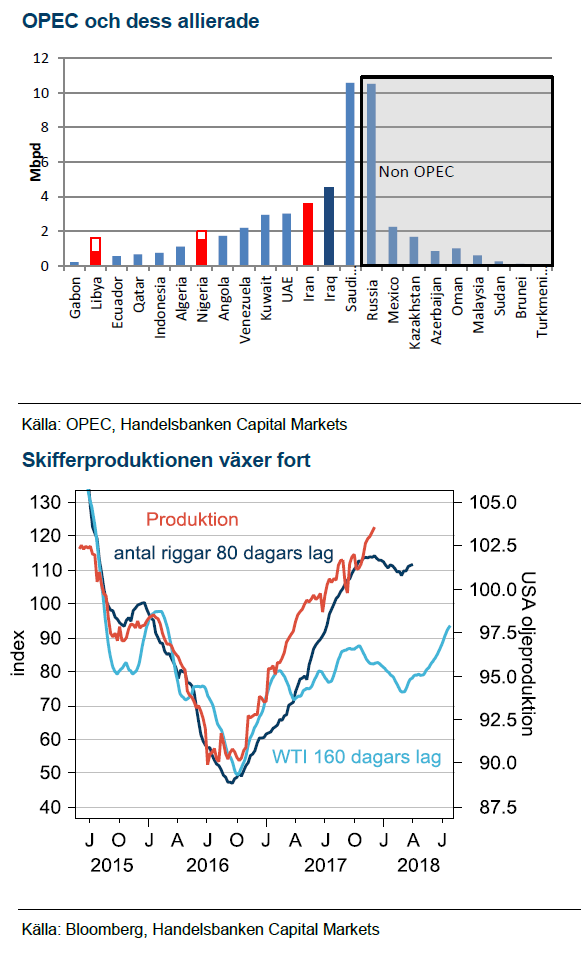
Råvarupriser har stigit markant under 2017, främst är det basmetallkomplexet som handlas omkring 20% högre sedan Kinas ekonomi utvecklats starkt i bakvattnet av 2015 och 16 års stimulanser. Oljepriset har också stigit, dock bara 8% över året men 35% sedan årets botten i juni. För olja har de fallande globala lagernivåerna varit avgörande, marknadens betydande överskott ser ut att var under avveckling och balans närmar sig. OPEC har fått hela äran och förlängningen av OPEC-avtalet hyllades av marknaden.
 Kinafrossa 2018
Vi tror att Kinas pågående produktionsreform kommer vara en mer långsiktig, strukturell förändring i råvarumarknaden än vad som initialt annonserats. Genom att minska på överproduktionen av vissa råvaror kan Kina slå två flugor i en smäll: lönsamheten stiger för de producenter som får vara kvar och luften blir bättre vilket gynnar alla.
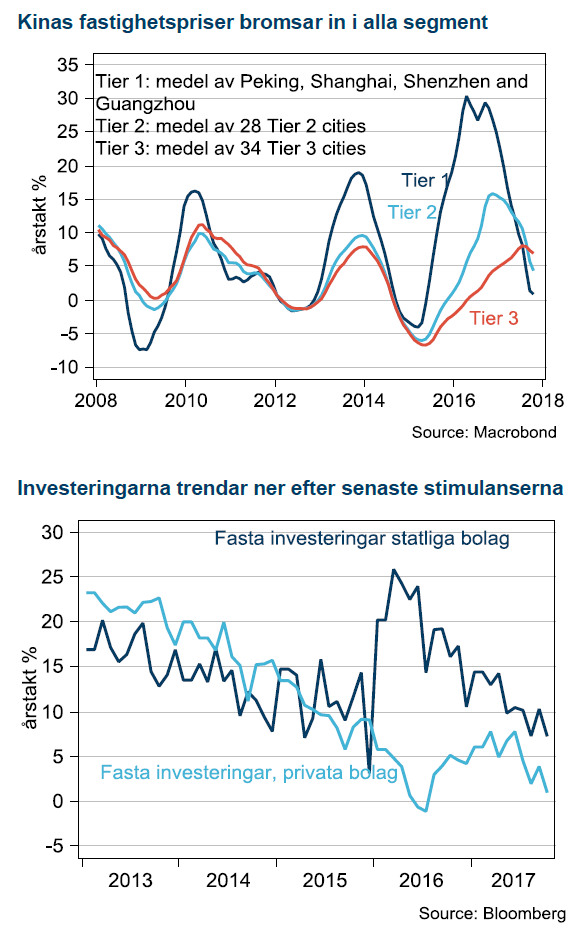
Trots det ser första halvåret 2018 kritiskt ut för Kina. Stimulansinjektionen har slutat verka, uppgången i bostadspriserna har stannat av i de stora städerna, investeringarna har minskat både från statliga och privata bolag. Mer stimulanser kommer säkert men först måste det blir sämre, vilket betyder att nästa stimulansvåg är att vänta tidigast andra halvåret 2018. Fram till dess ser vi risk för tillfällig dipp i basmetaller.
Motvind i öknen
Även oljepriset står inför en nedgång när säsongsmönstret för den påbörjade lagernedgången byter rikting och börjar stiga under första kvartalet. Skifferoljan står också inför ökad aktivitet när höstens högre oljepris slår igenom med början i fler riggar till fälten. Vi har ett oljepris på USD 51 för 2018.
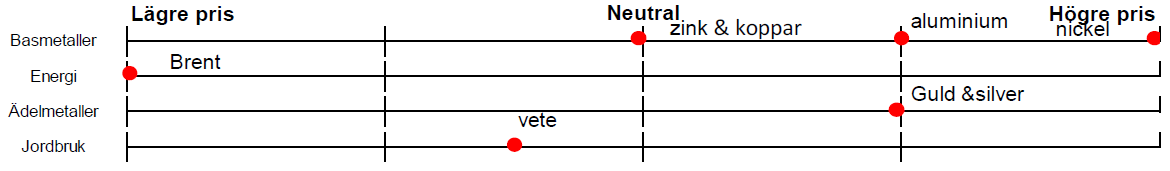
Vår syn för Q1-Q2 2018:
Basmetaller
 Striktare plan för luftföroreningar
Vi argumenterar för att när regeringen väl lyckats få en del av kapaciteten ur produktion så kommer den inte tillbaka. Det sammanfaller med regeringens långsiktiga mål att få bort olönsam småskalig produktion i miljöbelastande segment samtidigt som det gynnar de producenter som får vara kvar och säljer till högre pris.
Oron för Kina är makrobaserad och utbudsreformerna kommer sannolikt bara delvis hålla emot. Uppgången i fastighetspriserna har bromsat in, initialt kontrollerat, men nu växer oron för att de ska börja falla. Tillväxten i investeringar faller också efter snart två år utan stimulanser. Oron i investerarkollektivet växer då president Xi Jingping inte ”pratat upp” tillväxten, snarare motsatsen genom att säga att Kina prioriterar tillväxt av bättre kvalité.
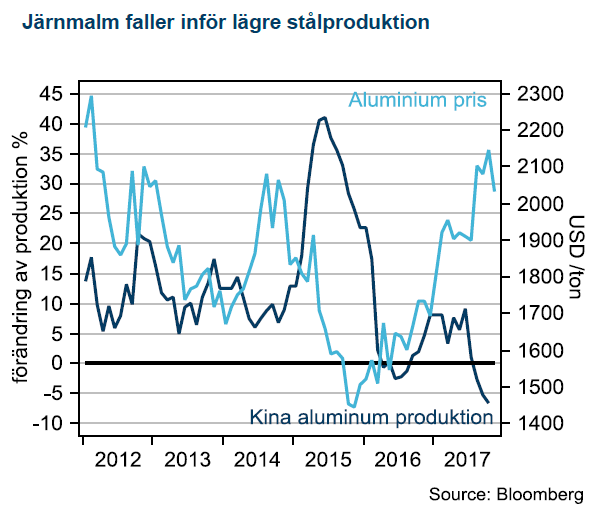
Aluminium gynnas av produktionsreformer
Aluminium är den basmetall som gynnas mest av omstrukturering i Kinas produktion likt den i stålindustrin. Det skulle innebära mindre produktion från de olönsamma verken under den kommande vintern. Vi har USD 2175 som medelprognos för 2018.
Zinkrallyt har planat ut
Även för zink finns det viss påverkan från nedstängningar i Kina men med zink över USD 3000 ser vi ökad risk från mer produktion till marknaden plus makrorisk från Kina på efterfrågan. Vi har USD 2960 som medelprognos 2018.
 Nickel – volatil men intressant
Bland metaller som både drabbas av Kinas stängningar och rider på elbilsrevolutionen finns en tydlig stjärna och det är nickel. Metallens höga volatilitet gör dock att det är en nervös exponering. Vi har USD 13000 som medelprognos 2018.
Koppar – stöd i cykeln men makroexponerad
Koppar är den basmetall där de senaste årens låga investeringar börjar göra sig påmind genom en allt tunnare projektpipeline. Tillsammans med en högre påverkan från utbudsstörningar tror vi att koppar, rent cykliskt kan få bättre stöd framöver. På den negativa sidan är koppar fortfarande den metall som har högst Kinaexponering och speciellt mot fastighetsmarknaden. Vi har USD 6325 som medelprognos 2018.
Energi
 Brent på tvåårshögsta
Sommarens amerikanska ”driving season” blev startskottet på höstens oljeprisuppgång. På grund av att USA är en så stor del av globala lager har även de globala fallit som konsekvens av USA:s driving season och ökade export. Trots det har inte lagernivåerna kommit ner till normala nivåer, som är OPEC:s mål i den nuvarande kampanjen. Dessutom har Venezuelas kaosartade finansiella situation och Kronprins MBS framfart under antikorruptionskampanjen adderat en ordentlig riskpremie i oljepriset.
Skifferoljan är vinnare
I vår modell, som tjänat oss väl sedan oljekollapsen 2014, kommer antalet riggar att öka framöver som effekt av oljepriset vände i juli. Oljepriset leder produktionen med omkring 160 dagar och antalet riggar i oljefälten leder produktionen med omkring 80 dagar. Båda dessa ledande indikatorer talat nu för att produktionen kommer stiga under H1 2018.
OPEC-avtalet en tom gest
Även om OPEC har överraskat både oss och marknaden med bättre genomförande av de avtalade produktionssänkningarna än historiskt så tycker vi allt för mycket av lagernedgången tillskrivs OPEC. Ryssland sänker från rekordhöga nivåer som referenspunkt och mycket av sänkningarna utanför Saudiarabien är mer att betrakta som passiva sänkningar än aktiva. De fallande lagren är också en säsongsfaktor som kommer jobba mot OPEC under första kvartalet och vi tror då att oljan handlas ner mot USD 50 igen.
Slutet på avtalet under 2018
Under nästa år kommer fokus på tiden efter OPEC-avtalet att växa: Ryssland har understrukit att man vill ut ur avtalet så fort marknaden är i balans. Vårt mer negativa makroscenario för Kina kommer också att underminera priset när efterfrågan där inte motsvara förväntningarna. Vårt huvudscenario för nästa år är att USA adderar omkring 10 riggar per vecka under första halvåret, OPEC tar ingen ny riktning vid nästa OPEC-möte den 22a juni. Vid OPEC mötet i nov/dec avslutas avtalet och vi tror Brentoljan handlas på USD 51/fat i medel. Den största risken för vårt scenario ser vi i en finansiell kollaps i Venezuela som spiller över på oljeproduktionen eller mer aktivt motstånd bland saudiske prins MBS rivaler.
Ädelmetaller
 Guldet väntar på Italien
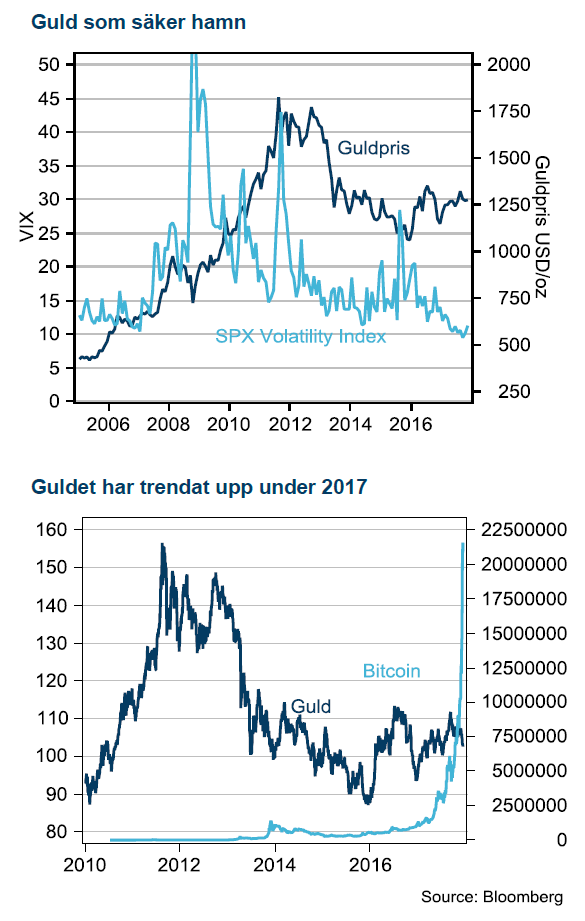
Guldpriset har stigit 8% i år och fått en mycket tydligare koppling till risk och oro. Största hickan på senare år kom 2016 under Brexitomröstningen men utan stöd av vidare oro i aktiemarknaden har guld fallit tillbaka igen. Nordkoreas vapenskrammel har också fått guld att stiga men senaste tiden har guld pressats av en allt starkare USD och fortsatt frammarsch med räntehöjningar från Fed. Nästa val i raden är Italien som ska vara klart senast i maj nästa år men konsensusbilden verkar vara att det kommer inträffa i april. Just nu verkar Italiensk politik vara utanför marknadens radar då Italiensk statistik varit relativt bra på senaste tiden. Vi ser dock en tydlig risk att italiensk, EU-fientlig politik blossar upp igen i början av nästa år.
Utkonkurrerad av Bitcoin
Under det senaste året har dock guld fått stark konkurrens av bitcoin som alternativ tillgång och motvikt till det etablerade monetära systemet. Bitcoins har stigit på ett vis som inte går att relatera till traditionella risktillgångar och tilltalar delvis en liknande publik som guldinvesterare.
Fed höjer vidare
USA tror vi har mindre betydelse för guld framöver. Fed har genomfört fem höjningar som passerat marknaden utan något problem. Trots Fed:s optimistiska syn på konjunkturen räknar vi med att de finansiella förhållandena försämras framöver. Vår prognos är att Fed slutar höja styrräntan 2018 efter höjning i mars och september, därefter drabbas USA av lågkonjunktur 2019. I det scenariot står guld kvar som en fast tillgång som investerare gillar.
Jordbruk
 Neutrala utsikter för vete
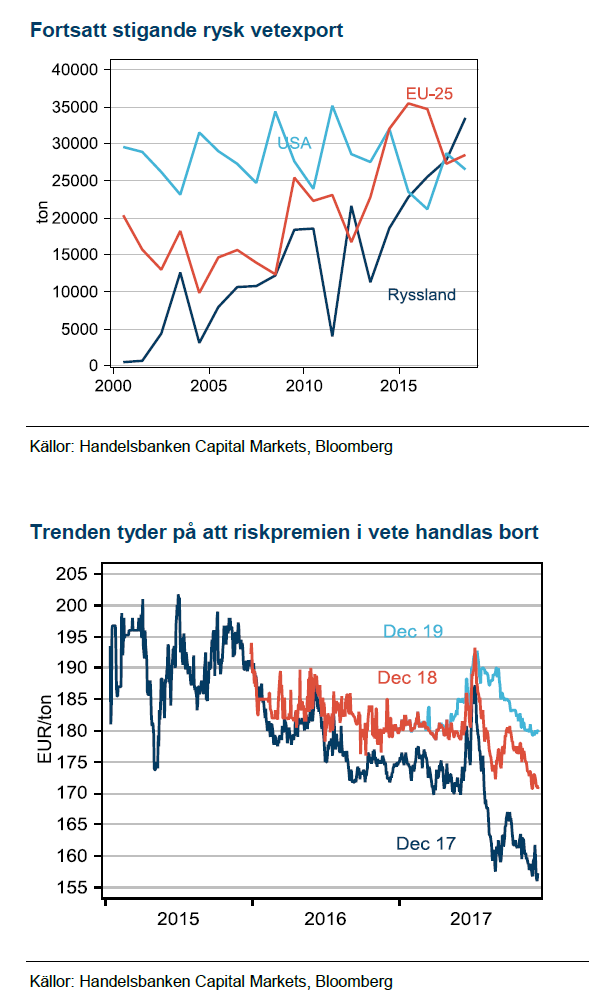
Under de senaste två åren har vi argumenterat för att riskerna inför skörd skapar en osäkerhet som driver riskpremien för högt och när skörden väl landat i lagerhusen pyser riskpremien ut igen. Temat upprepade sig och vi handlar nu väldigt nära vårt riktmärke för decemberterminen i intervallet mot 160-165 EUR/ton.
Ryssland fortsätter sätta press
Förra året blev Rysslands höga veteexport ett sänke för MATIF-priserna. Det blev en repris i år. Vi ser också en stor sannolikhet för en repris 2018. USA kommer visserligen minska arealen ytterligare med kanske 2-3% efter att ha minskat den med 8,5% i år. Ryssland kommer å andra sidan odla konstant areal och skicket på höstsådda vetet är bättre än vid samma tid förra året. Australiens avkastning blev i år 40% lägre, 1,69 ton/ha mot 2,5 normalt. Vi tror att den skörden kommer normaliseras och sammantaget talar därför utsikterna för 2018 för en repris där decemberterminen förfaller omkring 160 EUR/ton även 2018.
[box]Handelsbankens råvarukommentar är producerad av Handelsbanken och publiceras i samarbete och med tillstånd på Råvarumarknaden.se[/box]
Ansvarsbegränsning
Handelsbanken Capital Markets, som är en division inom Svenska Handelsbanken AB (publ) (i fortsättningen kallad ”SHB”), är ansvarig för sammanställningen av analysrapporter. I Sverige står SHB under tillsyn av Finansinspektionen, i Norge av norska Finansinspektionen, i Finland av finska Finansinspektionen och i Danmark av danska Finansinspektionen. Alla analysrapporter bygger på information från handels- och statistiktjänster och annan information som SHB bedömt vara tillförlitlig. SHB har emellertid inte själv verifierat informationen och kan inte garantera att informationen är sann, korrekt eller fullständig. I den mån lagen tillåter tar varken SHB, styrelseledamöter, tjänstemän eller medarbetare, eller någon annan person, ansvar för någon som helst förlust, oavsett om den uppstår till följd av användning av en analysrapport eller dess innehåll eller på annat sätt uppstår i anslutning till något i denna.


Down on Friday. Up on Monday. The Brent June crude oil contract traded down 5.1% last week to a close of $90.38/b. It reached a high of $103.87/b last Monday and a low of $86.09/b on Friday as Iran announced that the Strait of Hormuz was fully open for transit. That quickly changed over the weekend as the US upheld its blockade of Iranian oil exports while Iran naturally responded by closing the SoH again. The US blew a hole in the engine room of the Iranian ship TOUSKA and took custody of the ship on Sunday. Brent crude is up 5.6% this morning to $95.4/b.

The cease-fire is expiring tomorrow. The US has said it will send a delegation for a second round of negotiations in Islamabad in Pakistan. But Iran has for now rejected a second round of talks as it views US demands as unrealistic and excessive while the US is also blocking the Strait of Hormuz.
While Brent is up 5% this morning, the financial market is still very optimistic that progress will be made. That talks will continue and that the SoH will fully open by the start of May which is consistent with a rest-of-year average Brent crude oil price of around $90/b with the market now trading that balance at around $88/b.
Financial optimism vs. physical deterioration. We have a divergence where the financial market is trading negotiations, improvements and resolution while at the same time the physical market is deteriorating day by day. Physical oil flows remain constrained by disrupted flows, longer voyage times and elevated freight and insurance costs.
Financial markets are betting that a US/Iranian resolution will save us in time from violent shortages down the road. But every day that the SoH remains closed is bringing us closer to a potentially very painful point of shortages and much higher prices.
The US blockade is also a weapon of leverage against its European and Asian allies. When Iran closed the SoH it held the world economy as a hostage against the US. The US blockade of the SoH is of course blocking Iranian oil exports. But it is also an action of disruption directed towards Europe and Asia. The US has called for the rest of the world to engaged in the war with Iran: ”If you want oil from the Persian Gulf, then go and get it”. A risk is that the US plays brinkmanship with the global oil market directed towards its European and Asian allies and maybe even towards China to force them to engage and take part. Maybe unthinkable. But unthinkable has become the norm with Trump in the White House.
Wild moves yesterday. Brent crude traded to a high of $114.43/b and a low of $96.0/b and closed at $99.94/b yesterday.
US – Iran negotiations ongoing or not? What a day. Donald Trump announced that good talks were ongoing between Iran and the US and that the 48 hour deadline before bombing Iranian power plants and energy infrastructure was postponed by five days subject to success of ongoing meetings. Iranian media meanwhile stated that no meetings were ongoing at all.
Today we are scratching our heads trying to figure out what yesterday was all about.
Friends and family playing the market? Was it just Trump and his friends and family who were playing with oil and equity markets with $580m and $1.46bn in bets being placed by someone in oil and equity markets just 15 minutes before Trump’s announcement?
Was Trump pulling a TACO as he reached his political and economic pain point: Brent at $112/b, US Gas at $4/gal, SPX below 200dma and US 10yr above 4.4%?
Different Iranian factions with Trump talking with one of them? Are there real negotiations going on but with the US talking to one faction in Iran while another, the hardliners, are not involved and are denying any such negotiations going on?
Extending the ultimatum to attack and invade Kharg island next weekend? Or, is the five day delay of the deadline a tactical decision to allow US amphibious assault ships and marines to arrive in the Gulf in the upcoming weekend while US and Israeli continues to degrade Iranian military targets till then. And then next weekend a move by the US/Israel to attack and conquer for example the Kharg island?
We do not really know which it is or maybe a combination of these.
We did get some kind of TACO ydy. But markets have been waiting for some kind of TACO to happen and yesterday we got some kind of TACO. And Brent crude is now trading at $101.5/b as a result rather than at $112-114/b as it did no the high yesterday.
But what really matters in our view is the political situation on the ground in Iran. Will hardliners continue to hold power or will a more pragmatic faction gain power?
If the hardliners remain in power then oil pain should extend all the way to US midterm elections. The hardliners were apparently still in charge as of last week. Iran immediately retaliated and damaged LNG infrastructure in Qatar after Israel hit Iranian South Pars. The SoH was still closed and all messages coming out of Iran indicated defiance. Hardliners continues in power has a huge consequence for oil prices going forward. The regime has played its ’oil-weapon’ (closing or chocking the Strait of Hormuz). It is using it to achieve political goals. Deterrence: it needs to be so politically and economically expensive to attack Iran that it won’t happen again in the future. Or at least that the US/Israel thinks 10-times over before they attack again. The highest Brent crude oil closing price since the start of the war is $112.19/b last Friday. In comparison the 20-year inflation adjusted Brent price is $103/b. So Brent crude last Friday at $112.19/b isn’t a shockingly high price. And it is still far below the nominal high of $148/b from 2008 which is $220/b if inflation adjusted. So once in a lifetime Iran activates its most powerful weapon. The oil weapon. It needs to show the power of this weapon and it needs to reap political gains. Getting Brent to $112/b and intraday high of $119.5/b (9 March) isn’t a display of the power of that weapon. And it is not a deterrence against future attacks.
So if the hardliners remain in power in Iran, then the SoH will likely remain chocked all the way to US midterm elections and Brent crude will at a minimum go above the historical nominal high of $148/b from 2008.
Thus the outlook for the oil price for the rest of the year doesn’t depend all that much of whether Trump pulls a TACO or not. Stops bombing or not. It depends more on who is in charge in Iran. If it is the hardliners, then deterrence against future attacks via chocking of the SoH and high oil prices is the likely line of action. It is impacting the world but the Iranian ’oil-weapon’ is directed towards the US president and the the US midterm elections.
If a pragmatic faction gets to power in Iran, then a very prosperous future is possible. However, if power is shifting towards a more pragmatic faction in Iran then a completely different direction could evolve. Such a faction could possibly be open for cooperation with the US and the GCC and possibly put its issues versus Israel aside. Then the prosperity we have seen evolving in Dubai could be a possible future also for Iran.
So far it looks like the hardliners are fully in charge. As far as we can see, the hardliners are still fully in control in Iran. That points towards continued chocking of the SoH and oil prices ticking higher as global inventories (the oil market buffers) are drawn lower. And not just for a few more weeks, but possibly all the way to the US midterm elections.
A brief sigh of relief yesterday as oil infra at Kharg wasn’t damaged. But higher today. Brent crude dabbled around a bit yesterday in relief that oil infrastructure at Iran’s Kharg island wasn’t damaged. It traded briefly below the 100-line and in a range of $99.54 – 106.5/b. Its close was near the low at $100.21/b.
No easy victorious way out for Trump. So no end in sight yet. Brent is up 3.2% today to $103.4/b with no signs that the war will end anytime soon. Trump has no easy way to declare victory and mission accomplished as long as Iran is in full control of the Strait of Hormuz while also holding some 440 kg of uranium enriched to 60% and not far from weapons grade at 90%. As long as these two factors are unresolved it is difficult for Trump to pull out of the Middle East. Naturally he gets increasingly frustrated over the situation as the oil price and US retail gas prices keeps ticking higher while the US is tied into the mess in the Middle East. Trying to drag NATO members into his mess but not much luck there.
When commodity prices spike they spike 2x, 3x, 4x or 5x. Supply and demand for commodities are notoriously inflexible. When either of them shifts sharply, the the price can easily go to zero (April 2022) or multiply 2x, 3x, or even 5x of normal. Examples in case cobalt in 2025 where Kongo restricted supply and the price doubled. Global LNG in 2022 where the price went 5x normal for the full year average. Demand for tungsten in ammunition is up strongly along with full war in the middle east. And its price? Up 537%.
Why hasn’t the Brent crude oil price gone 2x, 3x, 4x or 5x versus its normal of $68/b given close to full stop in the flow of oil of the Strait of Hormuz? We are after all talking about close to 20% of global supply being disrupted. The reason is the buffers. It is fairly easy to store oil. Commercial operators only hold stocks for logistical variations. It is a lot of oil in commercial stocks, but that is predominantly because the whole oil system is so huge. In addition we have Strategic Petroleum Reserves (SPRs) of close to 2500 mb of crude and 1000 mb of oil products. The IEA last week decided to release 400 mb from global SPR. Equal to 20 days of full closure of the Strait of Hormuz. Thus oil in commercial stocks on land, commercial oil in transit at sea and release of oil from SPRs is currently buffering the situation.
But we are running the buffers down day by day. As a result we see gradually increasing stress here and there in the global oil market. Asia is feeling the pinch the most. It has very low self sufficiency of oil and most of the exports from the Gulf normally head to Asia. Availability of propane and butane many places in India (LPG) has dried up very quickly. Local prices have tripled as a result. Local availability of crude, bunker oil, fuel oil, jet fuel, naphtha and other oil products is quickly running down to critical levels many places in Asia with prices shooting up. Oman crude oil is marked at $153/b. Jet fuel in Singapore is marked at $191/b.
Oil at sea originating from Strait of Hormuz from before 28 Feb is rapidly emptied. Oil at sea is a large pool of commercial oil. An inventory of oil in constant move. If we assume that the average journey from the Persian Gulf to its destinations has a volume weighted average of 13.5 days then the amount of oil at sea originating from the Persian Gulf when the the US/Israel attacked on 28 Feb was 13.5 days * 20 mb/d = 269 mb. Since the strait closed, this oil has increasingly been delivered at its destinations. Those closest to the Strait, like Pakistan, felt the emptying of this supply chain the fastest. Propane prices shooting to 3x normal there already last week and restaurants serving cold food this week is a result of that. Some 50-60% of Asia’s imports of Naphtha normally originates from the Persian Gulf. So naphtha is a natural pain point for Asia. The Gulf also a large and important exporter of Jet fuel. That shut in has lifted jet prices above $200/b.
To simplify our calculations we assume that no oil has left the Strait since that date and that there is no increase in Saudi exports from Yanbu. Then the draining of this inventory at sea originated from the Persian Gulf will essentially look like this:
The supply chain of oil at sea originating from the Strait of Hormuz is soon empty. Except for oil allowed through the Strait of Hormuz by Iran and increased exports from Yanbu in the Red Sea. Not included here.

Oil at sea is falling fast as oil is delivered without any new refill in the Persian Gulf. Waivers for Russian crude is also shifting Russian crude to consumers. Brent crude will likely start to feel the pinch much more forcefully when oil at sea is drawn down another 200 mb to around 1000 mb. That is not much more than 10 days from here.

Oil and oil products are starting to become very pricy many places. Brent crude has still been shielded from spiking like the others.


Market Still Betting on Timely Resolution, But Each Day Raises Shortage Risk

Christian Kopfer om läget för oljan

Marknaden måste börja betrakta de höga kopparpriserna som det nya normala

Det fysiska spotpriset på brentolja har slagit nytt rekord

40 minuter med Javier Blas om hur världen verkligen påverkas av energikrisen
40 minuter med Javier Blas om hur världen verkligen påverkas av energikrisen

Elpriserna fördubblas, stor osäkerhet inför sommaren

MP Materials, USA:s svar på Kinas dominans över sällsynta jordartsmetaller
Det fysiska spotpriset på brentolja har slagit nytt rekord

Studsvik har idag ansökt om att få bygga 1200-1600 MW kärnkraft i Valdemarsvik
-
 Nyheter3 veckor sedan
40 minuter med Javier Blas om hur världen verkligen påverkas av energikrisen
-
 Nyheter4 veckor sedan
Elpriserna fördubblas, stor osäkerhet inför sommaren
-
 Nyheter4 veckor sedan
MP Materials, USA:s svar på Kinas dominans över sällsynta jordartsmetaller
-
 Nyheter2 veckor sedan
Det fysiska spotpriset på brentolja har slagit nytt rekord
-
 Nyheter4 veckor sedan
Studsvik har idag ansökt om att få bygga 1200-1600 MW kärnkraft i Valdemarsvik
-
 Nyheter2 veckor sedan
Marknaden måste börja betrakta de höga kopparpriserna som det nya normala
-
Analys4 veckor sedan
TACO (or Whatever It Was) Sends Oil Lower — Iran Keeps Choking Hormuz
-

 Nyheter4 veckor sedan
Matproduktion är beroende av gödsel, Gulfkriget skapar brist