

Analys
Handelsbanken Jordbruk, 22 augusti 2014

Skörd 2015
Spannmålspriserna har gått ned en hel del under det gångna året – en följd av globala rekordskördar på alla de tre stora grödorna vete, majs och sojabönor. Även 2013 var volymmässigt ett bra skördeår och 2014 blir andra året på raken med relativt stor lageruppbyggnad. Vete MATIF november 14 handlas i skrivande stund på EUR 171 (SEK 1.565) per ton – så sent som i april i år var samma kontrakt uppe på EUR 210 (SEK 1.985) per ton. Under 2013 handlades november 14-kontraktet stundtals ännu högre.
Vad vi upplever just nu är att lantbrukare som för nästa års skörd istället köper på termin (spekulerar i en prisuppgång och ökar sin risk) till antalet är klart fler än de lantbrukare som säljer på termin (skyddar sig mot ytterligare prisfall). Om det var djurproducenter som prissäkrade kommande foderinköp vore det mer förståeligt – men så är inte fallet, få av dessa har vaknat på samma sätt. Om denna riskvilja lönar sig vet ingen, främst bör det bero på huruvida väderproblem uteblir i världens större spannmålsregioner även under 2015 eller ej – om inte finns det skäl att tro att priserna kan pressas ytterligare nedåt.
Grafen nedan visar närmsta rullande termin på MATIF för de senaste tio åren – med tre väldigt tydliga pristoppar, intressant nog alla på nästan samma nivå.
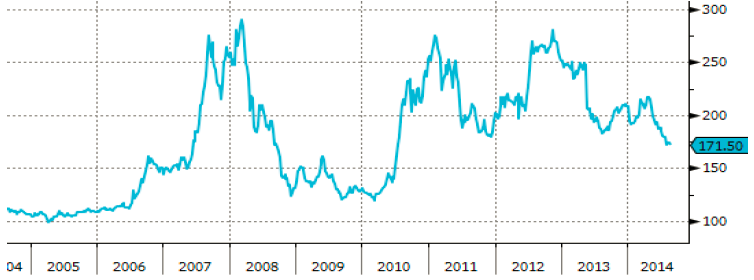
- 2006-07 ökade spannmålspriserna kraftigt som följd av minskad global produktion i kombination med ökad efterfrågan inte minst som energigröda.
- Efter att vete MATIF handlats ned mot EUR 120 per ton fick vi sommaren 2010 återigen en kraftig prisuppgång – värme och torka gjorde att ryska vetefält praktiskt taget brann upp, varpå Ryssland senare införde exportförbud av spannmål i syfte att dämpa inhemsk inflation.
- 2012 blev allt annat än problemfritt – Ryssland fick ännu lägre veteskörd än 2010, den amerikanska majsen upplevde den värsta torkan på över 50 år och jämfört med året innan föll produktionen i varierande grad i Europa, Australien och Sydamerika.
Kort sagt – vi har de senaste åren haft kraftiga prisuppgångar och även ett högt genomsnittspris men inte utan anledning.
Decemberterminen vete MATIF 2015 handlas just nu kring EUR 186 (SEK 1.705) per ton – en nivå som alltså verkar locka mer till köp än sälj även för producenter. Med ögonen på ovanstående vetegraf, med klart lägre nivåer bara för några få år sedan, kan det ses som förvånande att riskviljan är så stor. Märk väl att Handelsbankens vy inte är att priserna ska falla ytterligare, vi håller för tillfället en neutral vy i väntan på mer prognoser om höstsådden och potential för nästa års skörd men också i en tid av hög politisk oro där utfallet är svårt att sia om. Däremot är vi väldigt säkra på att risken för ytterligare prisfall åtminstone existerar.
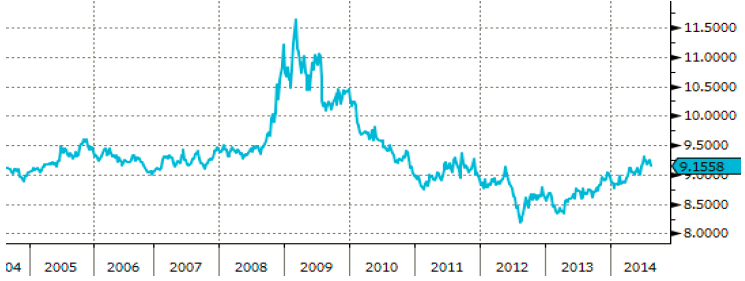
Vad man heller inte bör bortse från är att EUR/SEK under perioden med låga spannmålspriser kring 2009 stundtals handlades bra mycket högre än idag, se graf nedan. En svag svensk krona i förhållande till euron gynnar svenska spannmålspriser och givetvis tvärtom. Handelsbankens prognos för EUR/SEK under det fjärde kvartalet 2015 är 8,75 – ganska väl i linje med de europeiska storbankernas snittprognos. Faller dessa prognoser in bör det alltså pressa ned svenska inhemska spannmålspriser.
Det är bråda dagar för landets spannmålsbönder, årets skörd är långt ifrån klar på många håll i landet – tyvärr med stora nederbördsrelaterade problem i inte minst i Halland och Västergötland. Och efter skörd ska det sås. Ändock kan det finnas skäl att, om inte annat när regnet faller och tröskan står stilla, fundera på hur riskerna kring nästa års skörd ska hanteras. Är verkligen dessa EUR 186 (SEK 1.705) per ton för lågt för att sälja ens en liten del? Kanske är säljoptioner intressant i detta läge – med vilka ett skydd mot fallande priser ges samtidigt som möjlighet att ta del av eventuell uppsida finns kvar. På nästföljande sidor följer några exempel med säljoptioner vete MATIF september 2015 för den som är intresserad.
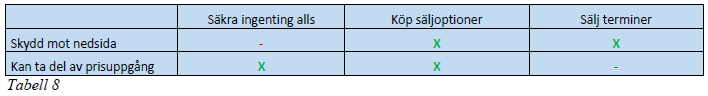
Säljoptioner ger ibland ett bättre utfall än terminer och ibland tvärtom. Då produktionsnivån inte är helt säker bör heller inte hela volymen prissäkras. En kombination av dessa tre val är kanske det rätta. En tredjedel i varje är ett möjligt alternativ – med då två tredjedelar skyddat mot prisfall och två tredjedelar med möjlighet till att ta del av prisuppgång.
Säljoptioner
En säljoption ger innehavaren en rättighet men inte en skyldighet att få sälja underliggande termin* till en viss förbestämd prisnivå (lösenpris) – vilket innebär att om terminspriset handlas över lösenpriset utnyttjar innehavaren inte sin säljoption och kan istället dra nytta av ett högre försäljningspris för fysisk vara. Ett köp av en option kommer aldrig kosta köparen mer än kostnaden för optionen, den s.k. premien.
*Vid affär med Handelsbanken hanterar banken försäljning och köp på börsen och betalar mellanskillnaden direkt till kund.
Följande visar exempel på möjligheter inför skörd 2015:
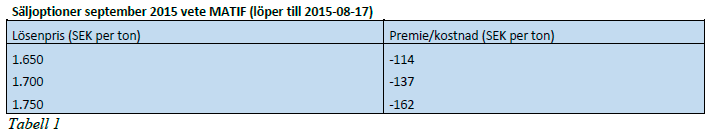
Lösenpriset kan köparen välja själv och kan således vara både högre och lägre än i ovanstående exempel. Som synes kommer premien variera efter valt lösenpris – en säljoption med ett högre lösenpris kostar mer än en säljoption med ett lägre lösenpris. Oavsett lösenpris finns inga fasta nivåer på premien utan dessa beräknas vid varje affärstillfälle då nivån på dessa även är beroende av främst löptid och volatiliteten på underliggande terminskontrakt. Löptiden är nu relativt lång, men allt annat lika blir alltså dessa optioner billigare med tiden.
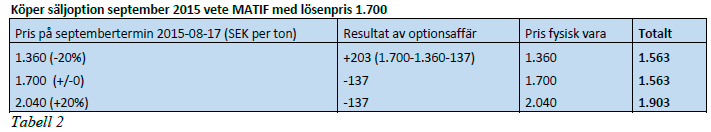
Antag att en lantbrukare köper den säljoption som i exemplet ovan har lösenpriset SEK 1.700 per ton och betalar premien SEK 137 per ton. Utfallet av denna affär om optionen behålls till förfallodatum blir då som följer utifrån några olika scenarion – vetepriset faller 20 procent, förblir oförändrat eller stiger 20 procent:
Vi antar i dessa exempel ett fysiskt vetepris som är exakt i nivå med terminspriset på MATIF.
Det kan tilläggas att köparen av en säljoption kan välja att sälja tillbaka optionen när som helst innan löptidens slut, alltså i detta fall innan den 17:e augusti.
Huruvida säljoptioner är ett mer attraktivt instrument att skydda sig mot ett prisfall än terminer finns det inget stående svar på, det varierar inte minst utifrån rådande prisnivå – dels på vetet och dels på prmien. I ovanstående utfall vore terminer en bättre lösning då priset föll och då priset var oförändrat – givetvis som följd av kostnaden för premien. Men när priset stiger kan en säljoption alltså bli ett klart mer fördelaktigt val, utan av ge avkall på skydd mot nedsida.
Om lantbrukaren tycker att premien i ovanstående exempel är dyr kan en option med ett lägre lösenpris väljas. Nedanstående tabell visar utfallet med samma tre scenarion som ovan om säljoptionen med lösenpriset SEK 1.650 per ton valts:
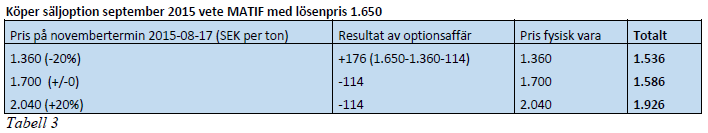
Som vi ser blev resultatet här något bättre i de fall då priset förblev oförändrat eller steg – som följd av att premien i detta fall var lägre med SEK 114 mot SEK 137. Dock var inte skyddet mot ett prisfall lika starkt, p.g.a. ett lägre lösenpris, och utfallet då priset föll blev alltså sämre.
Fördelen med att istället välja ett högre lösenpris är att skyddet mot nedsidan blir starkare – dock till en högre kostnad. Nedanstående tabell visar utfallet för den dyraste av säljoptionerna av de tre alternativen i tabell 1, den med lösenpriset SEK 1.750 per ton.
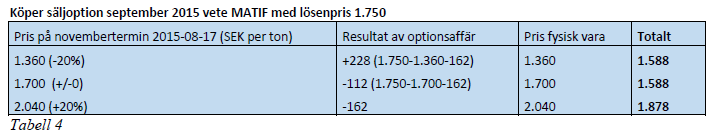
Som synes gav ett högre lösenpris med tillhörande högre premie ett bättre resultat när priset föll på bekostnad av en mer begränsad uppsida.
[box]Handelsbanken Jordbruk är producerat av Handelsbanken och publiceras i samarbete och med tillstånd på Råvarumarknaden.se[/box]
Ansvarsbegränsning
Detta material är producerat av Svenska Handelsbanken AB (publ) i fortsättningen kallad Handelsbanken. De som arbetar med innehållet är inte analytiker och materialet är inte oberoende investeringsanalys. Innehållet är uteslutande avsett för kunder i Sverige. Syftet är att ge en allmän information till Handelsbankens kunder och utgör inte ett personligt investeringsråd eller en personlig rekommendation. Informationen ska inte ensamt utgöra underlag för investeringsbeslut. Kunder bör inhämta råd från sina rådgivare och basera sina investeringsbeslut utifrån egen erfarenhet.
Informationen i materialet kan ändras och också avvika från de åsikter som uttrycks i oberoende investeringsanalyser från Handelsbanken. Informationen grundar sig på allmänt tillgänglig information och är hämtad från källor som bedöms som tillförlitliga, men riktigheten kan inte garanteras och informationen kan vara ofullständig eller nedkortad. Ingen del av förslaget får reproduceras eller distribueras till någon annan person utan att Handelsbanken dessförinnan lämnat sitt skriftliga medgivande. Handelsbanken ansvarar inte för att materialet används på ett sätt som strider mot förbudet mot vidarebefordran eller offentliggörs i strid med bankens regler.


Market is starting to take US/Iran headlines with a pinch of salt. Brent crude rose $2.8/b yesterday to an official close of $112.1/b. But after that it traded as low as $108.05/b before ending late night at around $109.7/b. Through the day it traded in a range of $106.87 – 112.72/b amid a flurry of news or rumors from Iran and the US. ”US temporary sanctions during negotiations” (falls alarm). ”We will bomb Iran” (not anyhow),… etc. While the market is still fluctuating to this kind of news flow, it is starting to take such headlines with a pinch of salt.

We’ll see. Maybe, maybe not. The Brent M1 contract is trading at $110.2/b this morning which very close to the average ticks through yesterday of $110.4/b.
Trump with bearish, verbal intervention whenever Brent trades above $110/b it seems. What seems to be a pattern is that Trump states something like ”very good negotiations going on with Iran”, ”New leaders in Iran are great,..”, ”Great progress in negotiations,…”, ”Deal in sight,..” etc whenever the Brent M1 contract trades above $110/b. An effort to cool the market. These hot air verbal interventions from Trump used to have a heavy bearish impact on prices, but they now seems to have less and less effect unless they are backed by reality.
As far as we can see there has been no real progress in the negotiations between the US and Iran with both sides still standing by their previous demands.
Iran is getting stronger while the cease fire lasts making a return to war for Trump yet harder. Iran is naturally in constant preparation for a return to war given Trump’s steady threats of bombing Iran again. Iran is naturally doing what ever is possible to prepare for a return to war. And every day the cease fire lasts it is better prepared. This naturally makes it more and more difficult and dangerous for the US to return to warring activity versus Iran as the consequences for energy infrastructure in the Persian Gulf will be more and more severe the longer the cease fire lasts. Israel seems to see it this way as well. That the war is not won and that current frozen state of a cease fire gives Iran opportunity to rebuild military and politically.
Global inventories are drawing down day by day. How much? In the meantime the Strait of Hormuz stays closed. There is varying measures and estimates of how much global inventories are drawing down. Our rough estimate, back of the envelope, is that global inventories are drawing down by at least some 10 mb/d or about 300 mb/d in a balance between loss of supply versus demand destruction. Other estimates we see are a monthly draw of 250-270 mb/d. The IEA only ’measured’ a draw in global observable stocks of 117 mb in April with oil on water rising 53 mb while on shore stocks fell 170 mb. But global stocks are hard to measure with large invisible, unmeasured stocks. As such a back of the envelope approach may be better.
Oil products is what the world is consuming. Oil product prices likely to rise while product stocks fall. Strategic Petroleum Reserves (SPR) are predominantly crude oil. Discharging oil from OECD SPR stocks, a sharp reduction in Chinese crude imports and a reduction in global refinery throughput of 6-7 mb/d has helped to keep crude oil markets satisfactorily supplied. But global inventories are drawing down none the less. And oil products is really what the world is consuming. So if global refinery throughput stays subdued, then demand will eventually have to match the supply of oil products. The likely path forward this summer is a steady draw down in jet fuel, diesel and gasoline. Higher prices for these. Then, if possible, higher refinery throughput and higher usage of crude in response to very profitable refinery margins. And lastly sharper draw in crude stocks and higher prices for these. But some 6 mb/d of oil products used to be exported through the Strait of Hormuz. And it may not be so easy to ramp up refinery activity across the world to compensate. Especially as Ukraine continues to damage Russian refineries as well as Russian crude production and export facilities.
Watch oil product stocks and prices as well as Brent calendar 2027. What to watch for this summer is thus oil product inventories falling and oil product premiums to crude rising. Another measure to watch is the Brent crude 2027 contract as it rises steadily day by day as the Strait of Hormuz stays closed and global oil inventories decline. The latter is close to the highest level since the start of the war and keeps rising.
The Brent M1 contract and the Brent 2027 prices and current price of jet fuel in Europe (ARA). All in USD/b

Our back of the envelope calculation of the global shortage created by the closure of the Strait of Hormuz. Note that 3.5 mb/d of discharge from SPR is also a draw. Note also that ’Forced demand loss’ of 2.5 mb/d is probably temporary and will fall back towards zero as logistics are sorted out leaving ’Price demand loss’ to do the job of balancing the market. Thus a shortfall of at least 9 mb/d created by the closure. More if SPR discharge is included and more if Forced demand loss recedes.

Brent is climbing higher. Front-month is at USD 106.3/bl this morning, close to a weekly high and a USD 9/bl jump from Mondays open. This is the move we flagged as a risk earlier in the week: the market shifting from ”a deal is around the corner” to ”this is going to take longer than we thought”.

Analyst Commodities, SEB
During April, rest-of-year Brent remained remarkably stable around USD 90/bl. A stability which rested on one single assumption: the SoH reopens around 1 May. That assumption is now slowly falling apart.
As we highlighted yesterday: every week of delay beyond 1 May adds (theoretically) ish USD 5/bl to the rest-of-year average, as global inventories draw 100 million barrels per week. i.e., a mid-May reopening implies rest-of-year Brent closer to USD 100/bl, and anything pushing into June or July takes us meaningfully higher.
What’s changed in the last 48 hours:
#1: The US military has formally warned that clearing suspected sea mines from SoH could take up to six months. That is a completely different timescale from what the financial market is pricing. Even a political deal tomorrow does not immediately reopen the strait.
#2: Trump has shifted his tone from urgency to ”strategic patience”. In yesterday’s press conference: ”Don’t rush me… I want a great deal.” The market is reading this as a president no longer feeling pressured by timelines, with the naval blockade running in the background.
#3: So far, the military activity is escalating, not de-escalating. Axios reports Iran is laying more mines in SoH. The US 3rd carrier strike group (USS George H.W. Bush) is arriving with two countermine vessels. Trump yesterday ordered the US Navy to destroy any Iranian boats caught laying mines. While CNN reports that the Pentagon is actively drawing up plans to strike Iranian SoH capabilities and individual Iranian military leaders if the ceasefire collapses. i.e., NOT a attitude consistent with an imminent deal!
Spot crude and product prices eased off the early-April highs on a combination of system rerouting and deal optimism. Both now weakening. Goldman estimates April Gulf output is reduced by 14.5 mbl/d, or 57% of pre-war supply, a number that keeps getting worse the longer this drags on.
Demand-side adaptation is ongoing: S. Korea has cut its Middle East crude dependence from 69% to 56% by pulling more from the Americas and Africa, and Japan is kicking off a second round of SPR releases from 1 May. But SPRs are finite.
Ref. to the negotiations, we should not bet on speed. The current Iranian leadership is dominated by genuine hardliners willing to absorb economic pain and run the clock to extract concessions. That is not a setup for a rapid resolution. US/Israeli media briefings keep framing the delay as ”internal Iranian divisions”, the reality is more complicated and points toward weeks and months, not days.
Our point is that the complexity is large, and higher prices have only just started (given a scenario where the negotiations drag out in time). The market spent April leaning on the USD 90/bl rest-of-year assumption; that case is diminishing by the hour. If ”early May reopening” is replaced by ”June, July or later” over the next week or two, both crude and products have meaningful room to reprice higher from here. There is a high risk being short energy and betting on any immediate political resolution(!).
Down on Friday. Up on Monday. The Brent June crude oil contract traded down 5.1% last week to a close of $90.38/b. It reached a high of $103.87/b last Monday and a low of $86.09/b on Friday as Iran announced that the Strait of Hormuz was fully open for transit. That quickly changed over the weekend as the US upheld its blockade of Iranian oil exports while Iran naturally responded by closing the SoH again. The US blew a hole in the engine room of the Iranian ship TOUSKA and took custody of the ship on Sunday. Brent crude is up 5.6% this morning to $95.4/b.
The cease-fire is expiring tomorrow. The US has said it will send a delegation for a second round of negotiations in Islamabad in Pakistan. But Iran has for now rejected a second round of talks as it views US demands as unrealistic and excessive while the US is also blocking the Strait of Hormuz.
While Brent is up 5% this morning, the financial market is still very optimistic that progress will be made. That talks will continue and that the SoH will fully open by the start of May which is consistent with a rest-of-year average Brent crude oil price of around $90/b with the market now trading that balance at around $88/b.
Financial optimism vs. physical deterioration. We have a divergence where the financial market is trading negotiations, improvements and resolution while at the same time the physical market is deteriorating day by day. Physical oil flows remain constrained by disrupted flows, longer voyage times and elevated freight and insurance costs.
Financial markets are betting that a US/Iranian resolution will save us in time from violent shortages down the road. But every day that the SoH remains closed is bringing us closer to a potentially very painful point of shortages and much higher prices.
The US blockade is also a weapon of leverage against its European and Asian allies. When Iran closed the SoH it held the world economy as a hostage against the US. The US blockade of the SoH is of course blocking Iranian oil exports. But it is also an action of disruption directed towards Europe and Asia. The US has called for the rest of the world to engaged in the war with Iran: ”If you want oil from the Persian Gulf, then go and get it”. A risk is that the US plays brinkmanship with the global oil market directed towards its European and Asian allies and maybe even towards China to force them to engage and take part. Maybe unthinkable. But unthinkable has become the norm with Trump in the White House.


Sommarväder skapar prisrally på elbörsen
Oil product price pain is set to rise as the Strait of Hormuz stays closed into summer

Solkraften pressar elpriserna dagtid

Michel Gubel ger sin syn på oljemarknaden