

Analys
Extremely tight platinum and palladium markets
 The South African platinum mining industry has been affected by strikes for more than ten weeks now. Because stocks are dwindling, the mining companies concerned are finding it increasingly difficult to fulfil their contractual delivery obligations. The situation as regards palladium is dominated by concerns about how Russia might react if the West were to impose further-reaching sanctions on the country. At the same time, demand on both markets is robust, driven by the automotive industry. The situation appears to be tightening noticeably, which in our opinion suggests that platinum and palladium prices will rise.
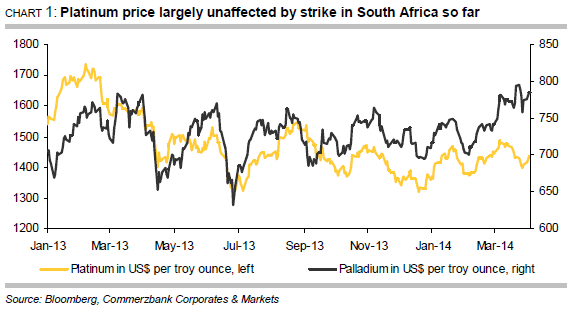
 Platinum came under pressure from the weak gold price in March and declined noticeably as a result. For a time it dropped below the $1,400 per troy ounce mark to a six-week low. Palladium fared somewhat better and trended sideways while fluctuating significantly. For the first time since August 2011, it actually exceeded the $800 per troy ounce mark for a while, though it was unable to maintain this level (Chart 1). We believe that both precious metal prices are too low from a fundamental viewpoint given the risks to supply. In this Commodity Spotlight we will be assessing the supply situation in South Africa, the world’s biggest platinum producer and the world’s number two palladium producer, as well as taking a look at Russia, the biggest supplier of palladium.
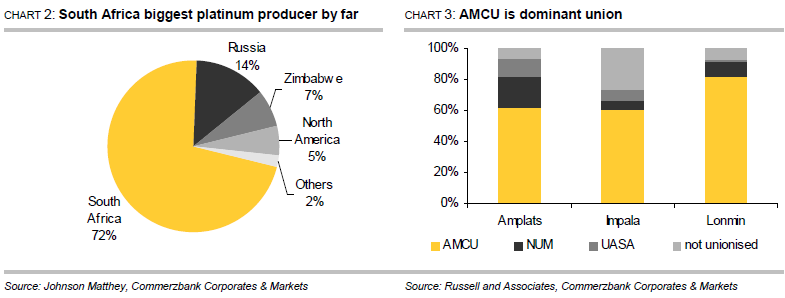
According to figures from Johnson Matthey, South Africa produced 4.12 million ounces of platinum and 2.35 million ounces of palladium last year, thus accounting for 72% of global platinum mining production and 37% of global palladium mining production (Chart 2). Palladium is generally mined together with platinum. However, a strike has been underway in the South African platinum mining industry since 23 January. The radical AMCU (Association of Mineworkers and Construction Union) called its members out on strike to lend emphasis to its calls for wage hikes. The union, which was established in 1998 and formally registered in 2001, represents the majority of workers in the platinum mining industry and has meanwhile overtaken the more moderate union NUM (National Union of Mineworkers) in terms of membership. The world’s three biggest platinum producers are affected: Anglo American Platinum, Impala Platinum and Lonmin, 87% of whose workers are union members. Accounting for 66% of these, the AMCU predominates (Chart 3). Over 70,000 workers went out on strike when called upon to do so. The strike is the biggest to hit the South African mining sector since the Apartheid regime ended in 1994. 350,000 workers took to the streets in 1987 to protest for better working conditions, though this strike was brought to an end after around three weeks and cost the mining companies around ZAR 250 million at the time, according to the NUM.
Union and companies still far apart
The AMCU is calling for producers to increase wages significantly, its core demand being that entry-level salaries be doubled to ZAR 12,500 per month. Originally, the AMCU urged the mining companies to meet its demands immediately, though it has meanwhile shown itself willing to “make some concessions”. AMCU has “eased” its core demand in two stages, with the result that it now wishes to see wages doubled within four years. For their part, the companies have offered staggered wage increases over the course of three years – 9% in the first year, 8% in the second and 7.5% in the third. In February, the rate of inflation in South Africa was 5.9%. In other words, the two parties still maintain positions that are very far apart. To date, the state mediator engaged to help (CCMA – Commission for Conciliation, Mediation and Arbitration) has failed to bring the two parties any closer together. In fact, talks were actually suspended for a time because the mediator saw no possibility of agreement.
Politicians exercise restraint ahead of elections
So far, politicians have chosen not to intervene in the strike, clearly because of the upcoming elections in South Africa. Parliamentary elections will be held on 7 May, with presidential elections to follow in the second half of the year. The mine workers make up a major group of voters which neither the governing party ANC (African National Congress) nor the opposition parties wish to alienate. Polls indicate that the ANC is likely to win the elections, though it remains to be seen whether this will subsequently result in the necessary reforms being implemented which would also steer the mining industry into calmer waters. Recently, the South African finance minister played down the strike’s negative impact on the local economy, claiming that the current strike is causing less damage than the industrial actions taken two years ago. In 2012, a series of strikes cost gold and platinum producers more than ZAR 16 billion.
High revenue losses for companies and lost earnings for workers
By their own account, the mining companies concerned are losing 9,900 ounces of platinum production every day – 4,000 ounces at Anglo American Platinum, 2,800 ounces at Impala Platinum and 3,100 ounces at Lonmin. Assuming that work generally continues in the mines seven days a week, the producers have thus lost nearly 700,000 ounces of production since the beginning of the strike. The companies claim that they have lost revenues totalling over ZAR 11 billion as a result. So far, workers who are not being paid while they are out on strike have lost earnings of around ZAR 5 billion.
Company stocks dwindling
Although production has been at a standstill since the beginning of the strike, the companies have been able at least partly to fulfil their delivery obligations by drawing on stocks. By their own account, the producers had piled up considerable stocks in the run-up to the strike, which industrial sources estimated would last two months. The situation is not the same in all the companies, however. Anglo American Platinum had for example announced at the end of March that it had used up half of its 430,000 ounces of stocks up to that point, saying that material would be bought on the market if stocks ran out. By contrast, Impala Platinum had already declared “force majeure” in early March and has no longer been able to guarantee deliveries since the beginning of April. Impala is likewise considering buying in material on the market in order to meet its contractual obligations. Lonmin had also downwardly revised its sales forecasts for this year at an early stage.
Negative long-term impact cannot be excluded
Even if the strike can be brought to an end, it will take weeks if not months before platinum production achieves its pre-strike levels again. After all, the damage in shafts and galleries resulting from the lack of use first has to be identified and, most importantly of all, safety has to be restored. In some cases the companies are already talking about irreparable damage and are considering shutting down individual shafts entirely. There are also likely to be some redundancies because the companies claim that they will otherwise no longer be able to operate at a profit. This could spark renewed protests and set in motion a vicious circle which would harm the entire country.
Concers about supply outages in Russia
As far as palladium is concerned, we need to take a look at Russia. According to data from Johnson Matthey, Russia accounted for 42% of worldwide palladium supply in 2013 (primary production and reserve sales together totalling 2.7 million ounces) and for 14% of global platinum production (780,000 ounces), making the country the largest producer of palladium and the second-largest producer of platinum. The situation here is dominated by concerns about the extent to which possible sanctions imposed by the West on Russia could hit this sector and how Russia might react to further-reaching sanctions against its economy. That said, there are no signs so far that deliveries from Russia are at risk. According to the UK’s Financial Times, however, Norilsk Nickel, the world’s largest palladium producer, is currently negotiating longterm palladium and platinum supply contracts with Chinese and Japanese buyers. Although this might not mean anything, it could perhaps be viewed as a not particularly subtle hint to the West.
Robust demand from the automotive industry
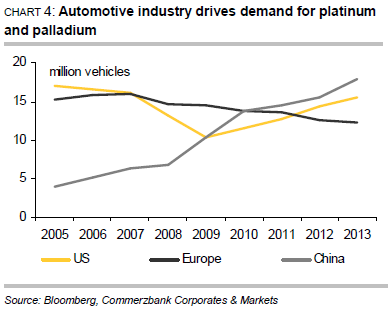 Driven by the automotive industry, demand for both platinum and palladium is robust. March saw the seasonally adjusted annualized vehicle sales rate in the US rise to 16.33 million units, the highest figure since May 2007. At 3.16 million units, car sales in China in January and February combined were a good 11% up on the same period last year. It would therefore seem that the 2014 target of an increase in sales of up to 10%, set by the China Association of Automobile Manufacturers, is achievable. The European auto industry may also have bottomed out, for car sales in February increased year-on-year for the sixth consecutive month (Chart 4).
New palladium ETF on the market
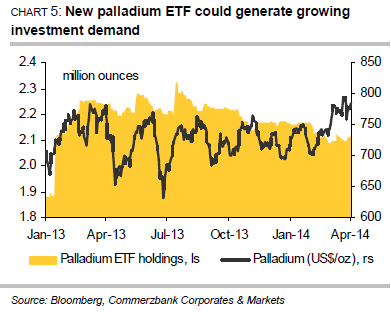 When it comes to investment demand, market participants evidently switched their allegiance from palladium to platinum in the first quarter. While the palladium ETFs tracked by Bloomberg recorded outflows of 51,900 ounces, the platinum ETFs saw inflows of 53,600 ounces. That said, the trend could soon be reversed in the case of palladium (Chart 5), for South African investment bank Absa Capital launched its long-awaited palladium ETF at the end of March. The ETF is listed on the Johannesburg Stock Exchange and solely sourced with palladium from South Africa. If the palladium ETF follows the same course as Absa Capital’s platinum ETF, which was launched at the end of April 2013, a great deal of supply could be stripped from the market. Within just four months of its launch, the platinum ETF became the world’s biggest platinum ETF and at the end of March had a market share of 37% with over 952,000 ounces. Holdings in all platinum ETFs combined are equivalent to more than five months of global mining production, while holdings in palladium ETFs equate to nearly four months of global production.
Higher prices expected during the course of the year
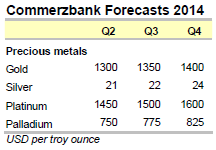
In our opinion, risks to supply in conjunction with robust demand point to higher platinum and palladium prices. According to data from Johnson Matthey, the supply-demand situation was already tight on both markets last year, the global platinum market showing a supply deficit of 605,000 ounces in 2013 and demand outstripping supply on the global palladium market by 740,000 ounces. Assuming the supply problems are not resolved in the near future and demand remains robust, the situation on both markets will doubtless tighten further. By year’s end we continue to envisage a platinum price of $1,600 per troy ounce, while palladium is likely to be trading at $825 per troy ounce.


Hesitant today. Brent jumped to an intraday high of $66.36/b yesterday after having touched an intraday low of $60.07/b on Monday as Indian and Chinese buyers cancelled some Russian oil purchases and instead redirected their purchases towards the Middle East due to the news US sanctions. Brent is falling back 0.4% this morning to $65.8/b.

It’s our strong view that the only sensible thing is to sell this rally. In all Trump’s unpredictability he has become increasingly predictable. Again and again he has rumbled about how he is going to be tough on Putin. Punish Putin if he won’t agree to peace in Ukraine. Recent rumbling was about the Tomahawk rockets which Trump threatened on 10 October and 12 October to sell/send to Ukraine. Then on 17 October he said that ”the U.S. didn’t want to give away weapons (Tomahawks) it needs”.
All of Trump’s threats towards Putin have been hot air. So far Trump’s threats have been all hot air and threats which later have evaporated after ”great talks with Putin”. After all these repetitions it is very hard to believe that this time will be any different. The new sanctions won’t take effect before 21. November. Trump has already said that: ”he was hoping that these new sanctions would be very short-lived in any case”. Come 21. November these new sanctions will either evaporate like all the other threats Trump has thrown at Putin before fading them. Or the sanctions will be postponed by another 4 weeks or 8 weeks with the appearance that Trump is even more angry with Putin. But so far Trump has done nothing that hurt Putin/Russia. We can’t imagine that this will be different. The only way forward in our view for a propre lasting peace in Ukraine is to turn Ukraine into defensive porcupine equipped with a stinging tail if need be.
China will likely stand up to Trump if new sanctions really materialize on 21 Nov. Just one country has really stood up to Trump in his tariff trade war this year: China. China has come of age and strength. I will no longer be bullied. Trump upped tariffs. China responded in kind. Trump cut China off from high-end computer chips. China put on the breaks on rare earth metals. China won’t be bullied any more and it has the power to stand up. Some Chinese state-owned companies like Sinopec have cancelled some of their Russian purchases. But China’s Foreign Ministry spokesperson Guo Jiakun has stated that China “oppose unilateral sanctions which lack a basis in international law and authorization of the UN Security Council”. Thus no one, not even the US shall unilaterally dictate China from whom they can buy oil or not. This is yet another opportunity for China to show its new strength and stand up to Trump in a show of force. Exactly how China choses to play this remains to be seen. But China won’t be bullied by over something as important as its oil purchases. So best guess here is that China will defy Trump on this. But probably China won’t need to make a bid deal over this. Firstly because these new sanctions will either evaporate as all the other threats or be postponed once we get to 21 November. Secondly because the sanctions are explicit towards US persons and companies but only ”may” be enforced versus non-US entities.
Sanctions is not a reduction in global supply of oil. Just some added layer of friction. Anyhow, the new sanctions won’t reduce the supply of Russian crude oil to the market. It will only increase the friction in the market with yet more need for the shadow fleet and ship to ship transfer of Russian oil to dodge the sanctions. If they materialize at all.
The jump in crude oil prices is probably due to redirections of crude purchases to the Mid-East and not because all speculators are now turned bullish. Has oil rallied because all speculators now suddenly have turned bullish? We don’t think so. Brent crude has probably jumped because some Indian and Chinese oil purchasers of have redirected their purchases from Russia towards the Mid-East just in case the sanctions really materializes on 21 November.
Parts of the Brent crude curve dipping into the high $50ies/b. Brent crude fell 2.3% over the week to Friday. It closed the week at $61.29/b, a slight gain on the day, but also traded to a low of $60.14/b that same day and just barely avoided trading into the $50ies/b. This morning it is risk-on in equities which seems to help industrial metals a little higher. But no such luck for oil. It is down 0.8% at $60.8/b. This week looks set for Brent crude to dip its feet in the $50ies/b. The Brent 3mth contract actually traded into the high $50ies/b on Friday.
The front-end backwardation has been on a weakening foot and is now about to fully disappear. The lowest point of the crude oil curve has also moved steadily lower and lower and its discount to the 5yr contract is now $6.8/b. A solid contango. The Brent 3mth contract did actually dip into the $50ies/b intraday on Friday when it traded to a low point of $59.93/b.
More weakness to come as lots of oil at sea comes to ports. Mid-East OPEC countries have boosted exports along with lower post summer consumption and higher production. The result is highly visibly in oil at sea which increased by 17 mb to 1,311 mb over the week to Sunday. Up 185 mb since mid-August. On its way to discharge at a port somewhere over the coming month or two.
Don’t forget that the oil market path ahead is all down to OPEC+. Remember that what is playing out in the oil market now is all by design by OPEC+. The group has decided that the unwind of the voluntary cuts is what it wants to do. In a combination of meeting demand from consumers as well as taking back market share. But we need to remember that how this plays out going forward is all at the mercy of what OPEC+ decides to do. It will halt the unwinding at some point. It will revert to cuts instead of unwind at some point.
A few months with Brent at $55/b and 40-50 US shale oil rigs kicked out may be what is needed. We think OPEC+ needs to see the exit of another 40-50 drilling rigs in the US shale oil patches to set US shale oil production on a path to of a 1 mb/d year on year decline Dec-25 to Dec-26. We are not there yet. But a 2-3 months period with Brent crude averaging $55/b would probably do it.
Oil on water increased 17 mb over the week to Sunday while oil in transit increased by 23 mb. So less oil was standing still. More was moving.

Crude oil floating storage (stationary more than 7 days). Down 11 mb over week to Sunday

The lowest point of the Brent crude oil curve versus the 5yr contract. Weakest so far this year.

Crude oil 1mth to 3mth time-spreads. Dubai held out strongly through summer, but then that center of strength fell apart in late September and has been leading weakness in crude curves lower since then.

Rebounding along with most markets. But concerns over solidity of Gaza peace may also contribute. Brent crude fell 0.8% yesterday to $61.91/b and its lowest close since May this year. This morning it is bouncing up 0.9% to $62.5/b along with a softer USD amid positive sentiment with both equities and industrial metals moving higher. Concerns that the peace in Gaza may be less solid than what one might hope for also yields some support to Brent. Bets on tech stocks are rebounding, defying fears of trade war. Money moving back into markets. Gold continues upwards its strong trend and a softer dollar helps it higher today as well.
US crude & products probably rose 5.6 mb last week (API) versus a normal seasonal decline of 2.4 mb. The US API last night partial and thus indicative data for US oil inventories. Their data indicates that US crude stocks rose 7.4 mb last week, gasoline stocks rose 3.0 mb while Distillate stocks fell 4.8 mb. Altogether an increase in commercial crude and product stocks of 5.6 mb. Commercial US crude and product stocks normally decline by 2.4 mb this time of year. So seasonally adjusted the US inventories rose 8 mb last week according to the indicative numbers by the API. That is a lot. Also, the counter seasonal trend of rising stocks versus normally declining stocks this time of year looks on a solid pace of continuation. If the API is correct then total US crude and product stocks would stand 41 mb higher than one year ago and 6 mb higher than the 2015-19 average. And if we combine this with our knowledge of a sharp increase in production and exports by OPEC(+) and a large increase in oil at sea, then the current trend in US oil inventories looks set to continue. So higher stocks and lower crude oil prices until OPEC(+) switch to cuts. Actual US oil inventory data today at 18:00 CET.
US commercial crude and product stocks rising to 1293 mb in week 41 if last nights indicative numbers from API are correct.

Crude oil soon coming to a port near you. OPEC has lifted production sharply higher this autumn. At the same time demand for oil in the Middle-East has fallen as we have moved out of summer heat and crude oil burn for power for air-conditioning. The Middle-East oil producers have thus been able to lift exports higher on both accounts. Crude oil and condensates on water has shot up by 177 mb since mid-August. This oil is now on its way to ports around the world. And when they arrive, it will likely help to lift stocks onshore higher. That is probably when we will lose the last bit of front-end backwardation the the crude oil curves. That will help to drive the front-month Brent crude oil price down to the $60/b line and revisit the high $50ies/b. Then the eyes will be all back on OPEC+ when they meet in early November and then again in early December.
Crude oil and condensates at sea have moved straight up by 177 mb since mid-August as OPEC(+) has produced more, consumed less and exported more.


Sell the rally. Trump has become predictable in his unpredictability

Gruvbolaget Boliden överträffade analytikernas förväntningar

Australien och USA investerar 8,5 miljarder USD för försörjningskedja av kritiska mineraler
Brent crude set to dip its feet into the high $50ies/b this week

Vad guldets uppgång egentligen betyder för världen

OPEC+ missar produktionsmål, stöder oljepriserna

Goldman Sachs höjer prognosen för guld, tror priset når 4900 USD

Blykalla och amerikanska Oklo inleder ett samarbete

Guld nära 4000 USD och silver 50 USD, därför kan de fortsätta stiga

Leading Edge Materials är på rätt plats i rätt tid
-
 Nyheter4 veckor sedan
OPEC+ missar produktionsmål, stöder oljepriserna
-
 Nyheter2 veckor sedan
Goldman Sachs höjer prognosen för guld, tror priset når 4900 USD
-
 Nyheter3 veckor sedan
Blykalla och amerikanska Oklo inleder ett samarbete
-
 Nyheter3 veckor sedan
Guld nära 4000 USD och silver 50 USD, därför kan de fortsätta stiga
-
 Nyheter2 veckor sedan
Leading Edge Materials är på rätt plats i rätt tid
-

 Nyheter2 veckor sedan
Nytt prisrekord, guld stiger över 4000 USD
-

 Nyheter3 veckor sedan
Ett samtal om guld, olja, koppar och stål
-
Analys3 veckor sedan
OPEC+ will likely unwind 500 kb/d of voluntary quotas in October. But a full unwind of 1.5 mb/d in one go could be in the cards