

Analys
Orange juice: Will Brazil make up for the decline in US supply?
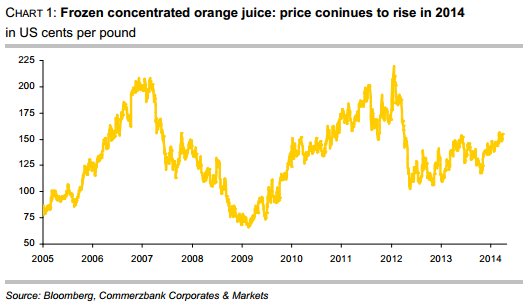
 The plant disease citrus greening and the aridity in important growing regions currently determine the price movements also on the market for frozen concentrated orange juice. In the US, production of oranges and orange juice is expected to decline massively. The US Department of Agriculture (USDA) is optimistic that this can be more than offset through production growth in Brazil and other countries. But the drought in Brazil and further reductions in US orange crop estimates for 2013/14 have caused prices for frozen orange juice concentrate to rise back to levels seen in early summer of last year
In March, the New York Board of Trade price for frozen concentrated orange juice returned to levels of over 150 US cents per pound that were seen in early summer 2013. In October, prices had temporarily dipped below 120 US cents per pound. The fact that prices have increased again is mainly attributable to the drought in Brazil that raised doubts as to whether an increasing Brazilian production could really offset the losses in the US.
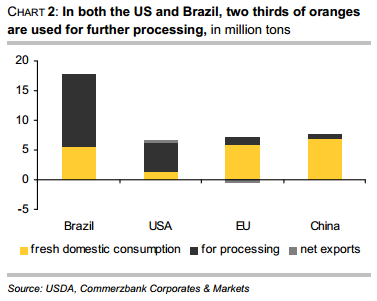
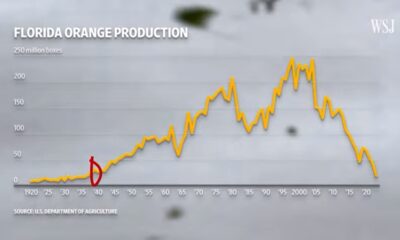
The USDA has repeatedly made it clear that in the USA declining supply of oranges and orange juice has to be expected for the 2013/14 season. In the US, orange production is concentrated in only two states. Some 70% of oranges originate from Florida, while everything else – except for a negligible rest – comes from California. For this reason the USDA’s announcement that this year production in Florida will probably fall to the lowest level since 1990 has moved the market. A 15% drop on last year is expected. The main reason is that the bug-transmitted disease citrus greening has caused considerable damage to trees. This disease prevents sufficient nutrient uptake and thus stunts the growth of the fruit, causing it to drop prematurely. This season in Florida, the loss rate from droppage should be the highest in 50 years. Since the development of new plantations is expensive and the young trees have to be grown in a greenhouse to prevent infection, the orange plantation acreage in Florida has fallen to the lowest levels since records began in 1978. In Florida, the orange harvest is traditionally used almost completely for processing into juice. In California, the share of oranges for direct consumption is higher. But since this year the citrus greening will probably make a lot of fruit unsuitable for direct consumption, the share of juice processing will likely be higher than usual this year (chart 2).
 In the US, the downward trend in production therefore probably continues: The USDA’s latest forecast from January expects a drop by 11% for both orange and orange juice production. Besides the citrus greening, the aridity in the US plays a role here: Whilst in the winter months the US Drought Monitor rated 28% of Florida as abnormally dry, moisture conditions are now classified as nearly 100% normal. Not so in California, where about half of the acreage is currently affected by extreme drought and another fourth suffers from an exceptional drought.
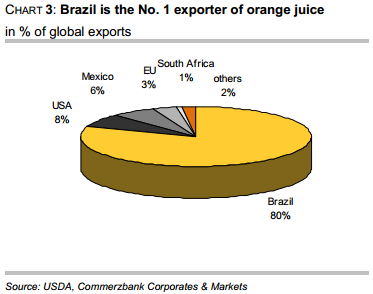
With regard to global production, the USDA is more optimistic: In January, it estimated that orange production in Brazil would rise by 8.5% in the coming harvest from May onwards due to bigger fruits. While the USDA counts this harvest for the 2013/14 season, in Brazil it is already counted as the crop of 2014/15. The production of orange juice is seen to increase even more strongly (18%) in the USDA report, as the yield from pressing is improved. But these impressive growth rates should not make us forget that in the previous season both orange production and orange juice production fell significantly, by 20% and 23%, respectively. Already in 2011/12, production had decreased. The orange acreage has been reduced in Brazil in the last few years – the world’s biggest orange producer by far with a share of more than one third and no. 1 exporter of orange juice (chart 3) – as many growers shifted to products such as soybeans, corn or sugar cane. Whether the effects of the drought on production in Brazil makes USDA forecast unrealistic, is still unclear.
 Due to favourable weather, a whopping 12% increase in orange production is expected in the EU, which would mean a return roughly to 2008/09 levels after years of a steady decline. Juice production is seen to increase at an equally quick pace. The EU is also the biggest importer of orange juice, with a large part of its imports coming from Brazil and the US, whereas South Africa and Egypt are the most important sources for fresh fruit.
In China, production of orange juice shall also continue rising, with the level expected to quadruple compared to 2010/11. But since demand likewise continues to grow, the country still has to rely on imports. About half of the consumed quantity must be imported. But this corresponds to only 0.5% of the globally traded quantity of orange juice. China is still a negligible client compared to the EU, which accounts for half of the total import volume and imports eleven times as much as China.
Compared to the previous season, the increase in oranges as well as orange juice in Brazil and several other countries is expected to more than offset the considerable decrease in the US, and so the USDA reckons with a global growth of 5% in orange production and of 6% in orange juice production.
In recent years, the per-capita consumption of orange juice in the US has declined considerably as many consumers prefer beverages with lower sugar contents. In the EU, the biggest consumer of orange juice, consumption is also considerably lower now than it was only a few years ago. Since these two regions account for two thirds of global orange juice consumption, prospects are rather cloudy on the demand side.
However: The unsolved problems with the citrus greening and concerns about the consequences of the drought in Brazil should support orange juice prices for the time being.


The latest weekly report from the US DOE showed a substantial drawdown across key petroleum categories, adding more upside potential to the fundamental picture.

Commercial crude inventories (excl. SPR) fell by 5.8 million barrels, bringing total inventories down to 415.1 million barrels. Now sitting 11% below the five-year seasonal norm and placed in the lowest 2015-2022 range (see picture below).
Product inventories also tightened further last week. Gasoline inventories declined by 2.1 million barrels, with reductions seen in both finished gasoline and blending components. Current gasoline levels are about 3% below the five-year average for this time of year.
Among products, the most notable move came in diesel, where inventories dropped by almost 4.1 million barrels, deepening the deficit to around 20% below seasonal norms – continuing to underscore the persistent supply tightness in diesel markets.
The only area of inventory growth was in propane/propylene, which posted a significant 5.1-million-barrel build and now stands 9% above the five-year average.
Total commercial petroleum inventories (crude plus refined products) declined by 4.2 million barrels on the week, reinforcing the overall tightening of US crude and products.


A classic case of “buy the rumor, sell the news” played out in oil markets, as Brent crude has dropped sharply – down nearly USD 10 per barrel since yesterday evening – following Iran’s retaliatory strike on a U.S. air base in Qatar. The immediate reaction was: “That was it?” The strike followed a carefully calibrated, non-escalatory playbook, avoiding direct threats to energy infrastructure or disruption of shipping through the Strait of Hormuz – thus calming worst-case fears.
After Monday morning’s sharp spike to USD 81.4 per barrel, triggered by the U.S. bombing of Iranian nuclear facilities, oil prices drifted sideways in anticipation of a potential Iranian response. That response came with advance warning and caused limited physical damage. Early this morning, both the U.S. President and Iranian state media announced a ceasefire, effectively placing a lid on the immediate conflict risk – at least for now.
As a result, Brent crude has now fallen by a total of USD 12 from Monday’s peak, currently trading around USD 69 per barrel.
Looking beyond geopolitics, the market will now shift its focus to the upcoming OPEC+ meeting in early July. Saudi Arabia’s decision to increase output earlier this year – despite falling prices – has drawn renewed attention considering recent developments. Some suggest this was a response to U.S. pressure to offset potential Iranian supply losses.
However, consensus is that the move was driven more by internal OPEC+ dynamics. After years of curbing production to support prices, Riyadh had grown frustrated with quota-busting by several members (notably Kazakhstan). With Saudi Arabia cutting up to 2 million barrels per day – roughly 2% of global supply – returns were diminishing, and the risk of losing market share was rising. The production increase is widely seen as an effort to reassert leadership and restore discipline within the group.
That said, the FT recently stated that, the Saudis remain wary of past missteps. In 2018, Riyadh ramped up output at Trump’s request ahead of Iran sanctions, only to see prices collapse when the U.S. granted broad waivers – triggering oversupply. Officials have reportedly made it clear they don’t intend to repeat that mistake.
The recent visit by President Trump to Saudi Arabia, which included agreements on AI, defense, and nuclear cooperation, suggests a broader strategic alignment. This has fueled speculation about a quiet “pump-for-politics” deal behind recent production moves.
Looking ahead, oil prices have now retraced the entire rally sparked by the June 13 Israel–Iran escalation. This retreat provides more political and policy space for both the U.S. and Saudi Arabia. Specifically, it makes it easier for Riyadh to scale back its three recent production hikes of 411,000 barrels each, potentially returning to more moderate increases of 137,000 barrels for August and September.
In short: with no major loss of Iranian supply to the market, OPEC+ – led by Saudi Arabia – no longer needs to compensate for a disruption that hasn’t materialized, especially not to please the U.S. at the cost of its own market strategy. As the Saudis themselves have signaled, they are unlikely to repeat previous mistakes.
Conclusion: With Brent now in the high USD 60s, buying oil looks fundamentally justified. The geopolitical premium has deflated, but tensions between Israel and Iran remain unresolved – and the risk of missteps and renewed escalation still lingers. In fact, even this morning, reports have emerged of renewed missile fire despite the declared “truce.” The path forward may be calmer – but it is far from stable.
Analys
A muted price reaction. Market looks relaxed, but it is still on edge waiting for what Iran will do
Brent crossed the 80-line this morning but quickly fell back assigning limited probability for Iran choosing to close the Strait of Hormuz. Brent traded in a range of USD 70.56 – 79.04/b last week as the market fluctuated between ”Iran wants a deal” and ”US is about to attack Iran”. At the end of the week though, Donald Trump managed to convince markets (and probably also Iran) that he would make a decision within two weeks. I.e. no imminent attack. Previously when when he has talked about ”making a decision within two weeks” he has often ended up doing nothing in the end. The oil market relaxed as a result and the week ended at USD 77.01/b which is just USD 6/b above the year to date average of USD 71/b.

Brent jumped to USD 81.4/b this morning, the highest since mid-January, but then quickly fell back to a current price of USD 78.2/b which is only up 1.5% versus the close on Friday. As such the market is pricing a fairly low probability that Iran will actually close the Strait of Hormuz. Probably because it will hurt Iranian oil exports as well as the global oil market.
It was however all smoke and mirrors. Deception. The US attacked Iran on Saturday. The attack involved 125 warplanes, submarines and surface warships and 14 bunker buster bombs were dropped on Iranian nuclear sites including Fordow, Natanz and Isfahan. In response the Iranian Parliament voted in support of closing the Strait of Hormuz where some 17 mb of crude and products is transported to the global market every day plus significant volumes of LNG. This is however merely an advise to the Supreme leader Ayatollah Ali Khamenei and the Supreme National Security Council which sits with the final and actual decision.
No supply of oil is lost yet. It is about the risk of Iran closing the Strait of Hormuz or not. So far not a single drop of oil supply has been lost to the global market. The price at the moment is all about the assessed risk of loss of supply. Will Iran choose to choke of the Strait of Hormuz or not? That is the big question. It would be painful for US consumers, for Donald Trump’s voter base, for the global economy but also for Iran and its population which relies on oil exports and income from selling oil out of that Strait as well. As such it is not a no-brainer choice for Iran to close the Strait for oil exports. And looking at the il price this morning it is clear that the oil market doesn’t assign a very high probability of it happening. It is however probably well within the capability of Iran to close the Strait off with rockets, mines, air-drones and possibly sea-drones. Just look at how Ukraine has been able to control and damage the Russian Black Sea fleet.
What to do about the highly enriched uranium which has gone missing? While the US and Israel can celebrate their destruction of Iranian nuclear facilities they are also scratching their heads over what to do with the lost Iranian nuclear material. Iran had 408 kg of highly enriched uranium (IAEA). Almost weapons grade. Enough for some 10 nuclear warheads. It seems to have been transported out of Fordow before the attack this weekend.
The market is still on edge. USD 80-something/b seems sensible while we wait. The oil market reaction to this weekend’s events is very muted so far. The market is still on edge awaiting what Iran will do. Because Iran will do something. But what and when? An oil price of 80-something seems like a sensible level until something do happen.


USA ska införa 50 procent tull på koppar

Ryska staten siktar på att konfiskera en av landets största guldproducenter

Hur säkrar vi Sveriges tillgång till kritiska metaller och mineral i en ny geopolitisk verklighet?

Lundin Mining ska bli en av de tio största kopparproducenterna i världen

Sommarvädret styr elpriset i Sverige

Uppgången i oljepriset planade ut under helgen

Mahvie Minerals växlar spår – satsar fullt ut på guld

Låga elpriser i sommar – men mellersta Sverige får en ökning

Oljan, guldet och marknadens oroande tystnad
Very relaxed at USD 75/b. Risk barometer will likely fluctuate to higher levels with Brent into the 80ies or higher coming 2-3 weeks
-
 Nyheter4 veckor sedan
Uppgången i oljepriset planade ut under helgen
-
 Nyheter3 veckor sedan
Mahvie Minerals växlar spår – satsar fullt ut på guld
-
 Nyheter4 veckor sedan
Låga elpriser i sommar – men mellersta Sverige får en ökning
-
 Nyheter2 veckor sedan
Oljan, guldet och marknadens oroande tystnad
-
Analys4 veckor sedan
Very relaxed at USD 75/b. Risk barometer will likely fluctuate to higher levels with Brent into the 80ies or higher coming 2-3 weeks
-

 Nyheter2 veckor sedan
Jonas Lindvall är tillbaka med ett nytt oljebolag, Perthro, som ska börsnoteras
-
Analys3 veckor sedan
A muted price reaction. Market looks relaxed, but it is still on edge waiting for what Iran will do
-

 Nyheter2 veckor sedan
Domstolen ger klartecken till Lappland Guldprospektering