

Analys
Elpriset – Hur ser situation ut för nästkommande kvartal?

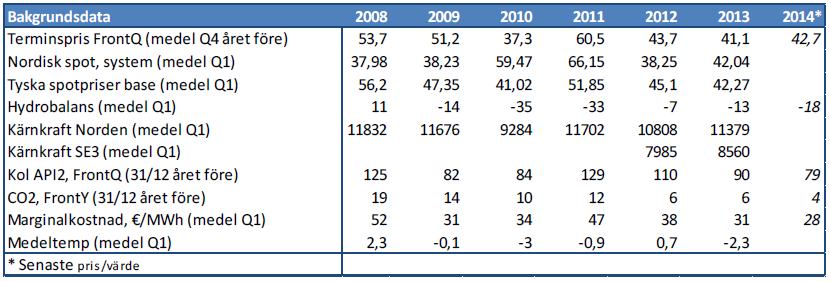
Bakgrundsdata
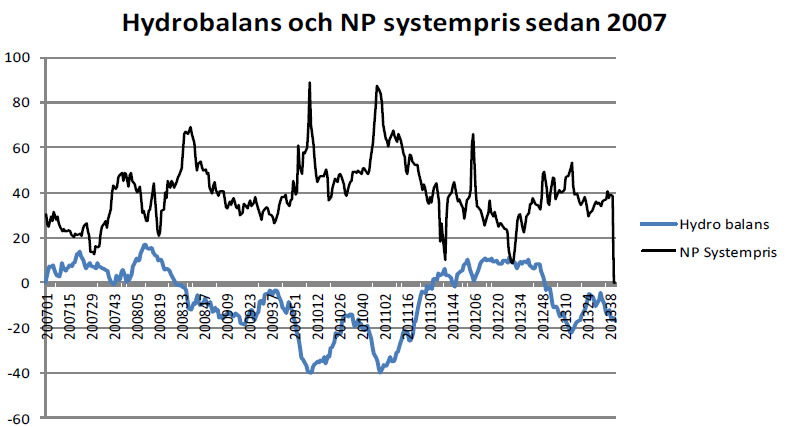
Dagens situation och hydrobalans
Vi har idag en hydrobalans (inkl. 10 dagars prognos) på ca -18 TWh. Skulle vi utgå från att hydrobalansen blir ca -15 TWh under Q1-14 så har vi två år bakom oss att titta på: 2009 och 2013. Båda dessa år var marginalkostnaden för kol något högre än prognoserna visar idag; ca €31/MWh mot dagens ca €28/MWh. Vi borde alltså, fundamentalt med dessa traditionella faktorer i bakgrunden, få något lägre priser i Q1-14 än vi hade under dessa två år. Terminspriset ligger idag dock ca €5/MWh högre än utfallet i Q1-09 och ca €1/MWh högre än utfallet i Q1-13. Vi hade under dessa år en mycket hög tillgänglighet på kärnkraft så för att det här ska stämma så måste också kärnkrafttillgängligheten ligga runt 90% under första kvartalet 2014. Vi har haft en del strul med kärnkraftkraften och nu har vi en tillgänglighet på drygt 80%, vi bör dock vara uppe i 90% när Ringhals 3 kommer in till november. Detta är dock en osäkerhet som bör speglas i priset vilket gör att det är rimligt att vi ligger lika eller till och med någon euro över utfallet Q1-09 , alltså som vi gör idag.
Om hydrobalansen försämras…
Sedan är det dock så att de senaste 5 åren så har hydroläget försämrats sedan v.44 hösten innan till kvartal 1 året efter, de flesta år med mellan 10-20 TWh. Trenden pekar alltså på att vi skulle få ett försämrat hydrologiskt läge till Q1-14. Detta skulle isåfall betyda att det finns fog för betydligt högre priser under Q1-14 än om vi tittar endast på nuvarande situation.
Skulle vi, efter en torr höst och start på vinter, landa på en hydrologisk balans runt -35 TWh under Q1-14 så hamnar vi i samma läge som vi hade år 2010 och 2011. Dessa år hade vi en marginalkostnad för kol på €34/MWh respektive €47/MWh, alltså betydligt högre än dagens €28/MWh. 2010 är väl isåfall det år som liknar nuvarande situation bäst då vi hade ett kolpris på ungefär samma nivå som idag men ett CO2 pris på ca €12/MWh. Detta år trodde man i oktober på ett spotpris under Q1 på ca €37/MWh men det blev hela €59,5/MWh! Tyskland (base) landade dock ca €18/MWh under vårt nordiska spotpris. Med vårt dåliga hydrologiska läge fick vi alltså importera kraft till tyska peaknivåer.
Sammanfattningsvis kan man alltså säga att Q1-14 verkar rimligt prissatt idag om det hydrologiska läget stannar på ca -15 TWh men att det finns en betydande uppsida om hydrologin försämras mot -30 TWh. Flera analytiker menar dessutom att vi kan räkna med att priserna i Tyskland under fler timmar än tidigare kan gå upp till marginalkostnaden för gas (ca €50-55/MWh och upp till €70/MWh för kortsiktig uppstart) då den är mer lättreglerad än kol vilket behövs när inte den förnybara kraften räcker till. Generellt så ser vi att spotpriserna i allt större utsträckning påverkas av sol- och vindförhållanderna på kontinenten. Vi har också frågan om CO2 där normalt €1/t uppgång i priset på utsläppsrätter påverkar det nordiska elpriset med ca €0,8/MWh.
Hur ser då utsikterna ut?
Så hur ser det nu ut, vad är sannolikheten för att vi ska få en torr fortsättning på hösten och början på vintern? Lutar det åt en kall eller mild vinter? Kan vi se ökade CO2 priser redan innan årsskiftet? Det är naturligtvis omöjligt att sia om vädret så här tidigt men Georg Müller, meteorolog på Thomson Reuters Point Carbon, och flera med honom menar att vi nog kan få se en relativt mild och våt november medan december och januari troligen kommer bli mer åt det kalla och torra hållet. Vi ser inga tecken på en uppgång i bränslepriser under de närmaste två kvartalen och kärnkraftprognserna pekar på ca 90% tillgänglighet under vintern. Hur mycket vind och sol vi kommer se i Tyskland är tyvärr mycket svårt att ha en prognos på för så lång sikt. När det gäller CO2 så räknar man med att få ett beslut kring ”back-loading” av utsläppsrätter i slutet av året och det verkar i nuläget bli ett positivt utslag vilket troligen kommer få priserna att stiga ett par euro, alltså även här är risken på uppsidan. Vi räknar dock inte med något mer klargörande kring en mer långsiktig lösning på de låga CO2 priserna denna sida av årsskiftet.
Risker på nedsidan
Riskerna på nedsidan är att det blir en betydligt våtare höst/start på vinter än väntat och att hydroläget då förbättras till runt normalen. Då kan vi se lägre terminspriser på Q1-14, ev. ner till runt €40/MWh nivån. Trots att vi, när vi fundamentalt jämför oss med tidigare år, borde kunna ligga ytterligare något lägre så finns där en riskpremie för dålig tillgång på förnyelsebar kraft. Dåligt med vindkraft i Norden och vind– och solkraft på kontinenten skulle innebära tillfälliga importbehov där den reglerbara gaskraften är prissättande. När det gäller leverans så kan spotpriserna under Q1-14 dock mycket väl bli än lägre vid en hydrologi runt normalen, bra med kärnkraft och relativt milt väder. 2012 hade vi t.ex. ett genomsnittligt spotpris under jan-mars på €38,2/ MWh (i linje med dåvarande marginalkostnad på kol) trots ett underskott på -7 TWh. Vi hade då 85 % kärnkrafttillgänglighet i Sverige.
Kort slutsats
Hur sammanfattar vi då allt det här? Jo, vi anser i nuläget att riskerna på uppsidan för terminskontraktet Q1-14 är större än på nedsidan. Får vi se samma utveckling som flera tidigare år där hydrobalansen försämrats kraftigt fram till årsskiftet, prognoser pekar på en kall vinter och om dessutom kärnkraften skulle fortsätta strula kan vi mycket väl närma oss tyska peakpriser runt €50-55/MWh.
Författare: Mia Bodin
[box]Denna artikel om elpriset publiceras på Råvarumarknaden.se med tillstånd och i samarbete med Modity Energy Trading.[/box]
Ansvarsfriskrivning
Energimarknadskommentaren har producerats av Modity Energy Trading. Informationen är rapporterad i god tro och speglar de aktuella åsikterna hos medarbetarna, dessa kan ändras utan varsel. Modity Energy Trading tar inget ansvar för handlingar baserade på informationen.
Om Modity Energy Trading
Modity Energy Trading erbjuder energibolag och större företag den erfarenhet, kompetens och analysredskap som krävs för en trygg och effektiv förvaltning av energiportföljen. Modity bedriver handel med allt från el, gas och biobränslen till elcertifikat, valutor och utsläppsrätter. Företagets kunder får dessutom ta del av deras analysprodukter som t.ex det fullständiga marknadsbrevet med ytterligare kommentarer och prognoser. För ytterligare information se hemsidan.


Lower as OPEC+ keeps fast-tracking redeployment of previous cuts. Brent closed down 1.3% yesterday to USD 68.76/b on the back of the news over the weekend that OPEC+ (V8) lifted its quota by 547 kb/d for September. Intraday it traded to a low of USD 68.0/b but then pushed higher as Trump threatened to slap sanctions on India if it continues to buy loads of Russian oil. An effort by Donald Trump to force Putin to a truce in Ukraine. This morning it is trading down 0.6% at USD 68.3/b which is just USD 1.3/b below its July average.

Only US shale can hand back the market share which OPEC+ is after. The overall picture in the oil market today and the coming 18 months is that OPEC+ is in the process of taking back market share which it lost over the past years in exchange for higher prices. There is only one source of oil supply which has sufficient reactivity and that is US shale. Average liquids production in the US is set to average 23.1 mb/d in 2025 which is up a whooping 3.4 mb/d since 2021 while it is only up 280 kb/d versus 2024.
Taking back market share is usually a messy business involving a deep trough in prices and significant economic pain for the involved parties. The original plan of OPEC+ (V8) was to tip-toe the 2.2 mb/d cuts gradually back into the market over the course to December 2026. Hoping that robust demand growth and slower non-OPEC+ supply growth would make room for the re-deployment without pushing oil prices down too much.
From tip-toing to fast-tracking. Though still not full aggression. US trade war, weaker global growth outlook and Trump insisting on a lower oil price, and persistent robust non-OPEC+ supply growth changed their minds. Now it is much more fast-track with the re-deployment of the 2.2 mb/d done already by September this year. Though with some adjustments. Lifting quotas is not immediately the same as lifting production as Russia and Iraq first have to pay down their production debt. The OPEC+ organization is also holding the door open for production cuts if need be. And the group is not blasting the market with oil. So far it has all been very orderly with limited impact on prices. Despite the fast-tracking.
The overall process is nonetheless still to take back market share. And that won’t be without pain. The good news for OPEC+ is of course that US shale now is cooling down when WTI is south of USD 65/b rather than heating up when WTI is north of USD 45/b as was the case before.
OPEC+ will have to break some eggs in the US shale oil patches to take back lost market share. The process is already in play. Global oil inventories have been building and they will build more and the oil price will be pushed lower.
A Brent average of USD 60/b in 2026 implies a low of the year of USD 45-47.5/b. Assume that an average Brent crude oil price of USD 60/b and an average WTI price of USD 57.5/b in 2026 is sufficient to drive US oil rig count down by another 100 rigs and US crude production down by 1.5 mb/d from Dec-25 to Dec-26. A Brent crude average of USD 60/b sounds like a nice price. Do remember though that over the course of a year Brent crude fluctuates +/- USD 10-15/b around the average. So if USD 60/b is the average price, then the low of the year is in the mid to the high USD 40ies/b.
US shale oil producers are likely bracing themselves for what’s in store. US shale oil producers are aware of what is in store. They can see that inventories are rising and they have been cutting rigs and drilling activity since mid-April. But significantly more is needed over the coming 18 months or so. The faster they cut the better off they will be. Cutting 5 drilling rigs per week to the end of the year, an additional total of 100 rigs, will likely drive US crude oil production down by 1.5 mb/d from Dec-25 to Dec-26 and come a long way of handing back the market share OPEC+ is after.
The OPEC+ subgroup V8 this weekend decided to fully unwind their voluntary cut of 2.2 mb/d. The September quota hike was set at 547 kb/d thereby unwinding the full 2.2 mb/d. This still leaves another layer of voluntary cuts of 1.6 mb/d which is likely to be unwind at some point.
Higher quotas however do not immediately translate to equally higher production. This because Russia and Iraq have ”production debts” of cumulative over-production which they need to pay back by holding production below the agreed quotas. I.e. they cannot (should not) lift production before Jan (Russia) and March (Iraq) next year.
Argus estimates that global oil stocks have increased by 180 mb so far this year but with large skews. Strong build in Asia while Europe and the US still have low inventories. US Gulf stocks are at the lowest level in 35 years. This strong skew is likely due to political sanctions towards Russian and Iranian oil exports and the shadow fleet used to export their oil. These sanctions naturally drive their oil exports to Asia and non-OECD countries. That is where the surplus over the past half year has been going and where inventories have been building. An area which has a much more opaque oil market. Relatively low visibility with respect to oil inventories and thus weaker price signals from inventory dynamics there.
This has helped shield Brent and WTI crude oil price benchmarks to some degree from the running, global surplus over the past half year. Brent crude averaged USD 73/b in December 2024 and at current USD 69.7/b it is not all that much lower today despite an estimated global stock build of 180 mb since the end of last year and a highly anticipated equally large stock build for the rest of the year.
What helps to blur the message from OPEC+ in its current process of unwinding cuts and taking back market share, is that, while lifting quotas, it is at the same time also quite explicit that this is not a one way street. That it may turn around make new cuts if need be.
This is very different from its previous efforts to take back market share from US shale oil producers. In its previous efforts it typically tried to shock US shale oil producers out of the market. But they came back very, very quickly.
When OPEC+ now is taking back market share from US shale oil it is more like it is exerting a continuous, gradually increasing pressure towards US shale oil rather than trying to shock it out of the market which it tried before. OPEC+ is now forcing US shale oil producers to gradually back off. US oil drilling rig count is down from 480 in Q1-25 to now 410 last week and it is typically falling by some 4-5 rigs per week currently. This has happened at an average WTI price of about USD 65/b. This is very different from earlier when US shale oil activity exploded when WTI went north of USD 45/b. This helps to give OPEC+ a lot of confidence.
Global oil inventories are set to rise further in H2-25 and crude oil prices will likely be forced lower though the global skew in terms of where inventories are building is muddying the picture. US shale oil activity will likely decline further in H2-25 as well with rig count down maybe another 100 rigs. Thus making room for more oil from OPEC+.
The latest weekly report from the US DOE showed a substantial drawdown across key petroleum categories, adding more upside potential to the fundamental picture.

Commercial crude inventories (excl. SPR) fell by 5.8 million barrels, bringing total inventories down to 415.1 million barrels. Now sitting 11% below the five-year seasonal norm and placed in the lowest 2015-2022 range (see picture below).
Product inventories also tightened further last week. Gasoline inventories declined by 2.1 million barrels, with reductions seen in both finished gasoline and blending components. Current gasoline levels are about 3% below the five-year average for this time of year.
Among products, the most notable move came in diesel, where inventories dropped by almost 4.1 million barrels, deepening the deficit to around 20% below seasonal norms – continuing to underscore the persistent supply tightness in diesel markets.
The only area of inventory growth was in propane/propylene, which posted a significant 5.1-million-barrel build and now stands 9% above the five-year average.
Total commercial petroleum inventories (crude plus refined products) declined by 4.2 million barrels on the week, reinforcing the overall tightening of US crude and products.


Guld stiger till över 3500 USD på osäkerhet i världen

Lyten, tillverkare av litium-svavelbatterier, tar över Northvolts tillgångar i Sverige och Tyskland

Lundin Gold hittar ny koppar-guld-fyndighet vid Fruta del Norte-gruvan

Alkane Resources och Mandalay Resources har gått samman, aktör inom guld och antimon
Breaking some eggs in US shale

USA inför 93,5 % tull på kinesisk grafit

Fusionsföretag visar hur guld kan produceras av kvicksilver i stor skala – alkemidrömmen ska bli verklighet

Westinghouse planerar tio nya stora kärnreaktorer i USA – byggstart senast 2030

Ryska militären har skjutit ihjäl minst 11 guldletare vid sin gruva i Centralafrikanska republiken

Eurobattery Minerals förvärvar majoritet i spansk volframgruva
-
 Nyheter3 veckor sedan
USA inför 93,5 % tull på kinesisk grafit
-
 Nyheter3 veckor sedan
Fusionsföretag visar hur guld kan produceras av kvicksilver i stor skala – alkemidrömmen ska bli verklighet
-
 Nyheter3 veckor sedan
Westinghouse planerar tio nya stora kärnreaktorer i USA – byggstart senast 2030
-
 Nyheter3 veckor sedan
Ryska militären har skjutit ihjäl minst 11 guldletare vid sin gruva i Centralafrikanska republiken
-
 Nyheter4 veckor sedan
Eurobattery Minerals förvärvar majoritet i spansk volframgruva
-

 Nyheter1 vecka sedan
Kopparpriset i fritt fall i USA efter att tullregler presenterats
-
 Nyheter1 vecka sedan
Lundin Gold rapporterar enastående borrresultat vid Fruta del Norte
-

 Nyheter3 veckor sedan
Kina skärper kontrollen av sällsynta jordartsmetaller, vill stoppa olaglig export