

Analys
Den heliga treenigheten för 2017?

 Kina, Trump och OPEC
Under 2016 har tre starka drivkrafter utkristalliserats och drivit råvaror till bästa tillgångsslag med råvaruindex upp 30% i USD. För 2017 tror vi bara en mäktar med att överträffa förväntansbilden, det är inte Trump eller Kina –utan OPEC.
 OPEC överträffade förväntningarna
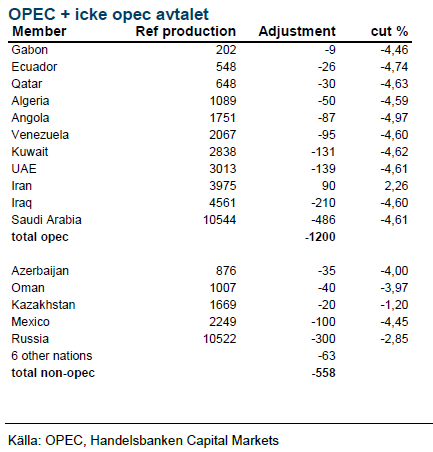
Det halvårsvisa OPEC-mötet i Wien gav ett styrkebesked från den slumrande kartellen. Ett paket med tre starka komponenter presenterades; produktionskvoter för varje medlemsland, tak för Iran och ett avtal med icke-OPEC, där Ryssland står för största sänkningen. Marknaden tvivlar på implementeringen, historiskt har OPEC levererat 80% av avtalade sänkningar. Vi tror på OPEC den här gången och ser en oljemarknad i god balans under andra halvåret vilket leder till ett snittoljepris på USD 60 för 2017, en kraftig höjning från tidigare prognos på USD 40.
Kina +Trump = basmetaller
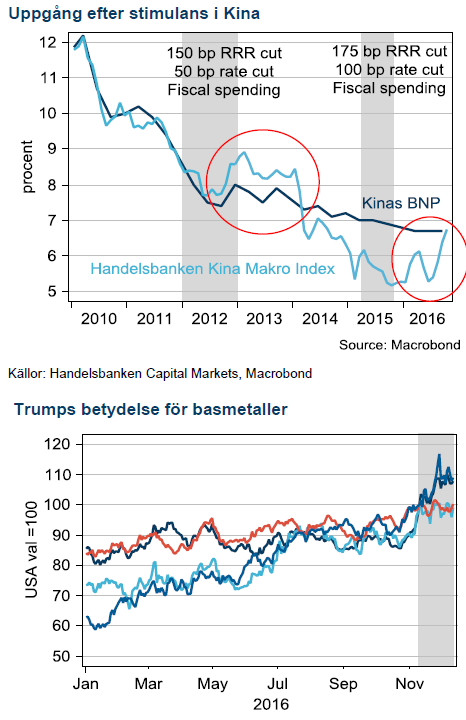
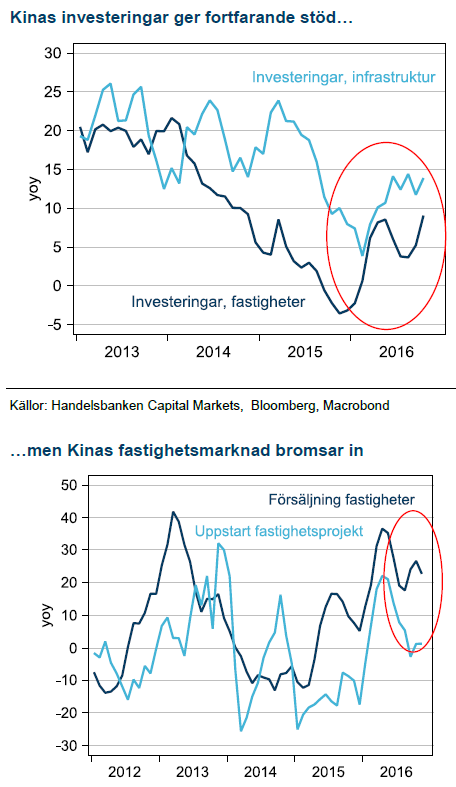
Kinas återhämtning det här året kommer från riktade stimulanser mot fastighetsmarknaden och infrastruktur under 2015. En gammal, välbeprövad metod som konsumerar mycket industriella metaller. Kina har nu börjat kyla ner fastighetsmarknaden vilket kommer att vara ledande för lägre tillväxttakt i investeringar i infrastruktur under 2017. Trumps tillträde som president kommer sannolikt öka förväntningarna ytterligare under Q1 men sedan finns det risk för besvikelse både i USA och Kina. Zink och nickel står starka i utbudssidan av prisekvationen medan koppar och aluminium kommer tyngas av hög produktion. Vi tror på ett högre medelpriser för alla basmetaller under 2017 jämfört med 16 men ser spotpriserna som väl höga för alla utom nickel.
Vår syn för Q1-Q2 2017:
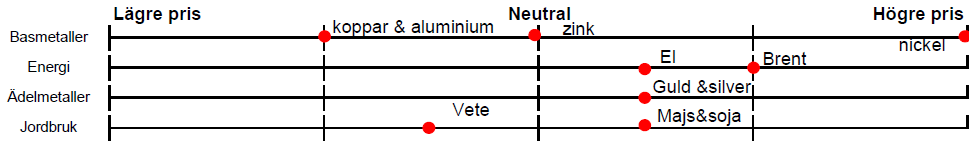
Basmetaller
 Höga förhoppningar
Årets vändning i basmetaller kommer från de stimulanser Kina genomfört sedan 2015. Medicinen med riktad stimulans mot fastighetsmarknaden är effektiv och för med sig ökade investeringar i infrastruktur. De två viktigaste segmenten för efterfrågan på metaller. Medicinens biverkning är skenande fastighetspriser och en bostadsbubbla som kinesiska ledare måste se upp med. Det är därför inte förvånande att Kina börjat kyla fastighetsmarknaden, dessutom på precis samma nivå i ökningstakt som under den senaste cykeln, 2013.
Zink och nickel står starkt
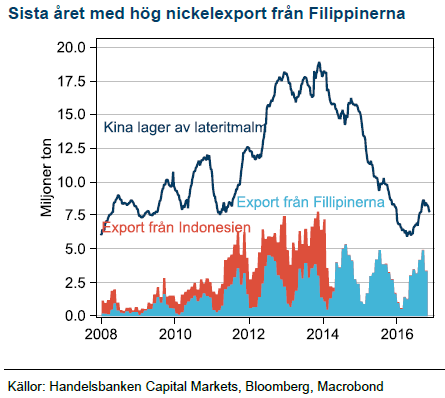
Vår tro på högre zink och nickelpriser har besannats, och av rätt skäl. Brist i marknadsbalansen efter stängda gruvor för zink, då flera stora är utbrutna och för nickel, efter miljöutvärderingen på Filippinerna. I Zink–priset har marknaden prisat in mycket förhoppningar på Trump och där finns nu en risk för besvikelse i kombination med allt fler kinesiska marginalproducenter som ökar produktionen vilket kan dämpa uppgången. Vi har USD 2700 som medelpris för 2017.
Nickelbristen får störst effekt i marknaden först under 2017 när höga lagernivåer betats av och Filipinernas lägre export gör avtryck. Vi fortsätter därför att tro på stigande priser med USD 13800 som medelpris för 2017.
Koppar och Aluminium i Trumps skottglugg
 De divergerande förutsättningarna för basmetaller på utbudssidan spelar fortfarande in. Fram till Trumps segertal handlades koppar i princip oförändrad i år, trots de starkaste stimulanserna i Kina sedan finanskrisen. Högre produktion från nya gruvor är förklaringen. Vi sätter därför en speciell varningsflagga för koppar på nedsidan när Kinas stimulanser rullar ut ur systemet, före det att Trump eventuellt kommer in under 2018, med ett medelpris på USD 5000.
Aluminium har stigit i bakvattnet av högre produktionskostnad när kol- och oljepriserna har gått upp. Marknadsbalansen är dock välförsörjd och marginalproduktion i Kina stiger samtidigt som kolprisbubblan spricker efter vintern. Vi tror på ett medelpris USD 1600 för 2017.
Energi
 OPEC visar vägen
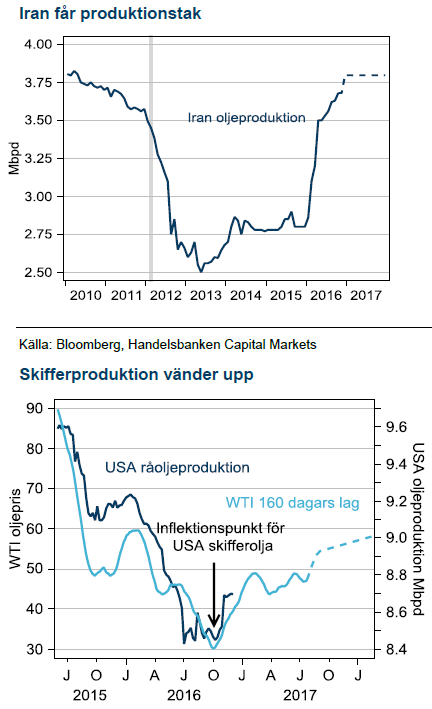
OPEC:s officiella möte i Wien slutade med en skräll. Priset steg 10% på beskedet att gruppen nått ett avtal om att begränsa produktionen tillsammans med flera länder som inte är medlemmar i OPEC. Dessutom hittade man ett tak för Iran vilket tar bort mycket av risken i priset som fanns under 2016.
Saudiarabien är arkitekten
Saudiarabien är det land som har svårast att skära ner på utgifterna. Rädslan för Arabiska vårens uppror är påtaglig och att finansiera budgetunderskottet med högre skuldsättning kommer att bli allt svårare när utsikterna för oljepriset att återhämta sig falnar. Efter att de under två smärtsamma år försökt konkurrera ut högkostnadsproducenter, utan större framgång, väljer de nu att pröva en annan väg. På flera års sikt har den minimal prispåverkan men för de närmsta tolv månaderna blir skillnaden total när marknaden går i underskott och de prisdämpande lagernivåerna betas av.
Mycket ska bevisas
 Nu ska en bred konstellation av länder visa att de klarar av att sänka produktionen. Risken i avtalet ligger främst i Nigeria som tillåts öka, om de kan. Nigeria har potential att kompensera hela Rysslands sänkning. Den stora effekten i marknadsbalansen kommer först vid mitten av året när Saudiarabiens inhemska efterfrågan är högre och exporten måste bli lägre. Då har också Ryssland succesivt sänkt sin produktion.
Skifferoljan är vinnare
Norge, Kanada och USA:s marginalproducenter är de största vinnarna på avtalet. Länderna har jobbat hårt för att sänka produktionskostnaden under två år och behöver inte betala för det högre oljepriset. Vi tror på stark utveckling för skifferoljan givet 150-160 dagars eftersläpning till priset men det får oljepriset på fall först 2018 eftersom volymökningen med marginal äts upp av OPEC:s sänkning.
Elpriset åter volatilt
Sverige har den lägsta fyllnadsnivån i vattenmagasinen sedan 2002, lägre än elpristoppen 2010. En vinter något kallare än normalt räcker för att driva el till en mycket högre prisnivå.
Ädelmetaller
Guldet får revansch
Fed kommer att fortsätta med en stramare penningpolitik även om fokus i USA kommer att tiltas mot den kommande finanspolitiken. Guld har redan handlat in den effekten och all form av besvikelse på Trump kommer gynna guld.
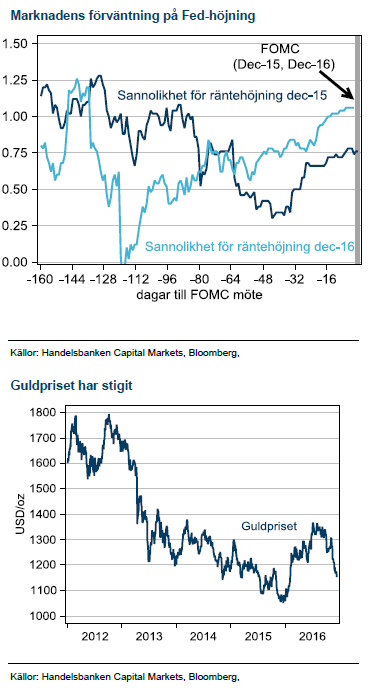 Fed har succesivt blivit tydligare och veckans höjning med 25bps var redan 100% prisad inför mötet, nyheten ligger i eventuell förändrad prognos för räntebana. För 2017 har Fed två höjningar och för 2018 tre.
Feds huvudvärk är guldets gnista
Efter en initial press på guld, sedan Fed startat sin räntehöjningscykel i december 2015, så fick guldet massor av drivkraft från att Fed och marknaden reviderade ner antalet räntehöjningar. Nu blev det till slut bara en höjning det här året, vid decembermötet.
Ingen repris nästa år
För 2017 ser vi inte en enkel repris av 2016. För ett år sedan trodde marknaden på fler höjningar under 2016 och det signalerade även Fed. Det kom ju sedan på skam och guldet glänste. Den här gången har Fed bara två höjning under 2017 och vi ser det som mycket mindre sannolikt att Fed reviderar ner räntebanan och därmed trigga en ny uppgång i guld.
För höga förväntningar
Istället ser vi en reversering i hela handelsmönstret efter Trumps segertal som en drivkraft till högre guldpriser. Mycket höga förhoppningar har prisats och guld har varit en förlorare i det spelet. Om vinden vänder kommer guld vara en vinnare.
Jordbruk
 Lagercykeln har toppat
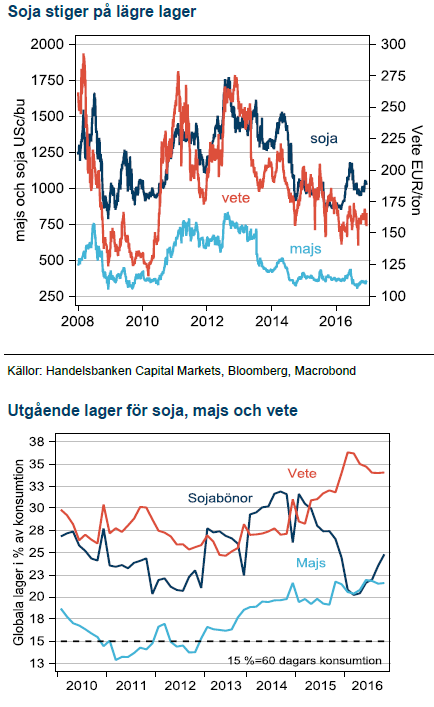
Fokus för de tre stora grödorna, soja, majs och vete har varit återställande av globala lagernivåer efter USA:s torka 2012. Efter flera bra skördeår har höga lager pressat de närmsta terminerna. Vi tror att den cykeln nu har toppat och temat för 2017 kommer vara att lagren på vissa håll inte skapar samma prispress längre.
Globala lager är höga, det sticker vi inte under stol med. De är dock allokerade mycket ojämnt. Oproportionellt stora volymer ligger i Kina där vi alltid är skeptiska till pålitligheten i data –speciellt för lager och jordbruksprodukter. Dessutom är Kina inte delaktig i global handel för andra grödor än soja, vilket minskar betydelsen av höga kinesiska lager.
Avkastningen avgör
Om lagercykeln toppat ur och global efterfrågan är stark kommer tillväxt i konsumtionen att sänka lagren. Exakt hur det blir i slutänden avgörs av avkastningen för varje gröda. Ännu ligger odlingsåret i sin linda och det är för tidigt att sia om avkastningens prispåverkan utöver det som redan är känt, och därmed inprisat. Vi nöjer oss därför med att tro på relativspelet mellan soja och majs, med lägst lager, och högst andel i Kina jämfört med vete, som fortfarande har högre lager. Vi tänker oss en svag nedgång för vete där vi räknar med att december 2017 terminen slutar på 160, omkring 7% lägre än dagens pris. När lagren faller räknar vi också med en mindre brant kurva. Vi räknar med att vetelager faller med omkring 10 % medan lager för soja och majs faller omkring 15-20% som ett resultat av låga priser, år med rekordavkastning bakom oss och växande efterfrågan.
Oljepriset påverkar
Vår förändrade syn på oljepriset, från förut USD 40 för 2017 till nu USD 60 påverkar spannmålsprisernamed högre produktionskostnad vilket tenderar att få marknaden att handla uppåt, speciellt i en miljö då lager faller. Dessutom gynnas efterfrågan och priset på majs och soja från ökade alternativkostnader i bränslesegmentet.
Trots tvivel tror vi att Trump kommer att fortsätta gynna biobränslen då det tillsammans med inhemsk råoljeproduktion minskar importberoendet från OPEC och Mellanöstern.


Selling down on a ”deal”. Brent crude fell 6.2% last week with accelerated weakness towards the end of the week. Close of the week at $87.33/b and low of the week (and on Friday) of $85.8/b. Brent is falling another 4% this morning to $83.7/b on confirmation by Iran that a MoU text has been reached and that it will be signed on Friday this week.

So what is this ”deal” worth? Talk on the desk here this morning is that it is much like ”putting lipstick on a pig” where Trump has to sell this at home as a victory where ”the SoH has reopened”, the nuclear issue will be ironed out over the coming 60 days (or maybe 600 days?) and US consumers are getting a lower gasoline price and maybe US republicans survives the midterm elections.
The importance for Iran is that it emerges as the defacto winner of this war in the eyes of the non-US public world. That Iran now onwards is the ”ruler of the SoH” (combo of geography and new weapons systems like drones) or more softer: ”the guarantor of safe passage through the SoH”.
Iran doesn’t need nuclear weapons any more. Nuclear deterrence doesn’t work any more. Ukraine has made many attacks deep into Russia without being nuked in return. Plenty of Iranian ballistic rockets blasts over Israel but Iran wasn’t nuked in return.
There is no trust between the US and Iran. We don’t know all the details yet of the MoU. But what we do know is that there is no trust between the US and Iran what so ever. This is probably more like a descriptive text on how they can cooperate in a way where both sides keeps tactical leverage. Neither side makes irreversible concessions. Violations can be punished quickly. Cooperation produces immediate benefits.
This is a fragile structure. It can easily break down. There may be details which cannot be overcome. To be seen on Friday. The US has to show that it is willing put enough force behind managing and restraining Israel versus Hezbollah in Lebanon. We have seen that Netanyahu hasn’t listened all that much to Trump’s directives and wishes. This could be a major obstacle.
A gradual reopening is tactically preferable for Iran. A tactical leverage for Iran right now is that global oil stocks have been drawn down towards painful and increasingly dangerous levels with increasing risks for oil price spikes in mid-July to August. This together with US midterm elections on 3 November gives tactical leverage to Iran. Iran probably doesn’t want to fully give up on that leverage. A rapid, full reopening where global stocks are able to refill over the coming 60 days will significantly erode that leverage. If Iran reinstates a closure of the SoH after 60 days (if talks break down again), then the effect won’t be that impactful in terms of prices and the US midterm elections.
So a gradual and partial reopening where global markets gets the oil they need while they are unable to rebuild stocks could be a practical middle way for both parties. Trump can sell it as ”the SoH has reopened” and get affordable gasoline for US consumers. Iran can sell it as ”the SoH has fully reopened, but there is some friction” so flow is only 60-80% of normal.
Not much real demand destruction below $100/b. What we do know is that there is not much real price pain demand destruction for oil globally at an oil price below $100/b. A lot of demand-shock destruction. Fear. But demand should now come roaring back towards normal with fear for exceptionally high prices now is rapidly receding.
Sudden China demand destruction due to EVs? Bullocks. EV share of total Chinese carpool now around 13%. Share of new sales of EVs has reached 50%. This is a very gradual process. It doesn’t make oil demand fall like a rock over night. When EV new sales share reaches 100%, then the gasoline car pool will contract by some 5-10% per year. But that is only gasoline. Sudden reduction in Chinese oil demand is more about shock and risk.
Chinese crude oil imports will come roaring back. At what price? Today’s ”neutral” oil price is $70/b. That is the five year price which has steadily traded around the $70/b mark over the past 3-4 years. With still a risky picture one would think that China and the rest of the world will be big buyers of oil in the range of $70-85/b.
Global demand will likely snap back towards normal, forecasted demand and growth at such prices.
Physical reopening is a gradual process. The physical and practical reopening of the SoH will likely be gradual rather than sudden. And that probably suites Iran tactically as well.
Brent M1 price versus the Brent 5-yr (today’s ”normal” price)

Market is starting to take US/Iran headlines with a pinch of salt. Brent crude rose $2.8/b yesterday to an official close of $112.1/b. But after that it traded as low as $108.05/b before ending late night at around $109.7/b. Through the day it traded in a range of $106.87 – 112.72/b amid a flurry of news or rumors from Iran and the US. ”US temporary sanctions during negotiations” (falls alarm). ”We will bomb Iran” (not anyhow),… etc. While the market is still fluctuating to this kind of news flow, it is starting to take such headlines with a pinch of salt.
We’ll see. Maybe, maybe not. The Brent M1 contract is trading at $110.2/b this morning which very close to the average ticks through yesterday of $110.4/b.
Trump with bearish, verbal intervention whenever Brent trades above $110/b it seems. What seems to be a pattern is that Trump states something like ”very good negotiations going on with Iran”, ”New leaders in Iran are great,..”, ”Great progress in negotiations,…”, ”Deal in sight,..” etc whenever the Brent M1 contract trades above $110/b. An effort to cool the market. These hot air verbal interventions from Trump used to have a heavy bearish impact on prices, but they now seems to have less and less effect unless they are backed by reality.
As far as we can see there has been no real progress in the negotiations between the US and Iran with both sides still standing by their previous demands.
Iran is getting stronger while the cease fire lasts making a return to war for Trump yet harder. Iran is naturally in constant preparation for a return to war given Trump’s steady threats of bombing Iran again. Iran is naturally doing what ever is possible to prepare for a return to war. And every day the cease fire lasts it is better prepared. This naturally makes it more and more difficult and dangerous for the US to return to warring activity versus Iran as the consequences for energy infrastructure in the Persian Gulf will be more and more severe the longer the cease fire lasts. Israel seems to see it this way as well. That the war is not won and that current frozen state of a cease fire gives Iran opportunity to rebuild military and politically.
Global inventories are drawing down day by day. How much? In the meantime the Strait of Hormuz stays closed. There is varying measures and estimates of how much global inventories are drawing down. Our rough estimate, back of the envelope, is that global inventories are drawing down by at least some 10 mb/d or about 300 mb/d in a balance between loss of supply versus demand destruction. Other estimates we see are a monthly draw of 250-270 mb/d. The IEA only ’measured’ a draw in global observable stocks of 117 mb in April with oil on water rising 53 mb while on shore stocks fell 170 mb. But global stocks are hard to measure with large invisible, unmeasured stocks. As such a back of the envelope approach may be better.
Oil products is what the world is consuming. Oil product prices likely to rise while product stocks fall. Strategic Petroleum Reserves (SPR) are predominantly crude oil. Discharging oil from OECD SPR stocks, a sharp reduction in Chinese crude imports and a reduction in global refinery throughput of 6-7 mb/d has helped to keep crude oil markets satisfactorily supplied. But global inventories are drawing down none the less. And oil products is really what the world is consuming. So if global refinery throughput stays subdued, then demand will eventually have to match the supply of oil products. The likely path forward this summer is a steady draw down in jet fuel, diesel and gasoline. Higher prices for these. Then, if possible, higher refinery throughput and higher usage of crude in response to very profitable refinery margins. And lastly sharper draw in crude stocks and higher prices for these. But some 6 mb/d of oil products used to be exported through the Strait of Hormuz. And it may not be so easy to ramp up refinery activity across the world to compensate. Especially as Ukraine continues to damage Russian refineries as well as Russian crude production and export facilities.
Watch oil product stocks and prices as well as Brent calendar 2027. What to watch for this summer is thus oil product inventories falling and oil product premiums to crude rising. Another measure to watch is the Brent crude 2027 contract as it rises steadily day by day as the Strait of Hormuz stays closed and global oil inventories decline. The latter is close to the highest level since the start of the war and keeps rising.
The Brent M1 contract and the Brent 2027 prices and current price of jet fuel in Europe (ARA). All in USD/b

Our back of the envelope calculation of the global shortage created by the closure of the Strait of Hormuz. Note that 3.5 mb/d of discharge from SPR is also a draw. Note also that ’Forced demand loss’ of 2.5 mb/d is probably temporary and will fall back towards zero as logistics are sorted out leaving ’Price demand loss’ to do the job of balancing the market. Thus a shortfall of at least 9 mb/d created by the closure. More if SPR discharge is included and more if Forced demand loss recedes.

Brent is climbing higher. Front-month is at USD 106.3/bl this morning, close to a weekly high and a USD 9/bl jump from Mondays open. This is the move we flagged as a risk earlier in the week: the market shifting from ”a deal is around the corner” to ”this is going to take longer than we thought”.

Analyst Commodities, SEB
During April, rest-of-year Brent remained remarkably stable around USD 90/bl. A stability which rested on one single assumption: the SoH reopens around 1 May. That assumption is now slowly falling apart.
As we highlighted yesterday: every week of delay beyond 1 May adds (theoretically) ish USD 5/bl to the rest-of-year average, as global inventories draw 100 million barrels per week. i.e., a mid-May reopening implies rest-of-year Brent closer to USD 100/bl, and anything pushing into June or July takes us meaningfully higher.
What’s changed in the last 48 hours:
#1: The US military has formally warned that clearing suspected sea mines from SoH could take up to six months. That is a completely different timescale from what the financial market is pricing. Even a political deal tomorrow does not immediately reopen the strait.
#2: Trump has shifted his tone from urgency to ”strategic patience”. In yesterday’s press conference: ”Don’t rush me… I want a great deal.” The market is reading this as a president no longer feeling pressured by timelines, with the naval blockade running in the background.
#3: So far, the military activity is escalating, not de-escalating. Axios reports Iran is laying more mines in SoH. The US 3rd carrier strike group (USS George H.W. Bush) is arriving with two countermine vessels. Trump yesterday ordered the US Navy to destroy any Iranian boats caught laying mines. While CNN reports that the Pentagon is actively drawing up plans to strike Iranian SoH capabilities and individual Iranian military leaders if the ceasefire collapses. i.e., NOT a attitude consistent with an imminent deal!
Spot crude and product prices eased off the early-April highs on a combination of system rerouting and deal optimism. Both now weakening. Goldman estimates April Gulf output is reduced by 14.5 mbl/d, or 57% of pre-war supply, a number that keeps getting worse the longer this drags on.
Demand-side adaptation is ongoing: S. Korea has cut its Middle East crude dependence from 69% to 56% by pulling more from the Americas and Africa, and Japan is kicking off a second round of SPR releases from 1 May. But SPRs are finite.
Ref. to the negotiations, we should not bet on speed. The current Iranian leadership is dominated by genuine hardliners willing to absorb economic pain and run the clock to extract concessions. That is not a setup for a rapid resolution. US/Israeli media briefings keep framing the delay as ”internal Iranian divisions”, the reality is more complicated and points toward weeks and months, not days.
Our point is that the complexity is large, and higher prices have only just started (given a scenario where the negotiations drag out in time). The market spent April leaning on the USD 90/bl rest-of-year assumption; that case is diminishing by the hour. If ”early May reopening” is replaced by ”June, July or later” over the next week or two, both crude and products have meaningful room to reprice higher from here. There is a high risk being short energy and betting on any immediate political resolution(!).


Vattenfalls och Industrikrafts kärnkraftsbolag Videberg Kraft har valt Rolls-Royce SMR
Selling down on a ”deal”

Sommarväder skapar prisrally på elbörsen
Oil product price pain is set to rise as the Strait of Hormuz stays closed into summer

