

Analys
US shale oil productivity update – OPEC could choke on strongly reviving US shale oil production in 2018 if oil prices hold up in H1-17

 Note: US rig count data by Baker Hughes at 19:00 CET on Friday December 16th
Crude oil comment – US shale oil productivity update – OPEC likely to choke down the road on strongly reviving US shale oil production if oil prices hold up in H1-17
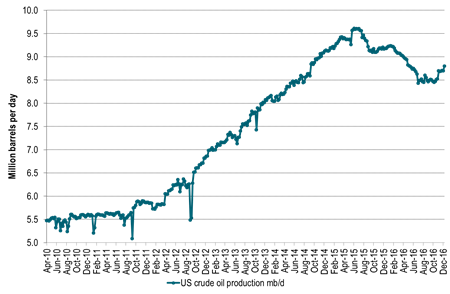
The only thing which can prevent a strong rise in US shale oil rig count going forward is muted crude oil prices. The physical crude oil production effect of an additional 25 shale oil rigs into the market per month in H1-17 won’t really hit the market before H2-17 and mostly 2018. Thus price action may stay oblivious to the coming wave of US shale oil production if it disregards a potentially continued solid rise in US shale oil rigs in H1-17 on the back of OPEC cuts and associated higher prices. At the moment we can see a marginal increase in US shale production projected for January 2017. In weekly data we can see that US crude production bottomed out in September and rose 99 kb/d w/w last week.
We will not see the actual realisation of US shale oil crude production in the spot market following the rig rise in H2-16 and potentially H1-17 for quite some time. I.e. not really before H2-17 and 2018. What we can see at the moment is the reflected hedging activity from the US shale oil players who hedge on the curve for 2018 and 2019 pushing it down. Shale oil players securing their investments in newly initiated activity having been burned heavily in the previous boom and bust. That is the immediate “shadow effect” hitting the market and the crude oil curve here and now as a reflection of the rising rig count which is again an effect of higher oil prices.
According to the latest US EIA’s Drilling productivity report there were 23 shale oil rigs added per month from the start of June until November. In November alone there were 34 rigs added.
The WTI 15mth price has averaged $51.6/b since the start of June. At the time of writing it trades at $54.3/b but recently traded all the way up to $56.4/b.
Note that in the below US crude oil production scenarios we have only assumed an additional 25 rigs per month for H1-17 for Ch10 and Ch11. That is not much more than the +23 added shale oil rigs per month since June observed by the US EIA in their December drilling productivity report. Thus assuming +25 rigs per month in H1-17 is not really acceleration in rig count addition versus H2-16. However, if the crude oil price was to be significantly higher, especially the WTI 15 mth crude price, then one probably should assume a substantially higher inflow of rigs in H1-17 than what we have witnessed in H2-16.
What this all tells us is that the oil price will be highly responsive to changes in the oil market balance versus OPEC cuts or whether Libyan production will average 1 mb/d in 2017 or just 0.5 mb/d or whether global oil demand growth will be much stronger or not in 2017 or whether Russia will actually be good on its pledged cuts for H1-17 etc. Then again US shale oil rig count and thereafter production will be highly responsive to oil prices again. We have shale oil boom and bust behind us. Now we have the shale oil adaptability before us. We cannot predict all the possible uncertain events which might hit the oil market supply/demand balance in 2017 and thus impact the oil price. We can however say a lot about the responsiveness for US shale oil production and thus how the oil market dynamically will behave. Thus if OPEC gives the market elevated oil prices in H1-17, then US shale oil will give the market a serious Blue Monday in H2-17 or 2018.
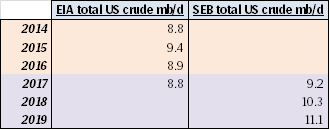
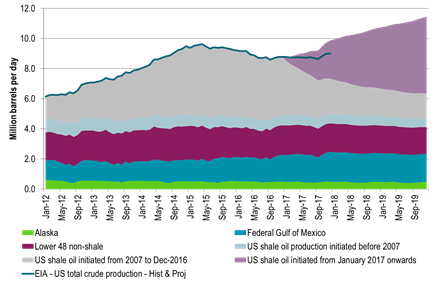
What the three US crude oil production scenarios below tells us is that US crude production in 2018 is highly impacted by how many rigs are added in H1-17. If there are no more rigs in H1-17, then US crude production is good at 9.2 mb/d in 2018. However, if we just continue on the trend from H2-16 with close to 25 extra rigs per month, then US crude production jumps to 10 mb/d in 2018. Thus the 2018 global supply/demand balance is really at play in H1-17. Our numbers are of course a model. The model still fairly well shows the magnitude of sensitivities at play.
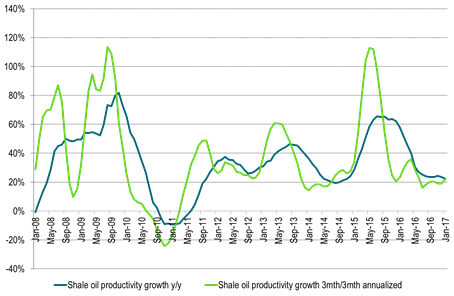
Ch1: US shale oil volume productivity growth continues to hold up at 20% per annum
Both in terms of y/y as well as 3mth/3mth annualized
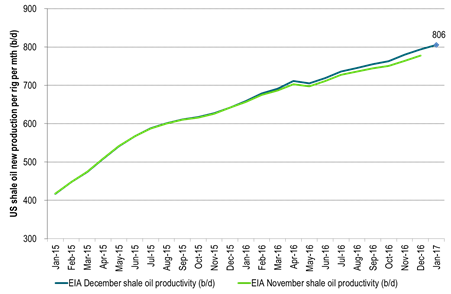
Ch2: US shale oil volume productivity set to rise to 806 b/d per rig per month in January
Calculated for the 4 main US shale oil regions: Bakken, Eagle Ford, Nibrara and Permian
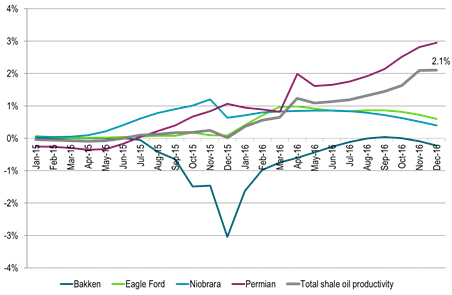
Ch3: The US EIA again revised higher historical US shale oil productivity by 2.1% for Nov and Dec
Data back to December 2015 were also on average revised higher.
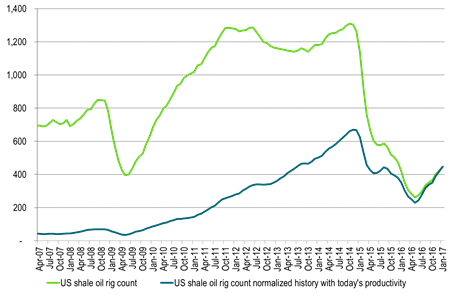
Ch4: The productive effect of today’s some 400 rigs are as strong as 1200 rigs back at the start of 2013
Dark line gives historical rig count adjusted with today’s productivity versus productivity at the time.
An additional 23 rigs are assumed added both in December and in January.
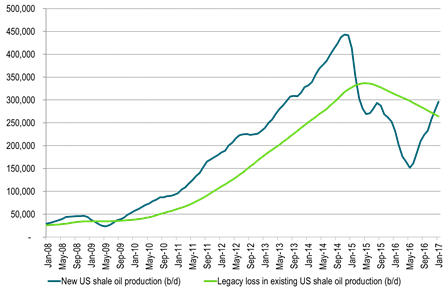
Ch5: US shale oil production is set to start to rise rapidly near term as new production cross above losses in old production
New production here given by EIA rig productivity (December report) stretching out to Jan-17 multiplied by rig count from same report but assuming an additional 23 rigs added in Dec and Jan. In reality however there is a time-lag of 2-4 months before they really cross over.
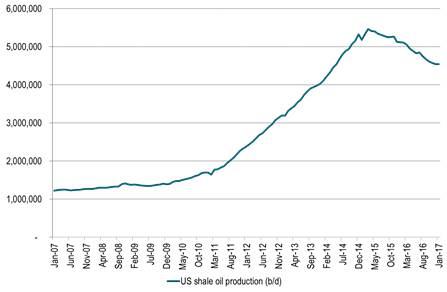
Ch6: US EIA shale oil production just about to turn higher
Data from EIA’s drilling productivity report for December
 Ch7: US crude oil production in weekly data already ticking higher (+99 kb/d w/w last week)
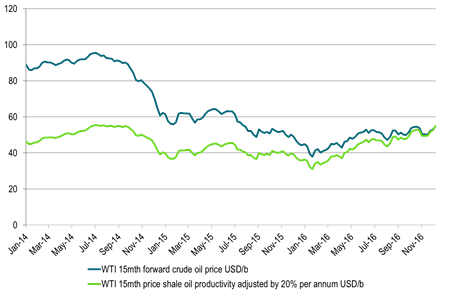
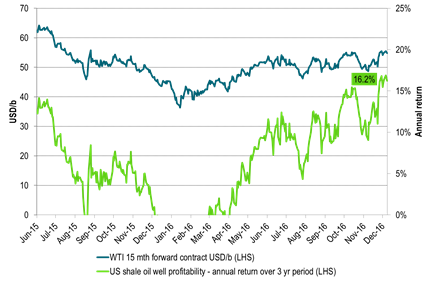
Ch8: US WTI15mth contract at most stimulative level (shale oil investment vise) since July 2015
Playing with numbers:
Green line: Adjust historical WTI15mth crude prices with the 20% pa (roughly) volume productivity growth
Then today’s WTI15 mth price is the most investment wise stimulative level since August 2014
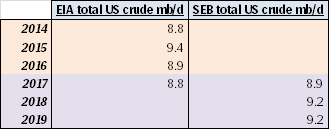
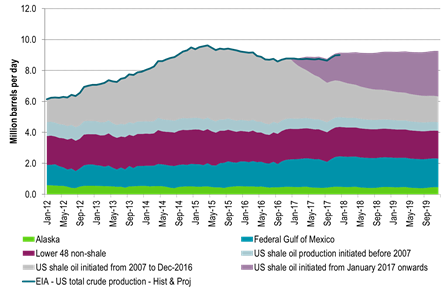
Ch9: US 2018 crude oil production at 9.2 mb/d – Assuming no added US shale oil rigs after Nov 2016 and zero productivity growth
Thus rig count is fixed at 401 from Dec-16 onwards with no productivity growth
However we have already seen 21 additional shale oil rigs into the market in December but they are not added to this scenario.
Only the rigs from the US EIA’s December drilling productivity report are included in this scenario.
Thus seen in the perspective of SEB’s US crude oil model it seems to us that the US EIA assumes NO additional activated shale oil rigs into the market after Nov-16 and no additional shale oil rigs into market in 2017.
We think that the US EIA should specify its assumptions and model projections for the US shale oil rig cont and productivity which goes into their model in its monthly STEO oil reports.
Ch10: US 2018 crude oil production at 10.0 mb/d – Assuming +25 shale oil rigs per month from December 2016 to June-2017 and zero productivity growth
Then no more rigs added after June 2017 with number of US shale oil rigs fixed at 576 rigs after that
Also zero volume productivity growth here onwards from December 2016 gives the following production projection

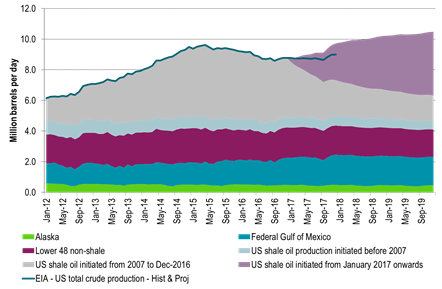
Ch11: US 2018 crude oil production at 10.3 mb/d – Assuming +25 shale oil rigs per month from December 2016 to June-2017 and 10% pa volume productivity growth
Then no more rigs added after June 2017 with number of US shale oil rigs fixed at 576 rigs after that
But assume that US shale oil volume productivity growth continues at 10% pa. instead of the historical (and current) 20% pa.
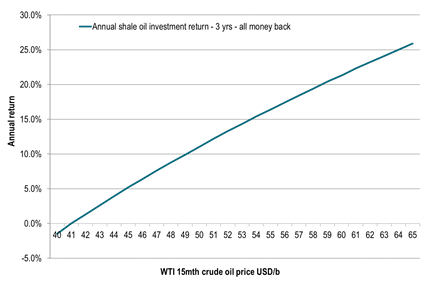
Ch12: US shale oil profitability versus WTI 15 mth crude oil prices
Annual return for a three year investment.
Three years of crude oil production from a new shale oil well.
All money back after three years.
IP 1mth: 1000 b/d. Royalty pay: 20%. Discount rate: 10%, Three yr production after royalty and discount: 330,000 barrels, Wellhead to Cushing discount: $5/b, OPEX: $12/b, Total well cost: $8million,
All production within the hedgeable part of the WTI crude oil price curve.
Thus return should be possible to lock in at the initiation of the investment
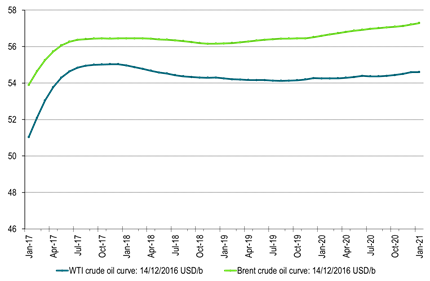
Ch13: The WTI crude oil forward curve feeling the depression from shale oil hedging in 2018 and 2019
Likely to be increasingly heavy depression if rig count continues to rise further
Ch14: As three year annual shale oil profitability hits 16% pa
Kind regards
Bjarne Schieldrop
Chief analyst, Commodities
SEB Markets
Merchant Banking
Selling down on a ”deal”. Brent crude fell 6.2% last week with accelerated weakness towards the end of the week. Close of the week at $87.33/b and low of the week (and on Friday) of $85.8/b. Brent is falling another 4% this morning to $83.7/b on confirmation by Iran that a MoU text has been reached and that it will be signed on Friday this week.

So what is this ”deal” worth? Talk on the desk here this morning is that it is much like ”putting lipstick on a pig” where Trump has to sell this at home as a victory where ”the SoH has reopened”, the nuclear issue will be ironed out over the coming 60 days (or maybe 600 days?) and US consumers are getting a lower gasoline price and maybe US republicans survives the midterm elections.
The importance for Iran is that it emerges as the defacto winner of this war in the eyes of the non-US public world. That Iran now onwards is the ”ruler of the SoH” (combo of geography and new weapons systems like drones) or more softer: ”the guarantor of safe passage through the SoH”.
Iran doesn’t need nuclear weapons any more. Nuclear deterrence doesn’t work any more. Ukraine has made many attacks deep into Russia without being nuked in return. Plenty of Iranian ballistic rockets blasts over Israel but Iran wasn’t nuked in return.
There is no trust between the US and Iran. We don’t know all the details yet of the MoU. But what we do know is that there is no trust between the US and Iran what so ever. This is probably more like a descriptive text on how they can cooperate in a way where both sides keeps tactical leverage. Neither side makes irreversible concessions. Violations can be punished quickly. Cooperation produces immediate benefits.
This is a fragile structure. It can easily break down. There may be details which cannot be overcome. To be seen on Friday. The US has to show that it is willing put enough force behind managing and restraining Israel versus Hezbollah in Lebanon. We have seen that Netanyahu hasn’t listened all that much to Trump’s directives and wishes. This could be a major obstacle.
A gradual reopening is tactically preferable for Iran. A tactical leverage for Iran right now is that global oil stocks have been drawn down towards painful and increasingly dangerous levels with increasing risks for oil price spikes in mid-July to August. This together with US midterm elections on 3 November gives tactical leverage to Iran. Iran probably doesn’t want to fully give up on that leverage. A rapid, full reopening where global stocks are able to refill over the coming 60 days will significantly erode that leverage. If Iran reinstates a closure of the SoH after 60 days (if talks break down again), then the effect won’t be that impactful in terms of prices and the US midterm elections.
So a gradual and partial reopening where global markets gets the oil they need while they are unable to rebuild stocks could be a practical middle way for both parties. Trump can sell it as ”the SoH has reopened” and get affordable gasoline for US consumers. Iran can sell it as ”the SoH has fully reopened, but there is some friction” so flow is only 60-80% of normal.
Not much real demand destruction below $100/b. What we do know is that there is not much real price pain demand destruction for oil globally at an oil price below $100/b. A lot of demand-shock destruction. Fear. But demand should now come roaring back towards normal with fear for exceptionally high prices now is rapidly receding.
Sudden China demand destruction due to EVs? Bullocks. EV share of total Chinese carpool now around 13%. Share of new sales of EVs has reached 50%. This is a very gradual process. It doesn’t make oil demand fall like a rock over night. When EV new sales share reaches 100%, then the gasoline car pool will contract by some 5-10% per year. But that is only gasoline. Sudden reduction in Chinese oil demand is more about shock and risk.
Chinese crude oil imports will come roaring back. At what price? Today’s ”neutral” oil price is $70/b. That is the five year price which has steadily traded around the $70/b mark over the past 3-4 years. With still a risky picture one would think that China and the rest of the world will be big buyers of oil in the range of $70-85/b.
Global demand will likely snap back towards normal, forecasted demand and growth at such prices.
Physical reopening is a gradual process. The physical and practical reopening of the SoH will likely be gradual rather than sudden. And that probably suites Iran tactically as well.
Brent M1 price versus the Brent 5-yr (today’s ”normal” price)

Market is starting to take US/Iran headlines with a pinch of salt. Brent crude rose $2.8/b yesterday to an official close of $112.1/b. But after that it traded as low as $108.05/b before ending late night at around $109.7/b. Through the day it traded in a range of $106.87 – 112.72/b amid a flurry of news or rumors from Iran and the US. ”US temporary sanctions during negotiations” (falls alarm). ”We will bomb Iran” (not anyhow),… etc. While the market is still fluctuating to this kind of news flow, it is starting to take such headlines with a pinch of salt.
We’ll see. Maybe, maybe not. The Brent M1 contract is trading at $110.2/b this morning which very close to the average ticks through yesterday of $110.4/b.
Trump with bearish, verbal intervention whenever Brent trades above $110/b it seems. What seems to be a pattern is that Trump states something like ”very good negotiations going on with Iran”, ”New leaders in Iran are great,..”, ”Great progress in negotiations,…”, ”Deal in sight,..” etc whenever the Brent M1 contract trades above $110/b. An effort to cool the market. These hot air verbal interventions from Trump used to have a heavy bearish impact on prices, but they now seems to have less and less effect unless they are backed by reality.
As far as we can see there has been no real progress in the negotiations between the US and Iran with both sides still standing by their previous demands.
Iran is getting stronger while the cease fire lasts making a return to war for Trump yet harder. Iran is naturally in constant preparation for a return to war given Trump’s steady threats of bombing Iran again. Iran is naturally doing what ever is possible to prepare for a return to war. And every day the cease fire lasts it is better prepared. This naturally makes it more and more difficult and dangerous for the US to return to warring activity versus Iran as the consequences for energy infrastructure in the Persian Gulf will be more and more severe the longer the cease fire lasts. Israel seems to see it this way as well. That the war is not won and that current frozen state of a cease fire gives Iran opportunity to rebuild military and politically.
Global inventories are drawing down day by day. How much? In the meantime the Strait of Hormuz stays closed. There is varying measures and estimates of how much global inventories are drawing down. Our rough estimate, back of the envelope, is that global inventories are drawing down by at least some 10 mb/d or about 300 mb/d in a balance between loss of supply versus demand destruction. Other estimates we see are a monthly draw of 250-270 mb/d. The IEA only ’measured’ a draw in global observable stocks of 117 mb in April with oil on water rising 53 mb while on shore stocks fell 170 mb. But global stocks are hard to measure with large invisible, unmeasured stocks. As such a back of the envelope approach may be better.
Oil products is what the world is consuming. Oil product prices likely to rise while product stocks fall. Strategic Petroleum Reserves (SPR) are predominantly crude oil. Discharging oil from OECD SPR stocks, a sharp reduction in Chinese crude imports and a reduction in global refinery throughput of 6-7 mb/d has helped to keep crude oil markets satisfactorily supplied. But global inventories are drawing down none the less. And oil products is really what the world is consuming. So if global refinery throughput stays subdued, then demand will eventually have to match the supply of oil products. The likely path forward this summer is a steady draw down in jet fuel, diesel and gasoline. Higher prices for these. Then, if possible, higher refinery throughput and higher usage of crude in response to very profitable refinery margins. And lastly sharper draw in crude stocks and higher prices for these. But some 6 mb/d of oil products used to be exported through the Strait of Hormuz. And it may not be so easy to ramp up refinery activity across the world to compensate. Especially as Ukraine continues to damage Russian refineries as well as Russian crude production and export facilities.
Watch oil product stocks and prices as well as Brent calendar 2027. What to watch for this summer is thus oil product inventories falling and oil product premiums to crude rising. Another measure to watch is the Brent crude 2027 contract as it rises steadily day by day as the Strait of Hormuz stays closed and global oil inventories decline. The latter is close to the highest level since the start of the war and keeps rising.
The Brent M1 contract and the Brent 2027 prices and current price of jet fuel in Europe (ARA). All in USD/b

Our back of the envelope calculation of the global shortage created by the closure of the Strait of Hormuz. Note that 3.5 mb/d of discharge from SPR is also a draw. Note also that ’Forced demand loss’ of 2.5 mb/d is probably temporary and will fall back towards zero as logistics are sorted out leaving ’Price demand loss’ to do the job of balancing the market. Thus a shortfall of at least 9 mb/d created by the closure. More if SPR discharge is included and more if Forced demand loss recedes.

Brent is climbing higher. Front-month is at USD 106.3/bl this morning, close to a weekly high and a USD 9/bl jump from Mondays open. This is the move we flagged as a risk earlier in the week: the market shifting from ”a deal is around the corner” to ”this is going to take longer than we thought”.

Analyst Commodities, SEB
During April, rest-of-year Brent remained remarkably stable around USD 90/bl. A stability which rested on one single assumption: the SoH reopens around 1 May. That assumption is now slowly falling apart.
As we highlighted yesterday: every week of delay beyond 1 May adds (theoretically) ish USD 5/bl to the rest-of-year average, as global inventories draw 100 million barrels per week. i.e., a mid-May reopening implies rest-of-year Brent closer to USD 100/bl, and anything pushing into June or July takes us meaningfully higher.
What’s changed in the last 48 hours:
#1: The US military has formally warned that clearing suspected sea mines from SoH could take up to six months. That is a completely different timescale from what the financial market is pricing. Even a political deal tomorrow does not immediately reopen the strait.
#2: Trump has shifted his tone from urgency to ”strategic patience”. In yesterday’s press conference: ”Don’t rush me… I want a great deal.” The market is reading this as a president no longer feeling pressured by timelines, with the naval blockade running in the background.
#3: So far, the military activity is escalating, not de-escalating. Axios reports Iran is laying more mines in SoH. The US 3rd carrier strike group (USS George H.W. Bush) is arriving with two countermine vessels. Trump yesterday ordered the US Navy to destroy any Iranian boats caught laying mines. While CNN reports that the Pentagon is actively drawing up plans to strike Iranian SoH capabilities and individual Iranian military leaders if the ceasefire collapses. i.e., NOT a attitude consistent with an imminent deal!
Spot crude and product prices eased off the early-April highs on a combination of system rerouting and deal optimism. Both now weakening. Goldman estimates April Gulf output is reduced by 14.5 mbl/d, or 57% of pre-war supply, a number that keeps getting worse the longer this drags on.
Demand-side adaptation is ongoing: S. Korea has cut its Middle East crude dependence from 69% to 56% by pulling more from the Americas and Africa, and Japan is kicking off a second round of SPR releases from 1 May. But SPRs are finite.
Ref. to the negotiations, we should not bet on speed. The current Iranian leadership is dominated by genuine hardliners willing to absorb economic pain and run the clock to extract concessions. That is not a setup for a rapid resolution. US/Israeli media briefings keep framing the delay as ”internal Iranian divisions”, the reality is more complicated and points toward weeks and months, not days.
Our point is that the complexity is large, and higher prices have only just started (given a scenario where the negotiations drag out in time). The market spent April leaning on the USD 90/bl rest-of-year assumption; that case is diminishing by the hour. If ”early May reopening” is replaced by ”June, July or later” over the next week or two, both crude and products have meaningful room to reprice higher from here. There is a high risk being short energy and betting on any immediate political resolution(!).


Vattenfalls och Industrikrafts kärnkraftsbolag Videberg Kraft har valt Rolls-Royce SMR
Selling down on a ”deal”

Sommarväder skapar prisrally på elbörsen
Oil product price pain is set to rise as the Strait of Hormuz stays closed into summer

Solkraften pressar elpriserna dagtid
Oil product price pain is set to rise as the Strait of Hormuz stays closed into summer
Sommarväder skapar prisrally på elbörsen
Vattenfalls och Industrikrafts kärnkraftsbolag Videberg Kraft har valt Rolls-Royce SMR
Selling down on a ”deal”
-
Analys4 veckor sedan
Oil product price pain is set to rise as the Strait of Hormuz stays closed into summer
-
Nyheter2 veckor sedan
Sommarväder skapar prisrally på elbörsen
-
 Nyheter2 dagar sedan
Vattenfalls och Industrikrafts kärnkraftsbolag Videberg Kraft har valt Rolls-Royce SMR
-
Analys2 dagar sedan
Selling down on a ”deal”