

Analys
SEB Råvarubrev 13 december 2016

 MARKNADEN I KORTHET
Veckans huvudattraktion är onsdagens räntebesked från Federal Reserve. Marknaden har har fullt ut prisat in en höjning med 0,25 % varför denna inte bör bli någon överraskning (överraskning torde det dock bli om höjningen uteblir). Fokus bör istället ligga på vad FED säger om framtida höjningar (antal och takt) vilket lär sätta tonen för både obligationer och aktier. I Italien har, efter Renzis avgång, Gentiloni utsetts till ny premiärminister, vilket stärker vår uppfattning om att det inte blir något nyval utan ordinarier val 2018 är det som gäller. I Sverige skedde under måndagen årets insättning på premiepensionskontona (PPM). Årets insättning blev 38 miljarder kronor (varav vi räknar med att cirka 25mdr går till utländska fonder). Svensk inflation ligger fortfarande en bra bit under Riksbankens mål så frågan kvarstår, kommer Riksbanken att agera vid nästa veckas (21/12) möte?

Anders Söderberg, Redaktör
Råvaror: I och med att OPEC i lördags kom överens med icke-OPEC medlemmar att dessa ska minska sin produktion med 558,000 fpd (där Ryssland ska stå för 300,000) så började veckan med stigande priser. Uppgången har dock i skrivande stund kommit av sig något och skulle veckan sluta i nivå med förra fredagens stängning (~$54,33/fat) så skulle vi inte bli förvånade om en viss vinsthemtagning inför årsskiftet sker. Basmetaller har mer eller mindre fortsatt att handla i ett intervall, vi anser fortfarande att de flesta av dem har stigit för mycket för fort varför korrektionsrisken är fortsatt hög. Elmarknaden (både spot och termin) ser ut nu ut att ha hittat fast mark och priserna är sedan förra veckan stigit (el, kol och utsläppsrätter). Ädelmetaller har det fortsatt jobbigt även om nedgången ser ut att vara i avtagande. Kaffe är efter den brutala nedgången kraftigt översålt.
Valuta: Dollarn har överlag fortsatt att gå starkt (mot kronan har vi som vi tidigare pekat på tappat fart då kronan i sig själv inte längre faller så hävstången stark dollar – svag krona är borta). EUR/USD föll som en sten efter ECB’s möte förra veckan. Vi får se vad efterdyningarna efter FED’s räntebesked onsdag kan leda till. Den turkiska liran är under hård press och USD/TRY har nått nya rekordnivåer.
Börser: Inställningen till aktiemarknaden är fortsatt positiv men vi börjar se vissa tecken på överdrift då många marknader nu krupit upp i överköpt territorium (t.ex. RSI (relativt styrke index), något vi inte sett sedan februari 2015. VIX volatilitetsindex har också stigit något sedan förra veckan.
Räntor: Långa räntor har fortsatt att stiga men även här ser vi utmattningstecken varför vi inte skulle bli förvånade att se en viss lättnad inom kort (kanske FED blir den utlösande faktorn).
OBSERVATIONER I SAMMANDRAG
- Olja – dags för rallyt att ta en paus?
- Koppar – fortsatt motvind.
- Zink – efter en fördubbling under 2016, dags att hämta andan!?
- El – uppgång sedan förra veckan.
- USD/SEK – FED den 14:e och Riksbanken den 21:a sätter tonen.
- OMXS30 – nu uppe vid ett viktigt motstånd.
En placering i certifikat och warranter är förknippat med risker. Du kan förlora hela ditt investerade kapital. Läs mer om riskerna i SEB:s offentliggjorda Grundprospekt för certifikat- och warrantprogram på seb.se/cert eller seb.se/mini
OLJA BRENT
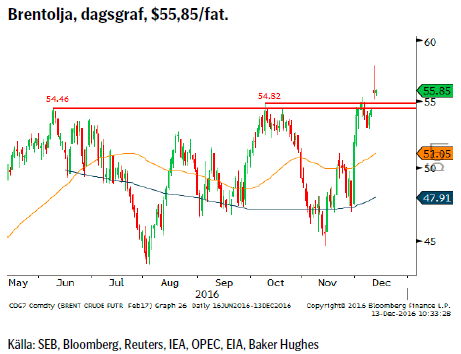 Så fick vi i lördags även ett produktionsbegränsningsavtal mellan OPEC och icke OPEC-medlemmar på plats vilket mottogs positivt av marknaden som raskt handlade upp oljepriset med 4-5 %. De länder som tillsammans ska begränsa sin produktion med 558,000 fpd är Azerbajdzjan, Kazakstan, Mexiko, Oman och Ryssland, där den sistnämnda bär den största bördan om 300,000 fpd. Det återstår nu att se om produktionsbegränsningarna träder i kraft vid årsskiftet och huruvida det kommer att fuskas eller ej. Dessutom finns det flera faktorer som bör kunna ge mer olja framöver. För det första har amerikanska skifferproducenter nu starkare incitament (högre pris) för ökad produktion, vilket också kan ses i form av ökad terminsförsäljning för 2017-19. För det andra så har olje-kurvan gått från kontango till mer eller mindre backwardation vilket gör det oattraktivt att sitta på framför allt flytande lager (lagerkostnaden) vilket bör skynda på avvecklingen av dessa långa fysiska positioner. För det tredje så kan, under OPEC överenskommelsen, både Libyen och Nigeria öka sin produktion.
Konklusion: Alla goda nyheter bör nu vara mer eller mindre inkluderade i dagens pris varför risken för en reaktion (vinsthemtagningar spekulativa positioner) bör öka.
OBSERVATIONER
+ Överenskommelsen om ett produktionstak om 32,5m fpd.
+ Den spekulativa långa nettopositioneringen har nått en ny rekordnivå (korta kontrakt har stängts och långa öppnats).
+ Nya oroligheter i Nigeria.
+ Situationen i Venezuela är fortsatt mycket osäker.
+ Tekniskt så har vi nog stigit lite för mycket, lite för fort.
– Den spekulativa långa nettopositioneringen rekordstor.
– Många konsumenter har prissäkrat en stor del av 2017 behovet
– Fortsatt god produktivitetsutveckling hos skifferoljeprod.
– Amerikanska skifferoljeprod. ökar produktionen.
– Libysk och Nigeriansk produktion bör öka framöver.
– Antalet amerikanska borriggar fortsätter stadigt att öka (ökad oljeproduktion följer med 3-6månaders eftersläpning).
– Tekniskt så har vi en överköpt situation.
Tillgängliga certifikat:
BULL OLJA X1, X2, X4, X5, & X10 S
BEAR OLJA X1, X2, X4, X5 & X10 S
KOPPAR
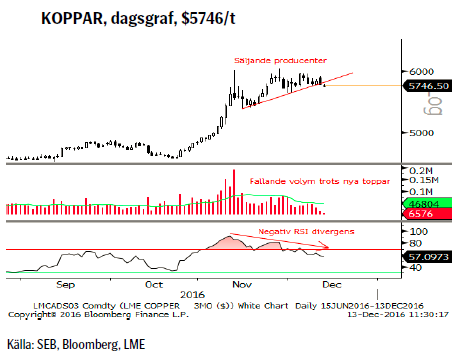 Vi anser fortfarande att kopparrallyt är överdrivet, för mycket, för fort, varför risken för åtminstone en slagig intervallhandel eller en regelrätt priskorrektion bör vara stor. Ny statistik visar också att lagren under de senaste veckorna (med en acceleration senaste dagarna) ökat kraftigt.
Konklusion: Vi anser fortfarande att risken för en korrektion är hög.
OBSERVATIONER
+ Trump’s uttalanden har spätt på förväntningarna om stora infrastrukturinvesteringar (oklart hur detta ska finansieras om skatterna samtidigt ska sänkas samt att det är en lång ledtid för denna typ av projekt).
+ Kv. 3 statistik visade på att bruten malm i högre grad varit av lägre kvalitet vilket ökat spekulationer om att flera stora gruvor passerat max produktion (utan nya investeringar).
+ Marknaden tror att årets historiskt få produktionsstörningar inte upprepar sig 2017.
+ Kinesisk efterfrågan håller ställningarna.
– LME statistiken visar att lagren nu ökar snabbt (högsta nivån sedan november 2015).
– Kinesiska myndigheter försöker minska spekulationen.
– Producenter gör nu som vi föreslog för ett tag sedan och låser in priset för framtida produktion.
– Koppar har nu gjort sitt ”komma ikapp” rally.
– Ny rekordlång spekulativ positionering (långa kontrakt).
– Kopparmarknaden befinner sig inte i underskott.
– Givet fortsatt fallande produktionskostnader bör produktionen komma att öka (då marginalerna nu är bättre).
– Fallande volym i uppgång är svaghet.
– Tekniskt så ser vi att köparna gång efter annan misslyckas runt 6,000/ton området.
– Tekniskt har vi en negativ divergens (högre toppar i pris – lägre toppar i styrkeindex).
Tillgängliga certifikat:
BULL KOPPAR X1, X2, & X4 S
BEAR KOPPAR X2, & X4 S
ZINK
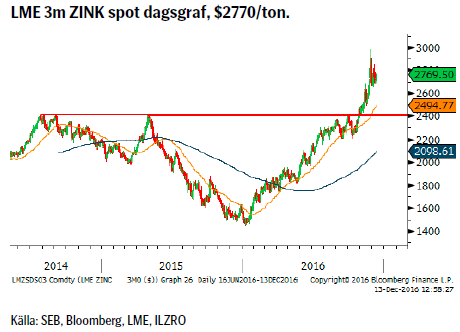 Under 2016 har zinkpriset mer eller mindre fördubblats men efter den senaste tjurrusningen (efter det amerikanska presidentvalet) anser vi att priset nog sprungit ifrån verkligheten. Även om en ny topp förvisso inte kan uteslutas (säsongsmönstret har en bias mot stigande pris tidigt på det nya året) så pekar ett flertal faktorer mot att vi nu bör gå in i en betydligt lugnare fas. Så tittar vi en bit framåt så ser vi mer av konsolidering (och eventuellt korrektion) framför oss. 2017 bör leda till ökad produktion, dock inte tillräcklig för att marknaden ska hamna i ett överskott igen men med resultat att vi ser ett minskat underskott.
Konklusion: Sannolikt övergår nu zinkmarknaden från en kraftigt stigande trend till en mer sidledes, konsoliderande marknad.
OBSERVATIONER
+ Lagren är historiskt låga (men upp från botten i somras).
+ Starkare än förväntad Kinesisk statistik i november.
+ Amerikansk bilförsäljning ligger kvar på höga nivåer.
+ ”Trump-onomics”.
+ Ökat inflationstryck gör ”fysiska” tillgångar attraktivare.
+ Lägre produktion 2016 än 2015.
+ Flera utbrutna gruvor tvingades stänga under hösten 2015.
– Stigande produktion förväntas under 2017 (dock i en så pass lugn takt att förhoppningen är att priset inte ska falla) då flera gruvbolag som t.ex. Glencore och Lundin Mining ser ut att så sakteliga öka sin produktion igen.
– Volymen (handeln på LME) är fallande.
– Nedtrappning av kinesisk stimulans nästa år.
– Kinesiska ansträngningar att minska det spekulativa inslaget (marginalkrav, transaktionskostnader, positionsstorlek etc.).
– Tekniskt uppvisar trenden nu flera tecken på utmattning.
Tillgängliga certifikat:
BULL ZINK X1, X2, & X4 S
BEAR ZINK X2 & X4 S
EL
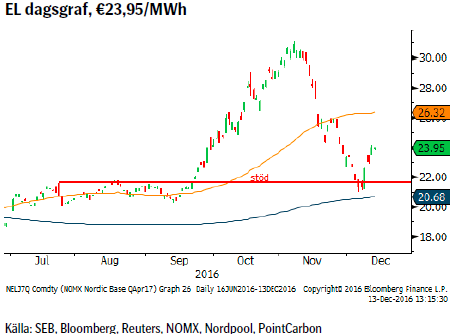 Elpriset (både spot och termin) har under den senaste veckan rört sig uppåt mest beroende på att vi nu har kommit in i en period med kallare väder (och precis som tidigare så är den dåliga hydrobalansen en konstant risk för spotpriset men mindre så för terminspriset som nu snart rullar över till andra kvartalet (och första kvartalet går till avräkning)). Kvartalsterminspriset blir därmed mer exponerat mot snödjupet då detta ger en fingervisning om hur vårfloden kan komma att bli. Kom ihåg att förra årets dåliga vårflod är en av grundorsakerna till den dåliga hydrobalansen.
Konklusion: Temperatur (spotpris) och snömängd (terminspris) är just nu drivkrafterna.
OBSERVATIONER
+ Priset på kol och utsläppsrätter har åter vänt upp.
+ Hydrobalansen befinner sig i ett fortsatt underskott om cirka 11/12 TWh, återstår dock att se om vi kan få en ytterligare förbättring gällande kvartal 2, för vintern (spotpriset) kan ju inte situationen förändras speciellt mycket nu när nederbörden kommer i fast form (här blir snödjupet en viktig information).
+ En begränsning av överföringskapacitet från Norge kan förvärra en bristsituation vid riktigt kall väderlek.
+ Kallt väder är just nu den enskilt största risken för högre priser.
+ Fransk kärnkrafts tillgänglighet är just nu på lägsta nivå för den senaste tio-års perioden och den nationella nätoperatören varnar för ökad risk för el-brist (för första gången på fyra år har U.K. exporterat el till Frankrike). Enligt plan ska alla vara tillbaka på nätet senast den 18/1-2017.
+ Vattenfyllnadsgraden i vattenmagsinen har fallit från 67,1 % till 65,3 % (vilket är cirka 25 % under normalvärdet).
+ Tekniskt vände vi strax under stödet i €21,80 -21,60 området men är nu tillbaka ovanför.
– Alla kärnkraftsreaktorer (ja utom O2:an men den ska, bestämdes det i oktober 2015, att stängas i förtid varför den aldrig återstartades efter senaste revision) går sedan i lördags, första gången på nästan två år, med normal produktion.
– Snödjupet är bättre än vad det var på dagen för ett år sedan.
– Kinas regering har givit order om ökad kolproduktion.
– Risk för att marknaden har överreagerat på problemen inom fransk kärnkraft (samt att vi kommer allt närmare den tidpunkt när revisionerna ska vara klara).
Tillgängliga certifikat:
BULL EL X2, X4 &X5 S
BEAR EL X1, X2, X4 & X5 S
USD/SEK
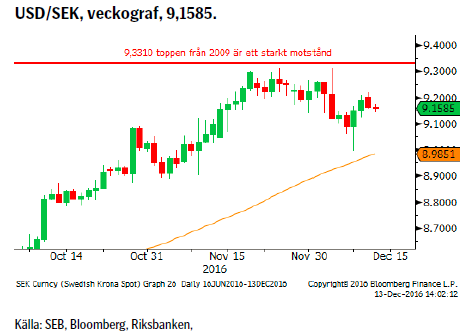 De senaste tio dagarna har vi verkligen åkt berg och dalbana. Efter den senaste toppen (9,3110) åkte vi på bara några dagar ned till 9,0000 nivån innan vi återvände högre. Beteendet faller väl in i med vad vi varnat för dvs. att det nu bara är dollarn som driver valutaparet (då kronan inte längre försvagas mot euron, nu är det snarare det omvända som gäller). Kronan har också klarat årets premiepensinsinsättning bättre än normalt (många kronor som ska säljas när en stor del av de 38 miljarderna placeras utomlands). Många är prognoserna för 2017 som talar för högre dollar, vi tror på ytterligare en period av konsolidering innan så möjligtvis blir fallet. Fed’s räntebesked 14/12 och Riksbankens dito den 21/12 är självfallet av stort intresse för utvecklingen.
Konklusion: Än så länge ser vi nedgången som korrektiv.
OBSERVATIONER
+ Svag svensk inflation ökar sannolikheten för att RB agerar.
+ ”Trumponomics” ger fortsatt en positiv input.
+ Fortsatt, för att inte säga konstant, kris för Italienska banker.
+ Amerikanska aktier är i ropet (alla index har gjort nya toppar).
+ En till fullo inprisad räntehöjning i USA den 14 december.
+ Trumps tal om stora infrastrukturinvesteringar har fått marknaden att köpa råvaror, aktier, dollar och sälja obligationer.
+ Räntedifferensen mellan USA och Sverige bör fortsätta att öka (vilket gjort kronan till en finansieringsvaluta).
+ Dollarcykeln (åtta årscykeln sedan 1970-talet) pekar på en ny topp under 2017.
+ Tekniskt så befinner vi oss i en positiv konsolidering.
– Amerikanska aktier börjar se dyra ut jämfört med Europeiska.
– Det positiva säsongsmönstret är slut.
– Att Riksbanken inte levererar mer/fler stimulanser.
– Att FED igen (december) skjuter upp nästa höjning.
– Mycket starkt motstånd vid 9,33.
Tillgängliga certifikat:
BULL USDSEK X1 & X4 S
BEAR USDSEK X4 S
OMXS30 (TEKNISK UTBLICK)
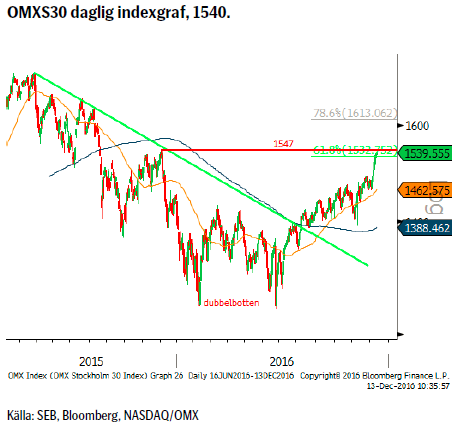 Marknaden har sedan slutet av den lilla korrektionen lagt i överväxeln och har i skrivande stund (om vi nu stänger högre idag) stigit sju dagar på rad (något vi senast såg under första halvan av juli). Vi har nu nått ett viktigt motstånd i form av korrektionstoppen vid 1547 varför vi i kombination med det mest överköpta läget sedan februari 2015 ser en ökad risk för en rekyl (när brottet över 1547 kommer förstärks den längre positiva bilden).
Konklusion: Det kan bli en paus i uppgången givet det viktiga motståndet vid 1533/1547.
OBSERVATIONER
+ Priset ligger över 55 och 233v medelvärden.
+ Priset har brutit upp över 2015 års topplinje.
+ Mönstret av fallande toppar från våren 2015 har brutits.
+ 55 och 233d mv har nu båda två positiv lutningar och mellanrummet dem emellan ökar (= bra momentum).
+ Ett gyllene kors på plats (55d mv korsar upp över 233d mv).
+ Långsiktig dubbelbotten vid 1240/46 stödet.
– Har nått 1533/1547 motståndet.
– Markanden är nu överköpt.
– Fortsatt risk för stigande obligationsräntor.
Tillgängliga certifikat:
BULL OMX X5 S
BEAR OMX X5 S
INFORMATION OM REKOMMENDATIONER
Denna publikation är ett marknadsföringsmaterial för SEBs certifikat-produkter. I och med den nya Marknadsmissbruksförordningen vilken trädde i kraft den tredje juli 2016 har vi inte längre möjlighet att inkludera investeringsrekommendationer rörande certifikat-produkterna.
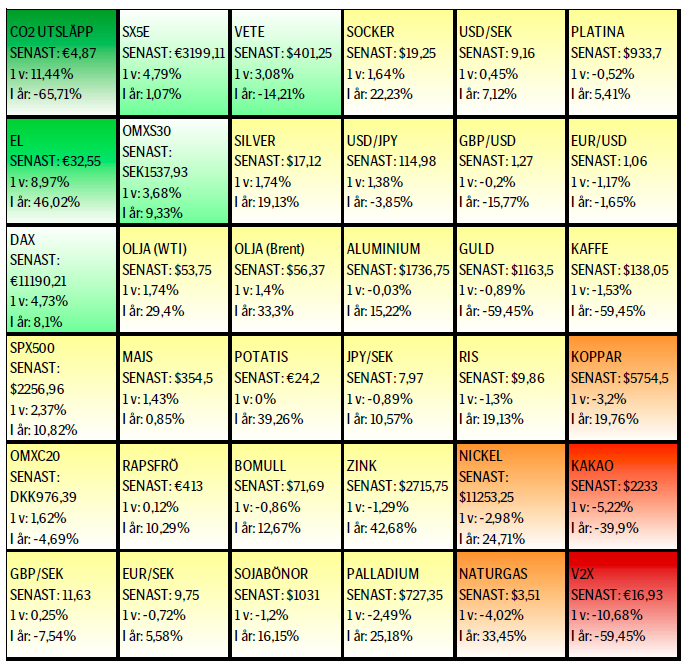
UTVECKLING SENASTE VECKAN SAMT SEDAN ÅRETS BÖRJAN
[box]SEB Veckobrev Veckans råvarukommentar är producerat av SEB:s Commodities Sales desk och publiceras i samarbete och med tillstånd på Råvarumarknaden.se[/box]
KÄLLOR
Bloomberg, Reuters, SEB
VILLKOR
För varje enskilt certifikat/mini future finns Slutliga Villkor som anger de fullständiga villkoren. Slutliga Villkor finns tillgängligt på kurssidan för respektive certifikat/mini future på www.seb.se, Börs & finans, fliken Strukturerade placeringar.
RISKER
En sammanfattning av de risker som är förknippade med Börshandlade certifikat generellt finns i Produktbroschyren för respektive certifikat eller mini future som är tillgängligt på seb.se/cert respektive seb.se/mini. För en fullständig bild av riskerna behöver du ta del av SEB:s offentliggjorda Grundprospekt för Certifikat- och Warrantprogram som är publicerat på www.seb.se/cert respektive seb.se/mini.
DISCLAIMER
Detta marknadsföringsmaterial, framtaget av SEB:s Commodities Sales desk, har upprättats enbart i informationssyfte.
Även om innehållet är baserat på källor som SEB bedömt som tillförlitliga ansvarar SEB inte för fel eller brister i informationen. Den utgör inte oberoende, objektiv investeringsanalys och skyddas därför inte av de bestämmelser som SEB har infört för att förebygga potentiella intressekonflikter. Yttranden från SEB:s Commodities Sales desk kan vara oförenliga med tidigare publicerat material från SEB, då den senare hänvisas uppmanas du att läsa den fullständiga rapporten innan någon åtgärd vidtas.
Dokumentationen utgör inte någon investeringsrådgivning och tillhandahålls till dig utan hänsyn till dina investeringsmål. Du uppmanas att självständigt bedöma och komplettera uppgifterna i denna dokumentation och att basera dina investeringsbeslut på material som bedöms erforderligt. Alla framåtblickande uttalanden, åsikter och förväntningar är föremål för risker, osäkerheter och andra faktorer och kan orsaka att det faktiska resultatet avviker väsentligt från det förväntade. Historisk avkastning är ingen garanti för framtida resultat. Detta dokument utgör inte ett erbjudande att teckna några värdepapper eller andra finansiella instrument. SEB svarar inte för förlust eller skada – direkt eller indirekt, eller av vad slag det vara må – som kan uppkomma till följd av användandet av detta material eller dess innehåll.
Observera att det kan förekomma att SEB, dess ledamöter, dess anställda eller dess moder- och/eller dotterbolag vid olika tillfällen innehar, har innehaft eller kommer att inneha aktier, positioner, rådgivningsuppdrag i samband med corporate finance-transaktioner, investment- eller merchantbanking-uppdrag och/eller lån i de bolag/finansiella instrument som nämns i materialet.
Materialet är avsett för mottagaren, all spridning, distribuering mångfaldigande eller annan användning av detta meddelande får inte ske utan SEB:s medgivande. Materialet riktar sig inte till personer vars medverkan kräver ytterligare prospekt, registrerings- eller andra åtgärder än vad som följer av svensk rätt. Det åligger var och en att iaktta sådana restriktioner. Materialet får inte distribueras i eller till land där distribution kräver ovan nämnda åtgärder eller strider mot reglering i sådant land. Materialet riktar sig således inte till fysiska eller juridiska personer hemmahörande i USA eller i något annat land där publicering eller tillhandahållande av materialet är förbjudet eller strider mot tillämpliga bestämmelser i landet.
Oaktat detta får SEB tillåta omfördelning av materialet till utvald tredje part i enlighet med gällande avtal. Materialet får inte spridas till fysiska eller juridiska personer som är medborgare eller har hemvist i ett land där sådan spridning är otillåten enligt tillämplig lag eller annan bestämmelse.
Skandinaviska Enskilda Banken AB (publ) är ett publikt aktiebolag och står under tillsyn av Finansinspektionen samt de lokala finansiella tillsynsmyndigheter i varje jurisdiktionen där SEB har filial eller dotterbolag.
Market is starting to take US/Iran headlines with a pinch of salt. Brent crude rose $2.8/b yesterday to an official close of $112.1/b. But after that it traded as low as $108.05/b before ending late night at around $109.7/b. Through the day it traded in a range of $106.87 – 112.72/b amid a flurry of news or rumors from Iran and the US. ”US temporary sanctions during negotiations” (falls alarm). ”We will bomb Iran” (not anyhow),… etc. While the market is still fluctuating to this kind of news flow, it is starting to take such headlines with a pinch of salt.

We’ll see. Maybe, maybe not. The Brent M1 contract is trading at $110.2/b this morning which very close to the average ticks through yesterday of $110.4/b.
Trump with bearish, verbal intervention whenever Brent trades above $110/b it seems. What seems to be a pattern is that Trump states something like ”very good negotiations going on with Iran”, ”New leaders in Iran are great,..”, ”Great progress in negotiations,…”, ”Deal in sight,..” etc whenever the Brent M1 contract trades above $110/b. An effort to cool the market. These hot air verbal interventions from Trump used to have a heavy bearish impact on prices, but they now seems to have less and less effect unless they are backed by reality.
As far as we can see there has been no real progress in the negotiations between the US and Iran with both sides still standing by their previous demands.
Iran is getting stronger while the cease fire lasts making a return to war for Trump yet harder. Iran is naturally in constant preparation for a return to war given Trump’s steady threats of bombing Iran again. Iran is naturally doing what ever is possible to prepare for a return to war. And every day the cease fire lasts it is better prepared. This naturally makes it more and more difficult and dangerous for the US to return to warring activity versus Iran as the consequences for energy infrastructure in the Persian Gulf will be more and more severe the longer the cease fire lasts. Israel seems to see it this way as well. That the war is not won and that current frozen state of a cease fire gives Iran opportunity to rebuild military and politically.
Global inventories are drawing down day by day. How much? In the meantime the Strait of Hormuz stays closed. There is varying measures and estimates of how much global inventories are drawing down. Our rough estimate, back of the envelope, is that global inventories are drawing down by at least some 10 mb/d or about 300 mb/d in a balance between loss of supply versus demand destruction. Other estimates we see are a monthly draw of 250-270 mb/d. The IEA only ’measured’ a draw in global observable stocks of 117 mb in April with oil on water rising 53 mb while on shore stocks fell 170 mb. But global stocks are hard to measure with large invisible, unmeasured stocks. As such a back of the envelope approach may be better.
Oil products is what the world is consuming. Oil product prices likely to rise while product stocks fall. Strategic Petroleum Reserves (SPR) are predominantly crude oil. Discharging oil from OECD SPR stocks, a sharp reduction in Chinese crude imports and a reduction in global refinery throughput of 6-7 mb/d has helped to keep crude oil markets satisfactorily supplied. But global inventories are drawing down none the less. And oil products is really what the world is consuming. So if global refinery throughput stays subdued, then demand will eventually have to match the supply of oil products. The likely path forward this summer is a steady draw down in jet fuel, diesel and gasoline. Higher prices for these. Then, if possible, higher refinery throughput and higher usage of crude in response to very profitable refinery margins. And lastly sharper draw in crude stocks and higher prices for these. But some 6 mb/d of oil products used to be exported through the Strait of Hormuz. And it may not be so easy to ramp up refinery activity across the world to compensate. Especially as Ukraine continues to damage Russian refineries as well as Russian crude production and export facilities.
Watch oil product stocks and prices as well as Brent calendar 2027. What to watch for this summer is thus oil product inventories falling and oil product premiums to crude rising. Another measure to watch is the Brent crude 2027 contract as it rises steadily day by day as the Strait of Hormuz stays closed and global oil inventories decline. The latter is close to the highest level since the start of the war and keeps rising.
The Brent M1 contract and the Brent 2027 prices and current price of jet fuel in Europe (ARA). All in USD/b

Our back of the envelope calculation of the global shortage created by the closure of the Strait of Hormuz. Note that 3.5 mb/d of discharge from SPR is also a draw. Note also that ’Forced demand loss’ of 2.5 mb/d is probably temporary and will fall back towards zero as logistics are sorted out leaving ’Price demand loss’ to do the job of balancing the market. Thus a shortfall of at least 9 mb/d created by the closure. More if SPR discharge is included and more if Forced demand loss recedes.

Brent is climbing higher. Front-month is at USD 106.3/bl this morning, close to a weekly high and a USD 9/bl jump from Mondays open. This is the move we flagged as a risk earlier in the week: the market shifting from ”a deal is around the corner” to ”this is going to take longer than we thought”.

Analyst Commodities, SEB
During April, rest-of-year Brent remained remarkably stable around USD 90/bl. A stability which rested on one single assumption: the SoH reopens around 1 May. That assumption is now slowly falling apart.
As we highlighted yesterday: every week of delay beyond 1 May adds (theoretically) ish USD 5/bl to the rest-of-year average, as global inventories draw 100 million barrels per week. i.e., a mid-May reopening implies rest-of-year Brent closer to USD 100/bl, and anything pushing into June or July takes us meaningfully higher.
What’s changed in the last 48 hours:
#1: The US military has formally warned that clearing suspected sea mines from SoH could take up to six months. That is a completely different timescale from what the financial market is pricing. Even a political deal tomorrow does not immediately reopen the strait.
#2: Trump has shifted his tone from urgency to ”strategic patience”. In yesterday’s press conference: ”Don’t rush me… I want a great deal.” The market is reading this as a president no longer feeling pressured by timelines, with the naval blockade running in the background.
#3: So far, the military activity is escalating, not de-escalating. Axios reports Iran is laying more mines in SoH. The US 3rd carrier strike group (USS George H.W. Bush) is arriving with two countermine vessels. Trump yesterday ordered the US Navy to destroy any Iranian boats caught laying mines. While CNN reports that the Pentagon is actively drawing up plans to strike Iranian SoH capabilities and individual Iranian military leaders if the ceasefire collapses. i.e., NOT a attitude consistent with an imminent deal!
Spot crude and product prices eased off the early-April highs on a combination of system rerouting and deal optimism. Both now weakening. Goldman estimates April Gulf output is reduced by 14.5 mbl/d, or 57% of pre-war supply, a number that keeps getting worse the longer this drags on.
Demand-side adaptation is ongoing: S. Korea has cut its Middle East crude dependence from 69% to 56% by pulling more from the Americas and Africa, and Japan is kicking off a second round of SPR releases from 1 May. But SPRs are finite.
Ref. to the negotiations, we should not bet on speed. The current Iranian leadership is dominated by genuine hardliners willing to absorb economic pain and run the clock to extract concessions. That is not a setup for a rapid resolution. US/Israeli media briefings keep framing the delay as ”internal Iranian divisions”, the reality is more complicated and points toward weeks and months, not days.
Our point is that the complexity is large, and higher prices have only just started (given a scenario where the negotiations drag out in time). The market spent April leaning on the USD 90/bl rest-of-year assumption; that case is diminishing by the hour. If ”early May reopening” is replaced by ”June, July or later” over the next week or two, both crude and products have meaningful room to reprice higher from here. There is a high risk being short energy and betting on any immediate political resolution(!).
Down on Friday. Up on Monday. The Brent June crude oil contract traded down 5.1% last week to a close of $90.38/b. It reached a high of $103.87/b last Monday and a low of $86.09/b on Friday as Iran announced that the Strait of Hormuz was fully open for transit. That quickly changed over the weekend as the US upheld its blockade of Iranian oil exports while Iran naturally responded by closing the SoH again. The US blew a hole in the engine room of the Iranian ship TOUSKA and took custody of the ship on Sunday. Brent crude is up 5.6% this morning to $95.4/b.
The cease-fire is expiring tomorrow. The US has said it will send a delegation for a second round of negotiations in Islamabad in Pakistan. But Iran has for now rejected a second round of talks as it views US demands as unrealistic and excessive while the US is also blocking the Strait of Hormuz.
While Brent is up 5% this morning, the financial market is still very optimistic that progress will be made. That talks will continue and that the SoH will fully open by the start of May which is consistent with a rest-of-year average Brent crude oil price of around $90/b with the market now trading that balance at around $88/b.
Financial optimism vs. physical deterioration. We have a divergence where the financial market is trading negotiations, improvements and resolution while at the same time the physical market is deteriorating day by day. Physical oil flows remain constrained by disrupted flows, longer voyage times and elevated freight and insurance costs.
Financial markets are betting that a US/Iranian resolution will save us in time from violent shortages down the road. But every day that the SoH remains closed is bringing us closer to a potentially very painful point of shortages and much higher prices.
The US blockade is also a weapon of leverage against its European and Asian allies. When Iran closed the SoH it held the world economy as a hostage against the US. The US blockade of the SoH is of course blocking Iranian oil exports. But it is also an action of disruption directed towards Europe and Asia. The US has called for the rest of the world to engaged in the war with Iran: ”If you want oil from the Persian Gulf, then go and get it”. A risk is that the US plays brinkmanship with the global oil market directed towards its European and Asian allies and maybe even towards China to force them to engage and take part. Maybe unthinkable. But unthinkable has become the norm with Trump in the White House.


Sommarväder skapar prisrally på elbörsen
Oil product price pain is set to rise as the Strait of Hormuz stays closed into summer

Solkraften pressar elpriserna dagtid

Michel Gubel ger sin syn på oljemarknaden