Analys
US shale oil productivity update – OPEC could choke on strongly reviving US shale oil production in 2018 if oil prices hold up in H1-17


Crude oil comment – US shale oil productivity update – OPEC likely to choke down the road on strongly reviving US shale oil production if oil prices hold up in H1-17
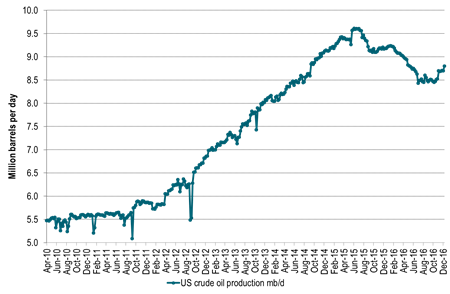
The only thing which can prevent a strong rise in US shale oil rig count going forward is muted crude oil prices. The physical crude oil production effect of an additional 25 shale oil rigs into the market per month in H1-17 won’t really hit the market before H2-17 and mostly 2018. Thus price action may stay oblivious to the coming wave of US shale oil production if it disregards a potentially continued solid rise in US shale oil rigs in H1-17 on the back of OPEC cuts and associated higher prices. At the moment we can see a marginal increase in US shale production projected for January 2017. In weekly data we can see that US crude production bottomed out in September and rose 99 kb/d w/w last week.
We will not see the actual realisation of US shale oil crude production in the spot market following the rig rise in H2-16 and potentially H1-17 for quite some time. I.e. not really before H2-17 and 2018. What we can see at the moment is the reflected hedging activity from the US shale oil players who hedge on the curve for 2018 and 2019 pushing it down. Shale oil players securing their investments in newly initiated activity having been burned heavily in the previous boom and bust. That is the immediate “shadow effect” hitting the market and the crude oil curve here and now as a reflection of the rising rig count which is again an effect of higher oil prices.
According to the latest US EIA’s Drilling productivity report there were 23 shale oil rigs added per month from the start of June until November. In November alone there were 34 rigs added.
The WTI 15mth price has averaged $51.6/b since the start of June. At the time of writing it trades at $54.3/b but recently traded all the way up to $56.4/b.
Note that in the below US crude oil production scenarios we have only assumed an additional 25 rigs per month for H1-17 for Ch10 and Ch11. That is not much more than the +23 added shale oil rigs per month since June observed by the US EIA in their December drilling productivity report. Thus assuming +25 rigs per month in H1-17 is not really acceleration in rig count addition versus H2-16. However, if the crude oil price was to be significantly higher, especially the WTI 15 mth crude price, then one probably should assume a substantially higher inflow of rigs in H1-17 than what we have witnessed in H2-16.
What this all tells us is that the oil price will be highly responsive to changes in the oil market balance versus OPEC cuts or whether Libyan production will average 1 mb/d in 2017 or just 0.5 mb/d or whether global oil demand growth will be much stronger or not in 2017 or whether Russia will actually be good on its pledged cuts for H1-17 etc. Then again US shale oil rig count and thereafter production will be highly responsive to oil prices again. We have shale oil boom and bust behind us. Now we have the shale oil adaptability before us. We cannot predict all the possible uncertain events which might hit the oil market supply/demand balance in 2017 and thus impact the oil price. We can however say a lot about the responsiveness for US shale oil production and thus how the oil market dynamically will behave. Thus if OPEC gives the market elevated oil prices in H1-17, then US shale oil will give the market a serious Blue Monday in H2-17 or 2018.
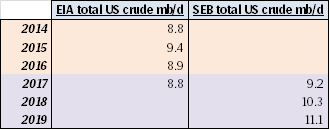
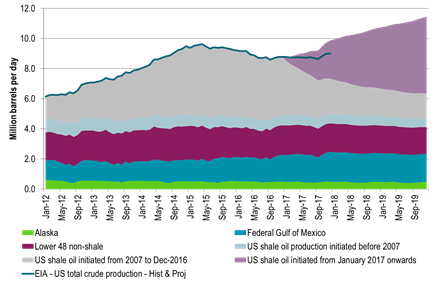
What the three US crude oil production scenarios below tells us is that US crude production in 2018 is highly impacted by how many rigs are added in H1-17. If there are no more rigs in H1-17, then US crude production is good at 9.2 mb/d in 2018. However, if we just continue on the trend from H2-16 with close to 25 extra rigs per month, then US crude production jumps to 10 mb/d in 2018. Thus the 2018 global supply/demand balance is really at play in H1-17. Our numbers are of course a model. The model still fairly well shows the magnitude of sensitivities at play.
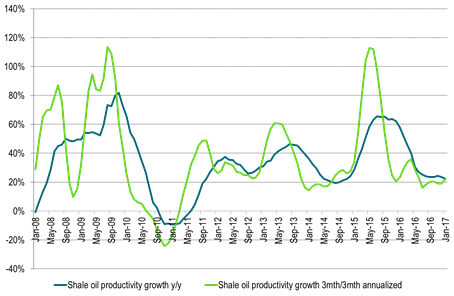
Ch1: US shale oil volume productivity growth continues to hold up at 20% per annum
Both in terms of y/y as well as 3mth/3mth annualized
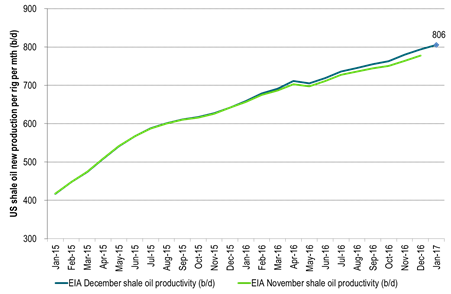
Ch2: US shale oil volume productivity set to rise to 806 b/d per rig per month in January
Calculated for the 4 main US shale oil regions: Bakken, Eagle Ford, Nibrara and Permian
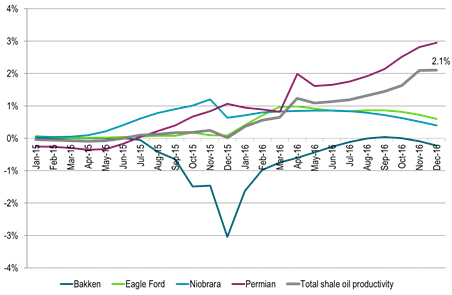
Ch3: The US EIA again revised higher historical US shale oil productivity by 2.1% for Nov and Dec
Data back to December 2015 were also on average revised higher.
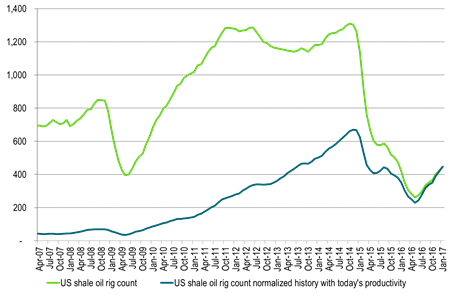
Ch4: The productive effect of today’s some 400 rigs are as strong as 1200 rigs back at the start of 2013
Dark line gives historical rig count adjusted with today’s productivity versus productivity at the time.
An additional 23 rigs are assumed added both in December and in January.
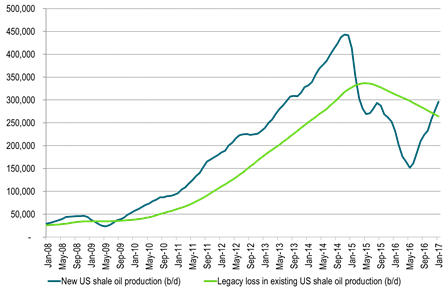
Ch5: US shale oil production is set to start to rise rapidly near term as new production cross above losses in old production
New production here given by EIA rig productivity (December report) stretching out to Jan-17 multiplied by rig count from same report but assuming an additional 23 rigs added in Dec and Jan. In reality however there is a time-lag of 2-4 months before they really cross over.
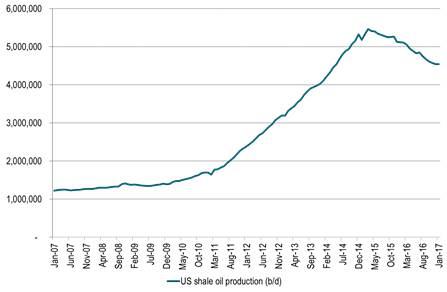
Ch6: US EIA shale oil production just about to turn higher
Data from EIA’s drilling productivity report for December
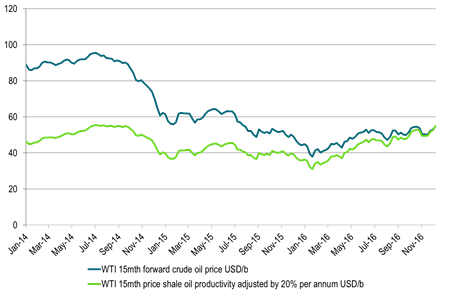
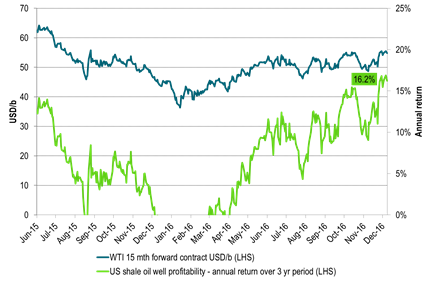
Ch8: US WTI15mth contract at most stimulative level (shale oil investment vise) since July 2015
Playing with numbers:
Green line: Adjust historical WTI15mth crude prices with the 20% pa (roughly) volume productivity growth
Then today’s WTI15 mth price is the most investment wise stimulative level since August 2014
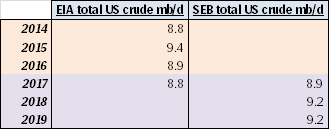
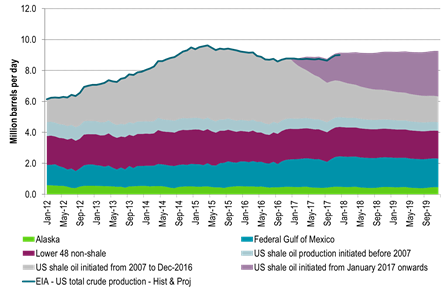
Ch9: US 2018 crude oil production at 9.2 mb/d – Assuming no added US shale oil rigs after Nov 2016 and zero productivity growth
Thus rig count is fixed at 401 from Dec-16 onwards with no productivity growth
However we have already seen 21 additional shale oil rigs into the market in December but they are not added to this scenario.
Only the rigs from the US EIA’s December drilling productivity report are included in this scenario.
Thus seen in the perspective of SEB’s US crude oil model it seems to us that the US EIA assumes NO additional activated shale oil rigs into the market after Nov-16 and no additional shale oil rigs into market in 2017.
We think that the US EIA should specify its assumptions and model projections for the US shale oil rig cont and productivity which goes into their model in its monthly STEO oil reports.
Ch10: US 2018 crude oil production at 10.0 mb/d – Assuming +25 shale oil rigs per month from December 2016 to June-2017 and zero productivity growth
Then no more rigs added after June 2017 with number of US shale oil rigs fixed at 576 rigs after that
Also zero volume productivity growth here onwards from December 2016 gives the following production projection

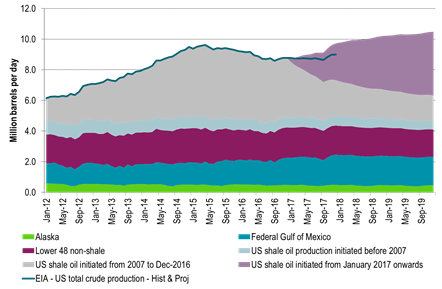
Ch11: US 2018 crude oil production at 10.3 mb/d – Assuming +25 shale oil rigs per month from December 2016 to June-2017 and 10% pa volume productivity growth
Then no more rigs added after June 2017 with number of US shale oil rigs fixed at 576 rigs after that
But assume that US shale oil volume productivity growth continues at 10% pa. instead of the historical (and current) 20% pa.
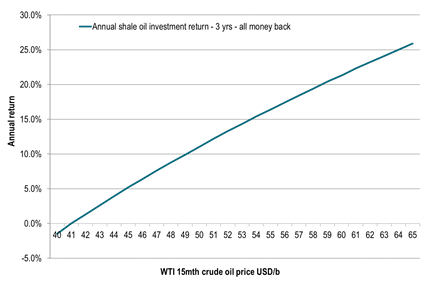
Ch12: US shale oil profitability versus WTI 15 mth crude oil prices
Annual return for a three year investment.
Three years of crude oil production from a new shale oil well.
All money back after three years.
IP 1mth: 1000 b/d. Royalty pay: 20%. Discount rate: 10%, Three yr production after royalty and discount: 330,000 barrels, Wellhead to Cushing discount: $5/b, OPEX: $12/b, Total well cost: $8million,
All production within the hedgeable part of the WTI crude oil price curve.
Thus return should be possible to lock in at the initiation of the investment
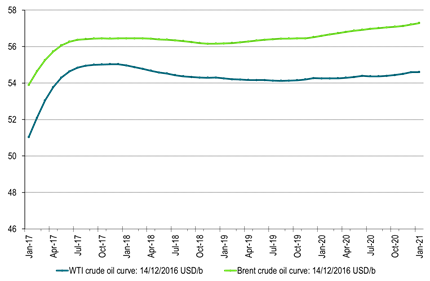
Ch13: The WTI crude oil forward curve feeling the depression from shale oil hedging in 2018 and 2019
Likely to be increasingly heavy depression if rig count continues to rise further
Ch14: As three year annual shale oil profitability hits 16% pa
Kind regards
Bjarne Schieldrop
Chief analyst, Commodities
SEB Markets
Merchant Banking