

Analys
No gold safety net?
![]() On 30th November Switzerland will hold a “Save our Swiss gold” referendum. Should the petition turn out to be successful the Swiss National Bank would have to buy large quantities of gold and would be limited in its monetary policy. The market (and we as well) considers it unlikely that the petition will be successful. As a result the market reaction would be considerable if the referendum passes.
On 30th November Switzerland will hold a “Save our Swiss gold” referendum. Should the petition turn out to be successful the Swiss National Bank would have to buy large quantities of gold and would be limited in its monetary policy. The market (and we as well) considers it unlikely that the petition will be successful. As a result the market reaction would be considerable if the referendum passes.
What is it all about?
The initiators of the petition “Save our Swiss gold” are of the view that only “gold can be the foundation of a stable franc”. So as to cement these foundations they demand a change of the constitution in the following points:
- The Swiss National Bank is going to be banned from selling gold in the future.
- The gold reserves have to be held in Switzerland.
- In the future the SNB will have to hold a minimum of 20% of its assets in gold.
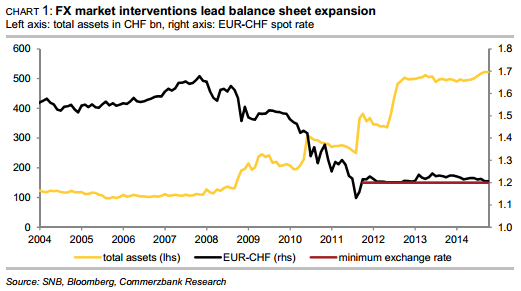
Within two years of the referendum being passed the Swiss National Bank (SNB) has to return its gold reserves to Switzerland and has five years to reach the minimum requirement of 20%. The organisers of the petition argue that this is the only way of ensuring the independence of the central bank and the long term stability of the Swiss franc. The reason they state is the strong rise of the SNB’s balance sheet. Since the beginning of the financial market crisis six years ago the balance sheet has risen more than fourfold to CHF 522 bn. (chart 1). An important factor in this context is the introduction of the franc’s minimum exchange rate against the euro on 6th September 2011. The latter ensures that the exchange rate cannot ease below 1.20 francs per euro. In order to defend the minimum exchange rate the SNB had been forced to buy considerable amounts of euros over the past years. Since the introduction of the minimum exchange rate the balance sheet has risen by 40%, with the majority of this rise taking place between September 2011 and September 2012. With the easing of the Euro crisis the appreciation pressure on the franc was reduced and therefore SNB’s interventions subsided notably. However, should the ECB begin buying government bonds on a large scale next year the appreciation pressure on the franc is likely to rise again. This would also increase the likelihood of renewed SNB interventions, which in turn would lead to a further expansion of the SNB balance sheet.
The petition demands damage the credibility of the SNB
The petition demand to hold all SNB gold reserves in Switzerland does not limit the SNB. The main advantage of geographically distributing the gold reserves, the possibility to sell the reserves quickly, would become redundant as a result of the ban on selling gold. And as the reserve can no longer be sold in the event of a crisis it no longer constitutes a reserve in the stricter sense and therefore it does not matter whether it is distributed around the globe or sunk in one of the Swiss lakes. If the gold reserves cannot be sold they are “lost” for the Swiss economy and for supporting the franc. However, what does the combination of the sales ban and the 20% minimum gold share in the reserves mean for the SNB’s monetary policy? These two demands limit the central bank’s monetary policy scope considerably and make it more difficult for the SNB to fulfil its mandate: price stability in the sense of a rise of consumer prices of less than 2% per annum.
- A balance sheet expansion to fight deflation would entail gold purchases at possibly higher prices so as to ensure that the minimum requirement of 20% is met. Gold is considered to constitute the ultimate safe haven and therefore gets more expensive if the desire for more security increases. As a result the threshold for an extension of the balance sheet that requires gold purchases might be increased.
- Under certain conditions the SNB’s ability to control inflation with the help of a balance sheet contraction might be limited, as the SNB would no longer be able to contract its balance sheet at will. It would only be possible to reduce assets by reducing non-gold holdings as it would not be allowed to sell gold. As a result the gold holdings determine the minimum size of the balance sheet. A balance sheet contraction over and above that is not possible.
The market would be aware of the SNB’s dilemma, so it would constitute the perfect invitation for the market to bet against the SNB. It would open the door to speculators. The difficulties can easily be illustrated by explaining the significance of the petition demands for the EUR-CHF minimum exchange rate of 1.20.
Under the gold initiative the minimum exchange rate in its current form would have been impossible
The SNB introduced the minimum exchange rate to prevent the additional deflationary pressures caused by the appreciation of the franc. The most important reason behind its success is the SNB’s credibility that it would sell unlimited amounts of francs should that be necessary. The SNB would lose this credibility under the conditions of the gold initiative. In this context two factors are important for speculators:
- (1) If there is a risk that EUR-CHF could ease below 1.20 the SNB is forced to extend its balance sheet with the help of franc sales so as to weaken the franc. The difficulties this would cause were discussed above. After the implementation of the 20% requirement the necessary gold purchases could cause the SNB to hesitate and cause the market to question the SNB’s determination.
- (2) A successive contraction of the balance sheet might be possible to a limited extend only, theoretically until the gold share reached 100%. If the extension of the balance sheet cannot be fully reversed inflation pressure increases after a while. Medium term the target of maintaining monetary stability might come under threat. In line with its mandate of price stability the SNB has to anticipate the long term effects of an expansion of the balance sheet. This might cause the SNB to hesitate before selling francs. As a result the SNB’s promise to do everything to defend the minimum exchange rate would become less credible.
However, short term a positive outcome of the referendum would have little effect on the EURCHF exchange rate. Following the vote the SNB would have five years to meet the minimum requirement of 20% gold holdings. So for the time being it would be able to sell unlimited amounts of francs to defend the 1.20 exchange rate – and it would no doubt do so. It would do so to send out the clear signal that it can and will act.
However, that will not be the case medium to long term. At present the SNB expects a rate of inflation of 0.3% yoy in 2015 – which would not yet allow an exit from the minimum exchange rate strategy. As the requirements of the gold initiative act as an invitation to the market to attack the minimum exchange rate, the SNB would probably be unable to defend the minimum exchange rate long term. Over the coming years the SNB would therefore find it increasingly difficult to maintain the minimum exchange rate in its current form.
As long as the SNB sticks to the minimum exchange rate it is clear though that it would not be able to achieve the requirement to hold 20% gold by contracting the balance sheet. So if the gold initiative was to be successful the SNB would therefore be required to buy substantial amounts of gold, in order to reach the required share of 20% of gold in its assets. This would clearly influence the gold price.
Gold initiative might constitute the turning point for the gold price
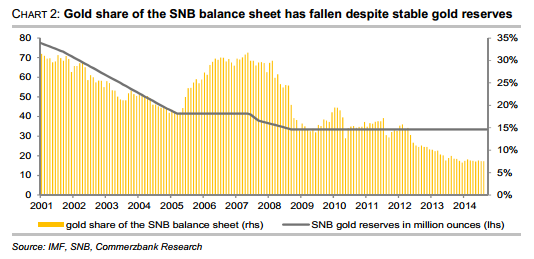
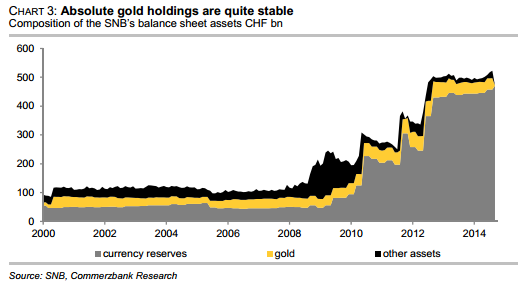
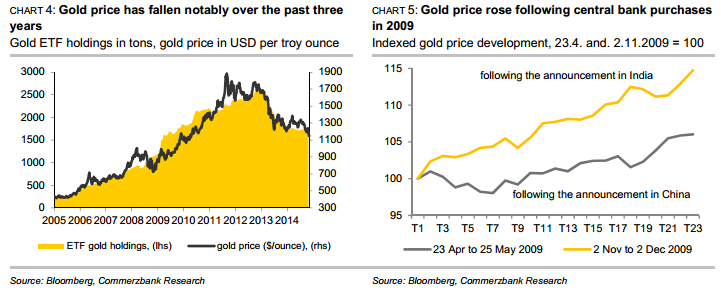
As a result of the SNB’s balance sheet expansion the share of the gold reserves in the total balance has fallen continuously over the past few years. Until mid-2008, i.e. before the start of the financial market crisis, it still accounted for more than 20% – the level that the gold initiative would like it to return to. At present the gold holdings account for less than 8% of the balance, sheet without the amount of gold being held having changed during this time (chart 2 and chart 3 below). Since 2008 the reserves have always amounted to 33.44 m ounces (1,040 tons). At current gold price levels this corresponds to CHF 39bn For the gold share to reach 20% again, as demanded by the gold initiative, it would have to rise to CHF 104.5 bn. as long as the total balance remains unchanged. Assuming an unchanged gold price the SNB would have to buy 56.3 m ounces (which corresponds to approx. 1,750 tons) of gold. That would exceed the holdings of all gold ETFs tracked by Bloomberg (chart 4) and would correspond to approx. 60% of the annual global mine production.
Due to the many parameters it is difficult to give the exact purchasing volume required. The SNB balance sheet is likely to increase further next year if the ECB starts its broad-based bond purchases. Under these circumstances the SNB would probably be forced to once again purchase euros so as to defend the minimum exchange rate. So if everything else remains unchanged even larger gold purchases would then be necessary. On the other hand it seems likely that should the referendum end in a win for the gold initiative the gold price would rise. A rise in the gold price on the other hand would lead to a value based increase of the gold reserves’ share of the balance sheet. So that would mean the SNB has to buy less gold. A fall in the gold price would increase the required gold purchases but this is unlikely in view of the market expectations of imminent massive SNB gold purchases.
At present the market considers it relatively unlikely that the initiative will be successful. Current polls put the opponents of the initiative into a clear lead now after first polls had still assumed a majority for the supporters of the initiative. The chances of the initiative’s success have been dampened quite considerably since the executive committee of the Swiss People’s Party (SVP) voted against the initiative with a tight majority. That means the initiative’s only supporter amongst the parties has been lost, as the other parties are opposing the initiative. The SNB itself is also opposing the initiative for the reasons explained above. As hardly anybody expects the initiative to be accepted the effects of a surprise acceptance on the gold price would be even more pronounced. An outcome of that nature would be in a position to form the turning point in the development of the gold price and constitute the end of the 3-year bear market.
How pronounced would the price reaction in case of a vote in favour of the gold initiative be? The reaction of the gold price following the announcement of gold purchases by the Chinese and Indian central banks in 2009 might provide an indication. When the Chinese central bank announced in late April 2009 that it had increased its gold holdings by 454 tons in the previous 6 years the gold price rose by 6% within one month (chart 5). When the Indian central bank purchased 200 tons of IMF gold, a transaction that became public in early November 2009, this caused a price rise of 15% within one month. The even larger amount of gold the SNB would have to buy suggests that the price would rise at least by a similar magnitude. On the other hand the clearly more negative market sentiment compared with 2009 points in the other direction. At the time the gold price had been in a 7-year uptrend whereas it has been in a downtrend for three years now (chart 4).

Brent M1 moving below the 200 dma of $78.7/b. Brent crude continued its move lower yesterday with a decline of 3.3% to $77.9/b. This morning it is adding another drop of 1.4% to $76.8/b. Israel bombing Lebanon during the weekend was a violence of the MoU and Iran was quick to declare the SoH closed again. But the willingness to move forward by both the US and Iran obviously trumped the bombing in Lebanon making the event more of a hiccup on the road of further negotiations.

The US has now waived sanctions against Iranian oil exports for two months allowing Iran to sell its oil all over the world, though sanctions instated in Europe will take more time to unwind. Oil from Iran, Russia as well as Venezuela can for the time being be sold across the world without any sharp discount due to sanctions. Chinese Tea-pot refineries will suffer as they previously could buy rebated crude while selling products at market prices.
Crude oil is no flowing out of the SoH with latest number close to 7 mb/d on a three day moving average. That is still well below the 14 mb/d of crude and 6 mb/d of products normally flowing out of the SoH. Latest estimate is that there is around 80 mb of crude on water inside the Persian Gulf and maybe another 80 mb of oil products on water as well. If crude is exiting the SoH at a rate of around 7 mb/d, then the 80 mb of crude would be depleted within 10-15 days and there after the flow would rely on new crude tankers entering, loading and then exiting the SoH to continue further flows. Given the uncertainties surrounding the status of the SoH with Iran stating that it was closed again as recent as this weekend, there is likely an asymmetry here where ships and oil stranded in the SoH for months are much more eager to exit than new ships are eager to enter.
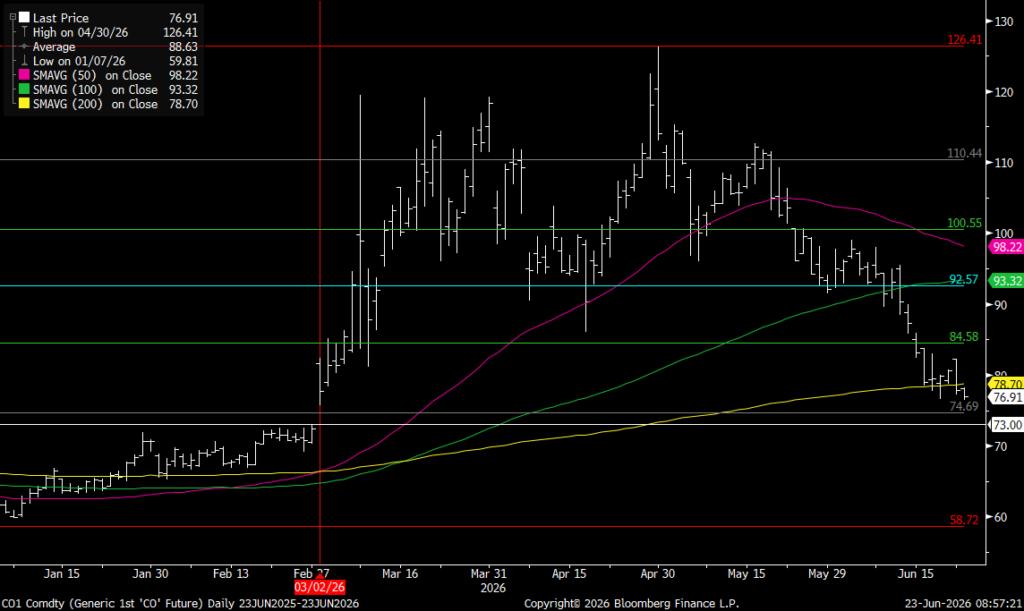
For now Brent crude keeps falling like a rock with the front-end Brent contract now only trading at a premium of $7.6/b above the five year contract. Quickly heading towards parity. The Brent M1 contract has now broken below its 200 dma of $78.7/b and is closing in on the Fibo-level at $74.7/b. Below that there is not much more supporting levels to be found before $73/b which would close the gap from February 3.
Brent crude M1 technical levels
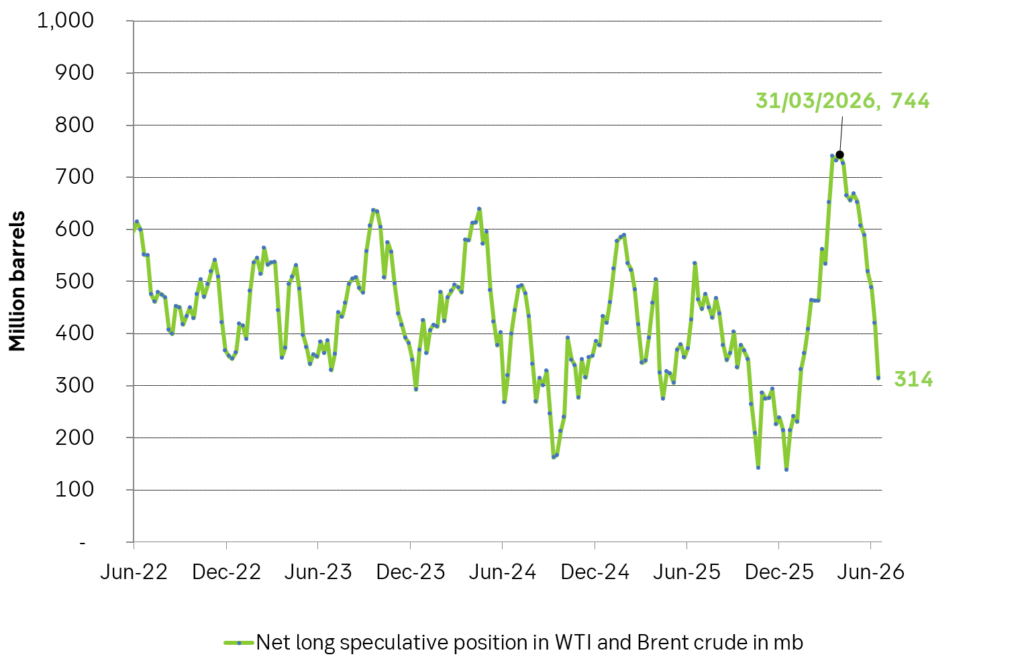
Net long speculative positions are also falling like a rock and as of Tuesday last week the net long positioning in Brent and WTI together summed to 314 million barrels and falling fast.
Will there be a rebound? A possible combination could be an exhaustion of the oil blob caught within the SoH within 1-2 weeks if exits continue at current rate while new ships entering are much more cautious, more Israeli bombardments in Lebanon as Netanyahu fights for re-election, a temporary closure of the SoH again while speculative short positions take cover buying back and covering their positions.
US and Israeli stands versus Iran could harden beyond elections so 2027 surplus is far from given. But Iran and the US are all in all moving towards a set of solutions with both clearly eager to reopen the SoH and keep it open. And that is what the market is pricing along with sharply falling prices. The ongoing discussions will likely take months and last beyond both the upcoming Israeli election (before 27 oct) and the US midterm elections on 3 Nov. Beyond those dates the stance by both Israel and the US may harden again versus Iran. But Iran knows that and is most likely preparing for such a hardening turn. Thus a surplus of oil and global oil stock rebuilding in 2027 (as now is mostly projected) is far from given.
Selling down on a ”deal”. Brent crude fell 6.2% last week with accelerated weakness towards the end of the week. Close of the week at $87.33/b and low of the week (and on Friday) of $85.8/b. Brent is falling another 4% this morning to $83.7/b on confirmation by Iran that a MoU text has been reached and that it will be signed on Friday this week.
So what is this ”deal” worth? Talk on the desk here this morning is that it is much like ”putting lipstick on a pig” where Trump has to sell this at home as a victory where ”the SoH has reopened”, the nuclear issue will be ironed out over the coming 60 days (or maybe 600 days?) and US consumers are getting a lower gasoline price and maybe US republicans survives the midterm elections.
The importance for Iran is that it emerges as the defacto winner of this war in the eyes of the non-US public world. That Iran now onwards is the ”ruler of the SoH” (combo of geography and new weapons systems like drones) or more softer: ”the guarantor of safe passage through the SoH”.
Iran doesn’t need nuclear weapons any more. Nuclear deterrence doesn’t work any more. Ukraine has made many attacks deep into Russia without being nuked in return. Plenty of Iranian ballistic rockets blasts over Israel but Iran wasn’t nuked in return.
There is no trust between the US and Iran. We don’t know all the details yet of the MoU. But what we do know is that there is no trust between the US and Iran what so ever. This is probably more like a descriptive text on how they can cooperate in a way where both sides keeps tactical leverage. Neither side makes irreversible concessions. Violations can be punished quickly. Cooperation produces immediate benefits.
This is a fragile structure. It can easily break down. There may be details which cannot be overcome. To be seen on Friday. The US has to show that it is willing put enough force behind managing and restraining Israel versus Hezbollah in Lebanon. We have seen that Netanyahu hasn’t listened all that much to Trump’s directives and wishes. This could be a major obstacle.
A gradual reopening is tactically preferable for Iran. A tactical leverage for Iran right now is that global oil stocks have been drawn down towards painful and increasingly dangerous levels with increasing risks for oil price spikes in mid-July to August. This together with US midterm elections on 3 November gives tactical leverage to Iran. Iran probably doesn’t want to fully give up on that leverage. A rapid, full reopening where global stocks are able to refill over the coming 60 days will significantly erode that leverage. If Iran reinstates a closure of the SoH after 60 days (if talks break down again), then the effect won’t be that impactful in terms of prices and the US midterm elections.
So a gradual and partial reopening where global markets gets the oil they need while they are unable to rebuild stocks could be a practical middle way for both parties. Trump can sell it as ”the SoH has reopened” and get affordable gasoline for US consumers. Iran can sell it as ”the SoH has fully reopened, but there is some friction” so flow is only 60-80% of normal.
Not much real demand destruction below $100/b. What we do know is that there is not much real price pain demand destruction for oil globally at an oil price below $100/b. A lot of demand-shock destruction. Fear. But demand should now come roaring back towards normal with fear for exceptionally high prices now is rapidly receding.
Sudden China demand destruction due to EVs? Bullocks. EV share of total Chinese carpool now around 13%. Share of new sales of EVs has reached 50%. This is a very gradual process. It doesn’t make oil demand fall like a rock over night. When EV new sales share reaches 100%, then the gasoline car pool will contract by some 5-10% per year. But that is only gasoline. Sudden reduction in Chinese oil demand is more about shock and risk.
Chinese crude oil imports will come roaring back. At what price? Today’s ”neutral” oil price is $70/b. That is the five year price which has steadily traded around the $70/b mark over the past 3-4 years. With still a risky picture one would think that China and the rest of the world will be big buyers of oil in the range of $70-85/b.
Global demand will likely snap back towards normal, forecasted demand and growth at such prices.
Physical reopening is a gradual process. The physical and practical reopening of the SoH will likely be gradual rather than sudden. And that probably suites Iran tactically as well.
Brent M1 price versus the Brent 5-yr (today’s ”normal” price)

Market is starting to take US/Iran headlines with a pinch of salt. Brent crude rose $2.8/b yesterday to an official close of $112.1/b. But after that it traded as low as $108.05/b before ending late night at around $109.7/b. Through the day it traded in a range of $106.87 – 112.72/b amid a flurry of news or rumors from Iran and the US. ”US temporary sanctions during negotiations” (falls alarm). ”We will bomb Iran” (not anyhow),… etc. While the market is still fluctuating to this kind of news flow, it is starting to take such headlines with a pinch of salt.
We’ll see. Maybe, maybe not. The Brent M1 contract is trading at $110.2/b this morning which very close to the average ticks through yesterday of $110.4/b.
Trump with bearish, verbal intervention whenever Brent trades above $110/b it seems. What seems to be a pattern is that Trump states something like ”very good negotiations going on with Iran”, ”New leaders in Iran are great,..”, ”Great progress in negotiations,…”, ”Deal in sight,..” etc whenever the Brent M1 contract trades above $110/b. An effort to cool the market. These hot air verbal interventions from Trump used to have a heavy bearish impact on prices, but they now seems to have less and less effect unless they are backed by reality.
As far as we can see there has been no real progress in the negotiations between the US and Iran with both sides still standing by their previous demands.
Iran is getting stronger while the cease fire lasts making a return to war for Trump yet harder. Iran is naturally in constant preparation for a return to war given Trump’s steady threats of bombing Iran again. Iran is naturally doing what ever is possible to prepare for a return to war. And every day the cease fire lasts it is better prepared. This naturally makes it more and more difficult and dangerous for the US to return to warring activity versus Iran as the consequences for energy infrastructure in the Persian Gulf will be more and more severe the longer the cease fire lasts. Israel seems to see it this way as well. That the war is not won and that current frozen state of a cease fire gives Iran opportunity to rebuild military and politically.
Global inventories are drawing down day by day. How much? In the meantime the Strait of Hormuz stays closed. There is varying measures and estimates of how much global inventories are drawing down. Our rough estimate, back of the envelope, is that global inventories are drawing down by at least some 10 mb/d or about 300 mb/d in a balance between loss of supply versus demand destruction. Other estimates we see are a monthly draw of 250-270 mb/d. The IEA only ’measured’ a draw in global observable stocks of 117 mb in April with oil on water rising 53 mb while on shore stocks fell 170 mb. But global stocks are hard to measure with large invisible, unmeasured stocks. As such a back of the envelope approach may be better.
Oil products is what the world is consuming. Oil product prices likely to rise while product stocks fall. Strategic Petroleum Reserves (SPR) are predominantly crude oil. Discharging oil from OECD SPR stocks, a sharp reduction in Chinese crude imports and a reduction in global refinery throughput of 6-7 mb/d has helped to keep crude oil markets satisfactorily supplied. But global inventories are drawing down none the less. And oil products is really what the world is consuming. So if global refinery throughput stays subdued, then demand will eventually have to match the supply of oil products. The likely path forward this summer is a steady draw down in jet fuel, diesel and gasoline. Higher prices for these. Then, if possible, higher refinery throughput and higher usage of crude in response to very profitable refinery margins. And lastly sharper draw in crude stocks and higher prices for these. But some 6 mb/d of oil products used to be exported through the Strait of Hormuz. And it may not be so easy to ramp up refinery activity across the world to compensate. Especially as Ukraine continues to damage Russian refineries as well as Russian crude production and export facilities.
Watch oil product stocks and prices as well as Brent calendar 2027. What to watch for this summer is thus oil product inventories falling and oil product premiums to crude rising. Another measure to watch is the Brent crude 2027 contract as it rises steadily day by day as the Strait of Hormuz stays closed and global oil inventories decline. The latter is close to the highest level since the start of the war and keeps rising.
The Brent M1 contract and the Brent 2027 prices and current price of jet fuel in Europe (ARA). All in USD/b

Our back of the envelope calculation of the global shortage created by the closure of the Strait of Hormuz. Note that 3.5 mb/d of discharge from SPR is also a draw. Note also that ’Forced demand loss’ of 2.5 mb/d is probably temporary and will fall back towards zero as logistics are sorted out leaving ’Price demand loss’ to do the job of balancing the market. Thus a shortfall of at least 9 mb/d created by the closure. More if SPR discharge is included and more if Forced demand loss recedes.


Brent falling like a rock with oil likely to flow from SoH until at least 3 November

Vattenfalls och Industrikrafts kärnkraftsbolag Videberg Kraft har valt Rolls-Royce SMR
Selling down on a ”deal”

Sommarväder skapar prisrally på elbörsen
Oil product price pain is set to rise as the Strait of Hormuz stays closed into summer
Sommarväder skapar prisrally på elbörsen
Vattenfalls och Industrikrafts kärnkraftsbolag Videberg Kraft har valt Rolls-Royce SMR
Selling down on a ”deal”
Brent falling like a rock with oil likely to flow from SoH until at least 3 November
-
Nyheter3 veckor sedan
Sommarväder skapar prisrally på elbörsen
-
 Nyheter1 vecka sedan
Vattenfalls och Industrikrafts kärnkraftsbolag Videberg Kraft har valt Rolls-Royce SMR
-
Analys1 vecka sedan
Selling down on a ”deal”
-
Analys2 timmar sedan
Brent falling like a rock with oil likely to flow from SoH until at least 3 November