

Analys
The price of Robusta and Arabica coffee
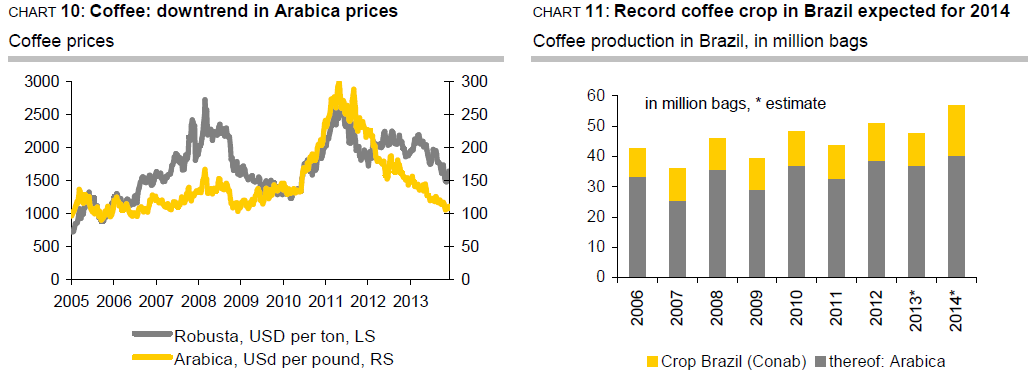
![]() Arabica’s years-long downtrend has led the price of this coffee to its lowest level since 2006 (see chart 10 below). For a brief time it was even feared that the price would fall below the USD1 per pound mark. Moreover, the price looks like it will remain muted going forward as well: if Brazil’s current low-yield year for Arabica couldn’t boost prices and the roya (coffee rust) epidemic affecting a large part of Central America was only able to lift them briefly, we see little hope for a trend reversal in 2014. Not only is production in Columbia likely to increase further in 2014, but above all Brazil is slated for a high-yield year.
Arabica’s years-long downtrend has led the price of this coffee to its lowest level since 2006 (see chart 10 below). For a brief time it was even feared that the price would fall below the USD1 per pound mark. Moreover, the price looks like it will remain muted going forward as well: if Brazil’s current low-yield year for Arabica couldn’t boost prices and the roya (coffee rust) epidemic affecting a large part of Central America was only able to lift them briefly, we see little hope for a trend reversal in 2014. Not only is production in Columbia likely to increase further in 2014, but above all Brazil is slated for a high-yield year.
![]() In fact, the term “low-yield year” has lost much of its edge due to the flattening of the 2-year cycle. This year Brazil posted a record high for production in such a low-yield year and in all probability will post a record-high for production in a high-yield year in 2014. In terms of aggregate coffee volume this could translate to an increase of 10m bags to 57m bags, and some estimates even go as high as 60m bags or more. That is anything but a signal of scarcity (see chart 11 below). Such estimates are supported not only by the good weather conditions so far, but also by the overall improvement in the state of plantation. The good state of plantations, however, is due not least to investments made following the high prices of 2011. The longer the low-price phase persists, the more the investment “dividend” will shrink.
In fact, the term “low-yield year” has lost much of its edge due to the flattening of the 2-year cycle. This year Brazil posted a record high for production in such a low-yield year and in all probability will post a record-high for production in a high-yield year in 2014. In terms of aggregate coffee volume this could translate to an increase of 10m bags to 57m bags, and some estimates even go as high as 60m bags or more. That is anything but a signal of scarcity (see chart 11 below). Such estimates are supported not only by the good weather conditions so far, but also by the overall improvement in the state of plantation. The good state of plantations, however, is due not least to investments made following the high prices of 2011. The longer the low-price phase persists, the more the investment “dividend” will shrink.
 As a minimum, the current low price phase will lead to lower yields in the medium term due to scrimping on fertilizer and crop protection. So far the plantations have continued to persevere despite prices that have often fallen below production cost – but they won’t be able to hold on indefinitely. The marked increase in production costs of an estimated 12% yoy combined with low prices is likely to lower the profitability of coffee farming further. Thus, for the longer run, the ICO views the assumption of a higher coffee supply as questionable. But for now, prices are not budging, not even after the auctions of the Brazilian government, in which options were arranged for planters to deliver 3 million bags to state stockpiles in March 2014. According to the ICO, this non-reaction indicates that the market is underestimating the impact of Brazil’s policy, which it believes is likely to lead to a “precarious” balance.
![]() But that is still a long way off: Following a number of deficit years, 2012/13 has already ended with surplus of about 3m bags as estimated by the ICO. It is still not clear how global production volume will turn out in 2013/14, as increases in Vietnam and Columbia – the latter finally having emerged from its roya Odyssey of several years, which necessitated new plantings of more robust strains – will be offset by decreases in Brazil and currently roya-plagued Central America.
But that is still a long way off: Following a number of deficit years, 2012/13 has already ended with surplus of about 3m bags as estimated by the ICO. It is still not clear how global production volume will turn out in 2013/14, as increases in Vietnam and Columbia – the latter finally having emerged from its roya Odyssey of several years, which necessitated new plantings of more robust strains – will be offset by decreases in Brazil and currently roya-plagued Central America.
![]() At present it seems there could also be surpluses in 2013/14 and 2014/15. The more diminished outlook for the years thereafter should, however, allow prices to rise slowly, so that after an intermittent low during the Brazilian harvest in 2014 we expect the price of coffee to recover to 110 US cents per pound in Q4 2014 and continue to rise thereafter.
At present it seems there could also be surpluses in 2013/14 and 2014/15. The more diminished outlook for the years thereafter should, however, allow prices to rise slowly, so that after an intermittent low during the Brazilian harvest in 2014 we expect the price of coffee to recover to 110 US cents per pound in Q4 2014 and continue to rise thereafter.
 Since summer, Robusta prices have moved in a similarly negative fashion as Arabica prices after far outperforming them for a very long period. Nonetheless, Arabica prices remain low relative to Robusta prices when compared to their history. This should lead to a substitution of Arabica for Robusta in coffee consumption. The ICO believes this trend is already recognisable. The recent recovery of Robusta prices was largely due to the fact that Vietnam’s latest export numbers came in low despite what seems to have been a record-high harvest. The policy of holding back is apparently paying off, at least in the short run. We doubt Robusta prices will be able to escape the pressure of a plenteous coffee supply in 2014 and don’t expect its price to recover until the second half of the year – to a level of USD1,600 per ton.


Oil prices are likely to fall for a fourth straight year as OPEC+ unwinds cuts and retakes market share. We expect Brent crude to average USD 55/b in Q4/25 before OPEC+ steps in to stabilise the market into 2026. Surplus, stock building, oil prices are under pressure with OPEC+ calling the shots as to how rough it wants to play it. We see natural gas prices following parity with oil (except for seasonality) until LNG surplus arrives in late 2026/early 2027.

Oil market: Q4/25 and 2026 will be all about how OPEC+ chooses to play it
OPEC+ is in a process of unwinding voluntary cuts by a sub-group of the members and taking back market share. But the process looks set to be different from 2014-16, as the group doesn’t look likely to blindly lift production to take back market share. The group has stated very explicitly that it can just as well cut production as increase it ahead. While the oil price is unlikely to drop as violently and lasting as in 2014-16, it will likely fall further before the group steps in with fresh cuts to stabilise the price. We expect Brent to fall to USD 55/b in Q4/25 before the group steps in with fresh cuts at the end of the year.

Natural gas market: Winter risk ahead, yet LNG balance to loosen from 2026
The global gas market entered 2025 in a fragile state of balance. European reliance on LNG remains high, with Russian pipeline flows limited to Turkey and Russian LNG constrained by sanctions. Planned NCS maintenance in late summer could trim exports by up to 1.3 TWh/day, pressuring EU storage ahead of winter. Meanwhile, NE Asia accounts for more than 50% of global LNG demand, with China alone nearing a 20% share (~80 mt in 2024). US shale gas production has likely peaked after reaching 104.8 bcf/d, even as LNG export capacity expands rapidly, tightening the US balance. Global supply additions are limited until late 2026, when major US, Qatari and Canadian projects are due to start up. Until then, we expect TTF to average EUR 38/MWh through 2025, before easing as the new supply wave likely arrives in late 2026 and then in 2027.
Price action contained withing USD 2/b last week. Likely muted today as well with US closed. The Brent November contract is the new front-month contract as of today. It traded in a range of USD 66.37-68.49/b and closed the week up a mere 0.4% at USD 67.48/b. US oil inventory data didn’t make much of an impact on the Brent price last week as it is totally normal for US crude stocks to decline 2.4 mb/d this time of year as data showed. This morning Brent is up a meager 0.5% to USD 67.8/b. It is US Labor day today with US markets closed. Today’s price action is likely going to be muted due to that.
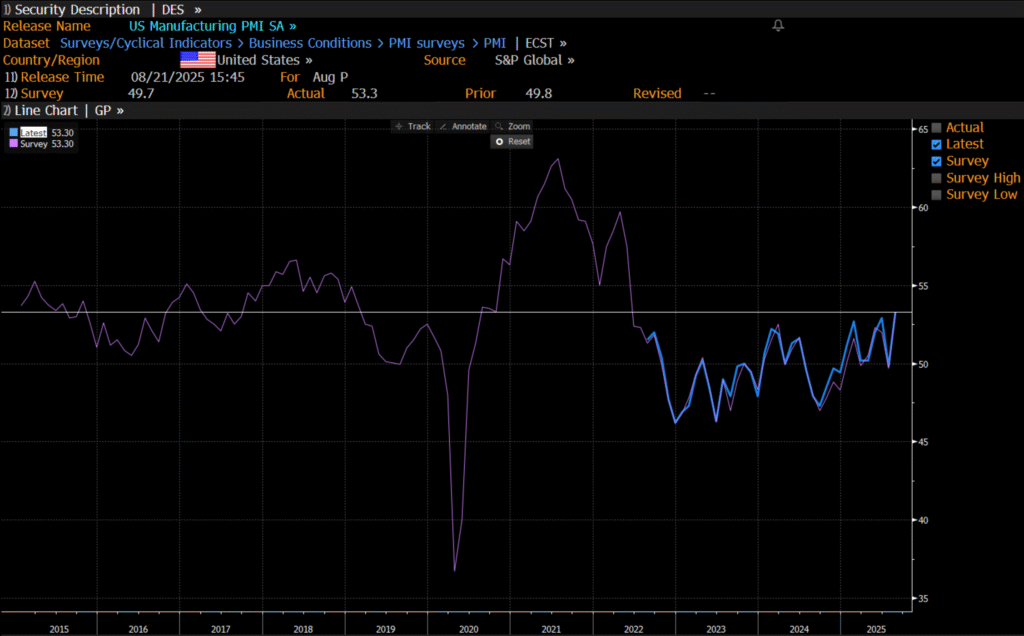
Improving manufacturing readings. China’s manufacturing PMI for August came in at 49.4 versus 49.3 for July. A marginal improvement. The total PMI index ticked up to 50.5 from 50.2 with non-manufacturing also helping it higher. The HCOB Eurozone manufacturing PMI was a disastrous 45.1 last December, but has since then been on a one-way street upwards to its current 50.5 for August. The S&P US manufacturing index jumped to 53.3 in August which was the highest since 2022 (US ISM manufacturing tomorrow). India manufacturing PMI rose further and to 59.3 for August which is the highest since at least 2022.
Are we in for global manufacturing expansion? Would help to explain copper at 10k and resilient oil. JPMorgan global manufacturing index for August is due tomorrow. It was 49.7 in July and has been below the 50-line since February. Looking at the above it looks like a good chance for moving into positive territory for global manufacturing. A copper price of USD 9935/ton, sniffing at the 10k line could be a reflection of that. An oil price holding up fairly well at close to USD 68/b despite the fact that oil balances for Q4-25 and 2026 looks bloated could be another reflection that global manufacturing may be accelerating.
US manufacturing PMI by S&P rose to 53.3 in August. It was published on 21 August, so not at all newly released. But the US ISM manufacturing PMI is due tomorrow and has the potential to follow suite with a strong manufacturing reading.
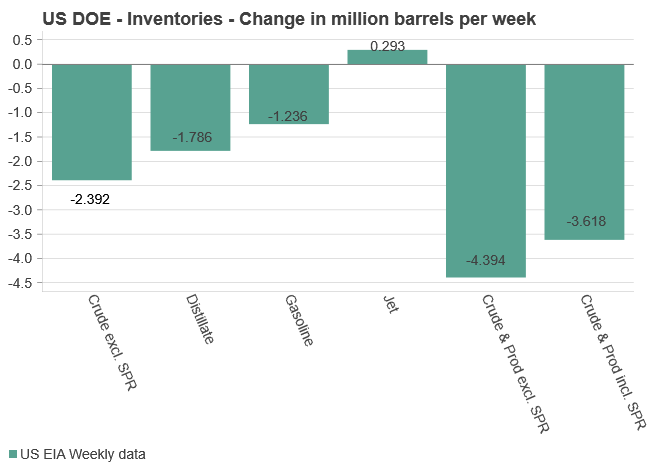
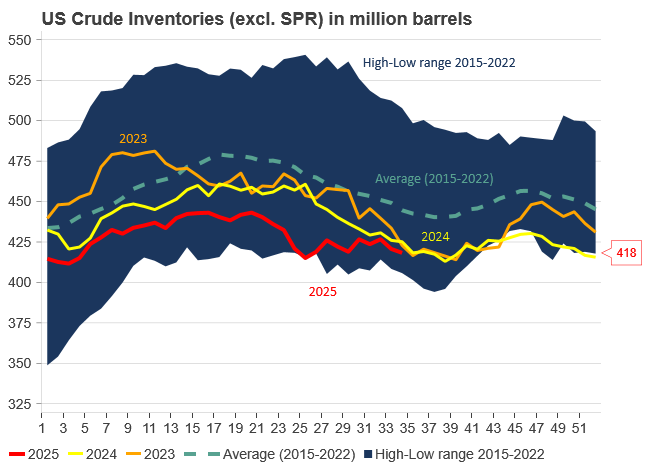
U.S. commercial crude inventories posted another draw last week, falling by 2.4 million barrels to 418.3 million barrels, according to the latest DOE report. Inventories are now 6% below the five-year seasonal average, underlining a persistently tight supply picture as we move into the post-peak demand season.
While the draw was smaller than last week’s 6 million barrel decline, the trend remains consistent with seasonal patterns. Current inventories are still well below the 2015–2022 average of around 449 million barrels.
Gasoline inventories dropped by 1.2 million barrels and are now close to the five-year average. The breakdown showed a modest increase in finished gasoline offset by a decline in blending components – hinting at steady end-user demand.
Diesel inventories saw yet another sharp move, falling by 1.8 million barrels. Stocks are now 15% below the five-year average, pointing to sustained tightness in middle distillates. In fact, diesel remains the most undersupplied segment, with current inventory levels at the very low end of the historical range (see page 3 attached).
Total commercial petroleum inventories – including crude and products but excluding the SPR – fell by 4.4 million barrels on the week, bringing total inventories to approximately 1,259 million barrels. Despite rising refinery utilization at 94.6%, the broader inventory complex remains structurally tight.
On the demand side, the DOE’s ‘products supplied’ metric – a proxy for implied consumption – stayed strong. Total product demand averaged 21.2 million barrels per day over the last four weeks, up 2.5% YoY. Diesel and jet fuel were the standouts, up 7.7% and 1.7%, respectively, while gasoline demand softened slightly, down 1.1% YoY. The figures reflect a still-solid late-summer demand environment, particularly in industrial and freight-related sectors.


Guld kostar för första gången någonsin 3600 USD per uns
OPEC+ in a process of retaking market share
Manufacturing PMIs ticking higher lends support to both copper and oil

Ombytliga elpriser på elmarknaden

Silverpriset når 40 USD, högsta sedan 2011

Omgående mångmiljardfiasko för Equinors satsning på Ørsted och vindkraft

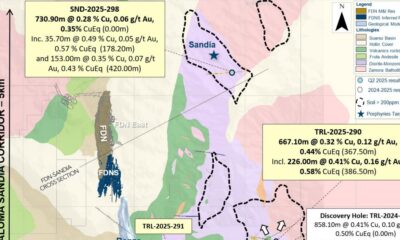
Lundin Gold hittar ny koppar-guld-fyndighet vid Fruta del Norte-gruvan

Meta bygger ett AI-datacenter på 5 GW och 2,25 GW gaskraftverk

Guld stiger till över 3500 USD på osäkerhet i världen
What OPEC+ is doing, what it is saying and what we are hearing
-
 Nyheter3 veckor sedan
Omgående mångmiljardfiasko för Equinors satsning på Ørsted och vindkraft
-
 Nyheter4 veckor sedan
Lundin Gold hittar ny koppar-guld-fyndighet vid Fruta del Norte-gruvan
-
 Nyheter2 veckor sedan
Meta bygger ett AI-datacenter på 5 GW och 2,25 GW gaskraftverk
-
 Nyheter4 veckor sedan
Guld stiger till över 3500 USD på osäkerhet i världen
-
Analys3 veckor sedan
What OPEC+ is doing, what it is saying and what we are hearing
-

 Nyheter4 veckor sedan
Alkane Resources och Mandalay Resources har gått samman, aktör inom guld och antimon
-
 Nyheter2 veckor sedan
Aker BP gör ett av Norges största oljefynd på ett decennium, stärker resurserna i Yggdrasilområdet
-
 Nyheter4 veckor sedan
Lyten, tillverkare av litium-svavelbatterier, tar över Northvolts tillgångar i Sverige och Tyskland