

Analys
SHB Råvarubrevet 19 april 2013

 Råvaror allmänt
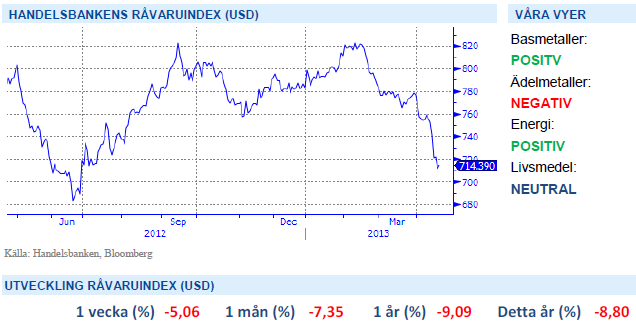
En vecka med motvind
Marknaden har haft ordentlig motvind sedan förra veckan. Denna gång är det framförallt råvaror som har handlats ner. Brentoljan har dippat under 100 USD och koppar under 7000 USD samtidigt som guldet har genomlidit det största fallet under två dagar på 30 år. De senaste motgångarna är inte koncentrerade till Europa som vi vant oss vid utan kommer från makrodata i USA och Kina. Vi har påtalat risken för besvikelser i amerikanskt makro under våren och de senaste händelserna stödjer denna riskbild.
Den QE pådrivna börsen tar sig förbi svagare data medan räntemarknaden och råvarumarknaden prisar in den för fullt. En svagare data är antagligen de första tecknen på finanspolitisk åtstramning i USA och kan också vara tecken på att QE3 effekten nu börjar ebba ut. Samtidigt har data i Kina börjat oroa på svagare nivåer än väntat på det hela taget. Med problembarnet Europa ständigt närvarande ser vi få ljuspunkter i makrobilden just nu.
Basmetaller
Metallerna under marginalkostnad
Basmetallerna har haft ytterligare en vecka med fallande priser, där koppar tappat dryga 6 % och handlas nu under 7000 USD – i nivå vi inte sett sedan oktober 2011. Förhoppningar på Kinas konjunkturuppgång har inte infriats och med ett USA som samtidigt släpper svagare data har fått konjunktur känsliga metaller att falla. I närtid finns risk för mer dålig USA data och för Kina ororas vi av att de stimulanser som lanserats redan verkat i indikatorer och det finns därför inte mer lanserad stimulansdriven tillväxt att vänta i barometerdata.
En rad metaller har efter senaste veckans negativa rörelser nu sjunkit och handlas klart under marginalkostnad för produktion vilken brukar verka bättre som stöd vid fallande kurser. Om vi bortser från Koppar där denna ligger på ca 4,500 dollar eller strax över 6,000 dollar om man ser till det ”incentive-pris”, som gäller för nya investeringar, och kanske bättre symboliserar stödet vid en svag balans, har vi svårt att se att detta ska falla så värst mycket ytterligare. Vi förväntar oss dock inget kraftigt uppställ på kort sikt utan snarare att marknaden bottnar ur för att sedan på lite längre sikt börja stiga igen. Initialt mot marginalkostnad vilket gör att vi ser detta som köpterritorium för metaller och möjlighet att komma in på bra nivåer.
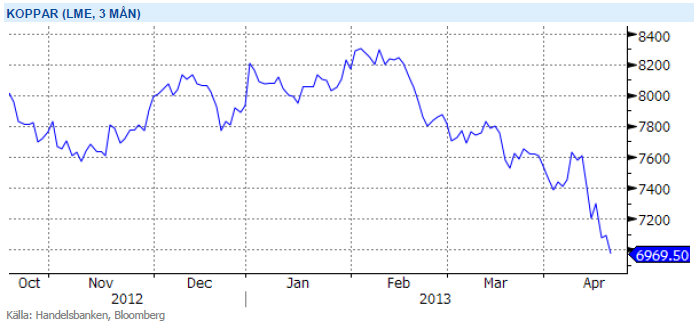
Trots fortsatt svag makromiljö, utan någon direkt ljusning ser vi ändå basmetaller som köpvärda på dessa nivåer. Vi tror på: LONG BASMET H
Ädelmetaller
Veckans snackis!
Guldet blev denna veckas stora samtalsämne efter att på måndagen ha fallit med över 11 % jämfört med fredagskvällens notering. Det cirkulerade många försök till förklaringar till den stora och plötsliga rörelsen, och varför den skedde just nu. Vi har inga bra svar på timingen, men konstaterar att det är en rörelse vi väntat på, och vi tror inte att den är över i och med detta fall. Vi har nu fallit med 26 % från toppen hösten 2011, och 16 % hittills i år. Silvret däremot – guldets sprallige lillebror – har mer än halverats sedan toppen, och fallit 22 % i år. Den stora frågan nu är naturligtvis huruvida det ska fortsätta, och isåfall hur långt.
Vårt resonemang har som bekant varit att guldet handlas i stort sett enbart ur perspektivet att man vill tjäna pengar – man köper guld för att sälja dyrare till någon annan – och att guldet inte har massvis med andra användningsområden. Det är helt korrekt, som många kommenterat, att guld används till smycken och viss industriell nytta, men vi anser inte att dessa delar är de som sätter priset på guld. Det är guldets likviditet, enkla omsättningsbarhet, och det upplevda skyddet mot finansiell osäkerhet och inflation som driver priset. Och när alla har ”köpt färdigt” guld, då blir dynamiken väldigt speciell…
Om majoriteten av guld och silverspekulanter inte längre tror att de kan köpa för att sälja dyrare till någon annan så finns det få anledningar att hålla guld. Detta konstaterades redan 1980 då guldet gjort en fantastisk resa uppåt under ett par intensiva år. Då föll det tillbaks 65 % på drygt två år, och sen dröjde det drygt två decennier innan man började intressera sig för guld på allvar igen.
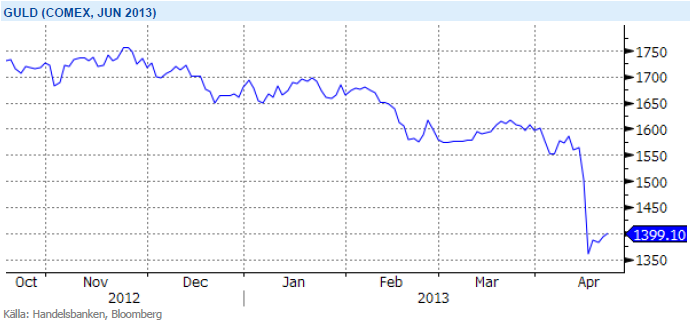
Trots det största raset på 30 år tror vi att förtroendet för guld håller på urholkas och att trenden nedåt fortsätter. Vi tror på: SHRT GULD H
Energi
Utsläppsrätterna – i händer på politiken
Elkontraktet Q3 2013 faller tillbaka med över 5 procent under veckan och det är mest till följd av utsläppsrätterna som rasar med över 34 procent. Ser vi till CO2-marknaden kan dess fortsatta existens nu stark ifrågasättas efter att parlamentet röstat emot kommissionens förslag om att minska överskottet på rätter. Förslaget om ”backloading” innebär att hålla tillbaka allokeringen om 900 miljoner rätter mot slutet av fas III för att balansera marknaden men det är nu mycket ovisst vad som kommer hända framöver. Sannolikt att det kommer att handlas på nuvarande nivå om 2-3 euro, dvs ca 2 öre per kWh på elpriset, så länge det finns hopp om att kommissionen kommer att agera på något sätt för att upprätthålla förtroendet.
På dessa låga nivåer finns dock inga större incitament att investera i minskade utsläpp! Vi kan liksom tidigare konstatera att denna marknad varit fel utformad från dag 1 och lägg därtill misslyckandet om att få till ett globalt direktiv – en central del för en fungerande marknad och långsiktig överlevnad. Vi behöver en mer överskådlig parameter vad gäller utsläppskostnader och dess inverkan på elpriset. Inte omöjligt att det istället blir någon form av skatt emot vilken nuvarande överskott kan kvittas, på så sätt bör kommissionen kunna erkänna sitt misslyckande och ändå rädda ansiktet.
Kort om oljan, som under veckan handlas under 100 USD: OPEC har varit väldigt aktiva i att styra priset efter stora prisfall och vi väntar oss att kartellen griper in vilken dag som helst och drar tillbaka produktion. Vi ser olja under 100 som klart köpvärd.
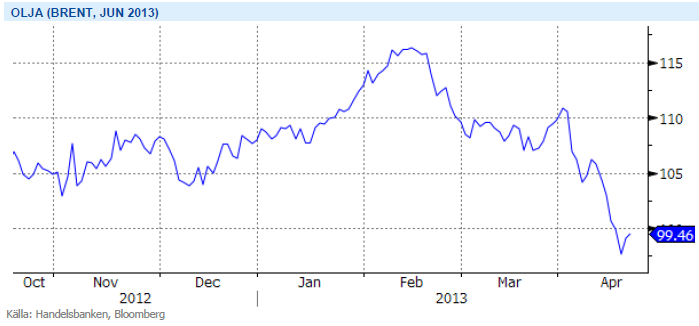
OPEC har tidigare aktivt och framgångsrikt försvarat prismålet 100-110 USD och vi väntar oss handling snarare än besked från kartellen inom kort. Konflikten mellan Israel och Iran är nästa skäl att förvänta sig högre oljepriser under H2. Vi tror på: LONG OLJA H
Livsmedel
Än är inte faran över för vetet
Vete avslutar denna vecka i princip oförändrad (svagt ned). Än är vi inte helt ute ur en känslig period för höstvetet och än är inte vårsådden helt klar i alla områden. Dock förbättras situationen (om än sakta) i de flesta områden och risken för bakslag minskar. Det är dock långt kvar till skörd och väldigt mycket kan ske fram tills dess – med väldigt små lager får eventuella väderproblem lätt stora och snabba effekter i form av stigande priser. I dagsläget finner vi dock inte skäl till större oro utan är kvar i vår tro om en relativt kraftig återhämtning av den globala spannmålsproduktionen – med följden att vi väntar oss lägre priser på vete längre fram på året.
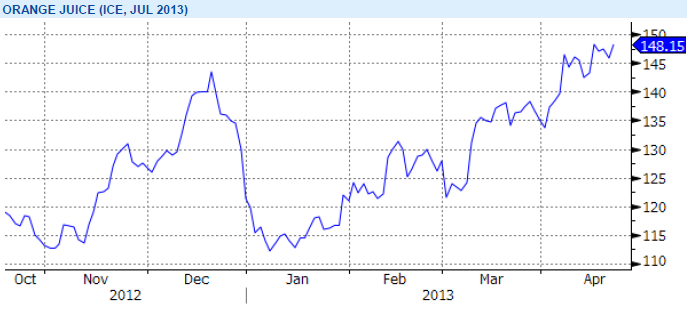
Under våren har priset på apelsinjuice skjutit i höjden p.g.a. minskad produktion som en följd av frost, bakteriesjukdom och torrt väder i Florida. I veckan nådde priset nästan årshögsta efter spekulationer kring en aktiv orkansäsong som närmar sig och som skulle hota den redan drabbade trädplanteringen i Florida ytterligare.
För kakao behåller vi vår vy och är fortsatt positiva efter signaler om stigande konsumtion. Siffror från National Confectioners Association i veckan ger fortsatt stöd till kakaopriset. Rapporten visade på ökat processande av kakao i Nordamerika för Q1-13 jämfört med samma period förra året.
Då priserna har på de stora jordbruksråvarorna soja, majs och vete har fallit tillbaka till nivåer före torkan i USA, tror vi att en nedsida är begränsad på kort sikt och därför är vi neutrala till utvecklingen för denna sektor.
Handelsbankens Råvaruindex
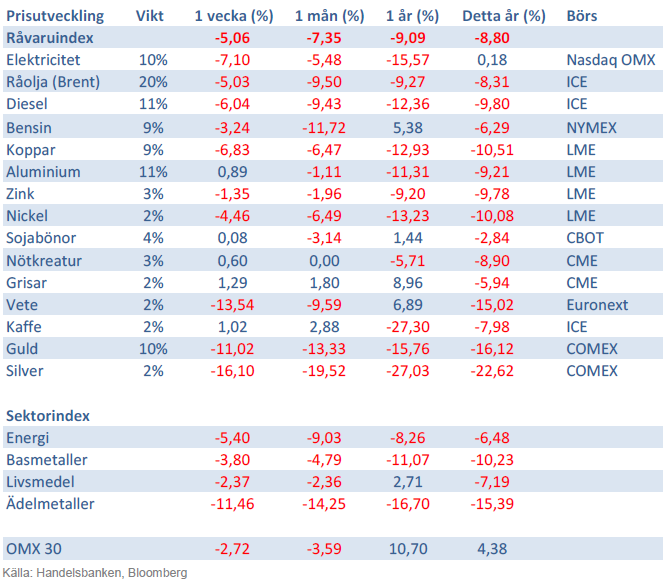
Handelsbankens råvaruindex består av de underliggande indexen för respektive råvara. Vikterna är bestämda till hälften från värdet av nordisk produktion (globala produktionen för sektorindex) och till hälften från likviditeten i terminskontrakten.
[box]SHB Råvarubrevet är producerat av Handelsbanken och publiceras i samarbete och med tillstånd på Råvarumarknaden.se[/box]
Ansvarsbegränsning
Detta material är producerat av Svenska Handelsbanken AB (publ) i fortsättningen kallad Handelsbanken. De som arbetar med innehållet är inte analytiker och materialet är inte oberoende investeringsanalys. Innehållet är uteslutande avsett för kunder i Sverige. Syftet är att ge en allmän information till Handelsbankens kunder och utgör inte ett personligt investeringsråd eller en personlig rekommendation. Informationen ska inte ensamt utgöra underlag för investeringsbeslut. Kunder bör inhämta råd från sina rådgivare och basera sina investeringsbeslut utifrån egen erfarenhet.
Informationen i materialet kan ändras och också avvika från de åsikter som uttrycks i oberoende investeringsanalyser från Handelsbanken. Informationen grundar sig på allmänt tillgänglig information och är hämtad från källor som bedöms som tillförlitliga, men riktigheten kan inte garanteras och informationen kan vara ofullständig eller nedkortad. Ingen del av förslaget får reproduceras eller distribueras till någon annan person utan att Handelsbanken dessförinnan lämnat sitt skriftliga medgivande. Handelsbanken ansvarar inte för att materialet används på ett sätt som strider mot förbudet mot vidarebefordran eller offentliggörs i strid med bankens regler.


Brent is climbing higher. Front-month is at USD 106.3/bl this morning, close to a weekly high and a USD 9/bl jump from Mondays open. This is the move we flagged as a risk earlier in the week: the market shifting from ”a deal is around the corner” to ”this is going to take longer than we thought”.

Analyst Commodities, SEB
During April, rest-of-year Brent remained remarkably stable around USD 90/bl. A stability which rested on one single assumption: the SoH reopens around 1 May. That assumption is now slowly falling apart.
As we highlighted yesterday: every week of delay beyond 1 May adds (theoretically) ish USD 5/bl to the rest-of-year average, as global inventories draw 100 million barrels per week. i.e., a mid-May reopening implies rest-of-year Brent closer to USD 100/bl, and anything pushing into June or July takes us meaningfully higher.
What’s changed in the last 48 hours:
#1: The US military has formally warned that clearing suspected sea mines from SoH could take up to six months. That is a completely different timescale from what the financial market is pricing. Even a political deal tomorrow does not immediately reopen the strait.
#2: Trump has shifted his tone from urgency to ”strategic patience”. In yesterday’s press conference: ”Don’t rush me… I want a great deal.” The market is reading this as a president no longer feeling pressured by timelines, with the naval blockade running in the background.
#3: So far, the military activity is escalating, not de-escalating. Axios reports Iran is laying more mines in SoH. The US 3rd carrier strike group (USS George H.W. Bush) is arriving with two countermine vessels. Trump yesterday ordered the US Navy to destroy any Iranian boats caught laying mines. While CNN reports that the Pentagon is actively drawing up plans to strike Iranian SoH capabilities and individual Iranian military leaders if the ceasefire collapses. i.e., NOT a attitude consistent with an imminent deal!
Spot crude and product prices eased off the early-April highs on a combination of system rerouting and deal optimism. Both now weakening. Goldman estimates April Gulf output is reduced by 14.5 mbl/d, or 57% of pre-war supply, a number that keeps getting worse the longer this drags on.
Demand-side adaptation is ongoing: S. Korea has cut its Middle East crude dependence from 69% to 56% by pulling more from the Americas and Africa, and Japan is kicking off a second round of SPR releases from 1 May. But SPRs are finite.
Ref. to the negotiations, we should not bet on speed. The current Iranian leadership is dominated by genuine hardliners willing to absorb economic pain and run the clock to extract concessions. That is not a setup for a rapid resolution. US/Israeli media briefings keep framing the delay as ”internal Iranian divisions”, the reality is more complicated and points toward weeks and months, not days.
Our point is that the complexity is large, and higher prices have only just started (given a scenario where the negotiations drag out in time). The market spent April leaning on the USD 90/bl rest-of-year assumption; that case is diminishing by the hour. If ”early May reopening” is replaced by ”June, July or later” over the next week or two, both crude and products have meaningful room to reprice higher from here. There is a high risk being short energy and betting on any immediate political resolution(!).
Down on Friday. Up on Monday. The Brent June crude oil contract traded down 5.1% last week to a close of $90.38/b. It reached a high of $103.87/b last Monday and a low of $86.09/b on Friday as Iran announced that the Strait of Hormuz was fully open for transit. That quickly changed over the weekend as the US upheld its blockade of Iranian oil exports while Iran naturally responded by closing the SoH again. The US blew a hole in the engine room of the Iranian ship TOUSKA and took custody of the ship on Sunday. Brent crude is up 5.6% this morning to $95.4/b.

The cease-fire is expiring tomorrow. The US has said it will send a delegation for a second round of negotiations in Islamabad in Pakistan. But Iran has for now rejected a second round of talks as it views US demands as unrealistic and excessive while the US is also blocking the Strait of Hormuz.
While Brent is up 5% this morning, the financial market is still very optimistic that progress will be made. That talks will continue and that the SoH will fully open by the start of May which is consistent with a rest-of-year average Brent crude oil price of around $90/b with the market now trading that balance at around $88/b.
Financial optimism vs. physical deterioration. We have a divergence where the financial market is trading negotiations, improvements and resolution while at the same time the physical market is deteriorating day by day. Physical oil flows remain constrained by disrupted flows, longer voyage times and elevated freight and insurance costs.
Financial markets are betting that a US/Iranian resolution will save us in time from violent shortages down the road. But every day that the SoH remains closed is bringing us closer to a potentially very painful point of shortages and much higher prices.
The US blockade is also a weapon of leverage against its European and Asian allies. When Iran closed the SoH it held the world economy as a hostage against the US. The US blockade of the SoH is of course blocking Iranian oil exports. But it is also an action of disruption directed towards Europe and Asia. The US has called for the rest of the world to engaged in the war with Iran: ”If you want oil from the Persian Gulf, then go and get it”. A risk is that the US plays brinkmanship with the global oil market directed towards its European and Asian allies and maybe even towards China to force them to engage and take part. Maybe unthinkable. But unthinkable has become the norm with Trump in the White House.
Wild moves yesterday. Brent crude traded to a high of $114.43/b and a low of $96.0/b and closed at $99.94/b yesterday.
US – Iran negotiations ongoing or not? What a day. Donald Trump announced that good talks were ongoing between Iran and the US and that the 48 hour deadline before bombing Iranian power plants and energy infrastructure was postponed by five days subject to success of ongoing meetings. Iranian media meanwhile stated that no meetings were ongoing at all.
Today we are scratching our heads trying to figure out what yesterday was all about.
Friends and family playing the market? Was it just Trump and his friends and family who were playing with oil and equity markets with $580m and $1.46bn in bets being placed by someone in oil and equity markets just 15 minutes before Trump’s announcement?
Was Trump pulling a TACO as he reached his political and economic pain point: Brent at $112/b, US Gas at $4/gal, SPX below 200dma and US 10yr above 4.4%?
Different Iranian factions with Trump talking with one of them? Are there real negotiations going on but with the US talking to one faction in Iran while another, the hardliners, are not involved and are denying any such negotiations going on?
Extending the ultimatum to attack and invade Kharg island next weekend? Or, is the five day delay of the deadline a tactical decision to allow US amphibious assault ships and marines to arrive in the Gulf in the upcoming weekend while US and Israeli continues to degrade Iranian military targets till then. And then next weekend a move by the US/Israel to attack and conquer for example the Kharg island?
We do not really know which it is or maybe a combination of these.
We did get some kind of TACO ydy. But markets have been waiting for some kind of TACO to happen and yesterday we got some kind of TACO. And Brent crude is now trading at $101.5/b as a result rather than at $112-114/b as it did no the high yesterday.
But what really matters in our view is the political situation on the ground in Iran. Will hardliners continue to hold power or will a more pragmatic faction gain power?
If the hardliners remain in power then oil pain should extend all the way to US midterm elections. The hardliners were apparently still in charge as of last week. Iran immediately retaliated and damaged LNG infrastructure in Qatar after Israel hit Iranian South Pars. The SoH was still closed and all messages coming out of Iran indicated defiance. Hardliners continues in power has a huge consequence for oil prices going forward. The regime has played its ’oil-weapon’ (closing or chocking the Strait of Hormuz). It is using it to achieve political goals. Deterrence: it needs to be so politically and economically expensive to attack Iran that it won’t happen again in the future. Or at least that the US/Israel thinks 10-times over before they attack again. The highest Brent crude oil closing price since the start of the war is $112.19/b last Friday. In comparison the 20-year inflation adjusted Brent price is $103/b. So Brent crude last Friday at $112.19/b isn’t a shockingly high price. And it is still far below the nominal high of $148/b from 2008 which is $220/b if inflation adjusted. So once in a lifetime Iran activates its most powerful weapon. The oil weapon. It needs to show the power of this weapon and it needs to reap political gains. Getting Brent to $112/b and intraday high of $119.5/b (9 March) isn’t a display of the power of that weapon. And it is not a deterrence against future attacks.
So if the hardliners remain in power in Iran, then the SoH will likely remain chocked all the way to US midterm elections and Brent crude will at a minimum go above the historical nominal high of $148/b from 2008.
Thus the outlook for the oil price for the rest of the year doesn’t depend all that much of whether Trump pulls a TACO or not. Stops bombing or not. It depends more on who is in charge in Iran. If it is the hardliners, then deterrence against future attacks via chocking of the SoH and high oil prices is the likely line of action. It is impacting the world but the Iranian ’oil-weapon’ is directed towards the US president and the the US midterm elections.
If a pragmatic faction gets to power in Iran, then a very prosperous future is possible. However, if power is shifting towards a more pragmatic faction in Iran then a completely different direction could evolve. Such a faction could possibly be open for cooperation with the US and the GCC and possibly put its issues versus Israel aside. Then the prosperity we have seen evolving in Dubai could be a possible future also for Iran.
So far it looks like the hardliners are fully in charge. As far as we can see, the hardliners are still fully in control in Iran. That points towards continued chocking of the SoH and oil prices ticking higher as global inventories (the oil market buffers) are drawn lower. And not just for a few more weeks, but possibly all the way to the US midterm elections.


Solkraften pressar elpriserna dagtid

Michel Gubel ger sin syn på oljemarknaden

Svag vårflod dubblar elpriserna
Brent crude up USD 9/bl on the week… ”deal around the corner” narrative fades
Market Still Betting on Timely Resolution, But Each Day Raises Shortage Risk

Christian Kopfer om läget för oljan
Market Still Betting on Timely Resolution, But Each Day Raises Shortage Risk
Brent crude up USD 9/bl on the week… ”deal around the corner” narrative fades
Michel Gubel ger sin syn på oljemarknaden
Solkraften pressar elpriserna dagtid
-
 Nyheter4 veckor sedan
Christian Kopfer om läget för oljan
-
Analys3 veckor sedan
Market Still Betting on Timely Resolution, But Each Day Raises Shortage Risk
-
Analys3 veckor sedan
Brent crude up USD 9/bl on the week… ”deal around the corner” narrative fades
-
 Nyheter2 veckor sedan
Michel Gubel ger sin syn på oljemarknaden
-
 Nyheter2 veckor sedan
Solkraften pressar elpriserna dagtid
-
Nyheter2 veckor sedan
Svag vårflod dubblar elpriserna