Analys
SIP Nordic – Råvaruguiden – mars 2013

![]() Under mars månad kan Avanzas kunder handla RBS Mini Futures, som följer index, utan courtage. Därför tänkte jag skriva lite om ett index som kanske är lite okänt för det flesta. NYSE Arca Gold Bugs eller HUI-index.
Under mars månad kan Avanzas kunder handla RBS Mini Futures, som följer index, utan courtage. Därför tänkte jag skriva lite om ett index som kanske är lite okänt för det flesta. NYSE Arca Gold Bugs eller HUI-index.
Gold Bugs index eller HUI är ett aktieindex bestående av 16 guldbolag. BUGS står för ”Basket of Unhedged Gold Stocks”. Vilket betyder att indexet enbart inkluderar bolag som inte försäkrar sin guldproduktion längre än ett och ett halvt år fram i tiden. Indexets ingående bolag sägs därför återspegla den framtida tron om guldpriset väl.
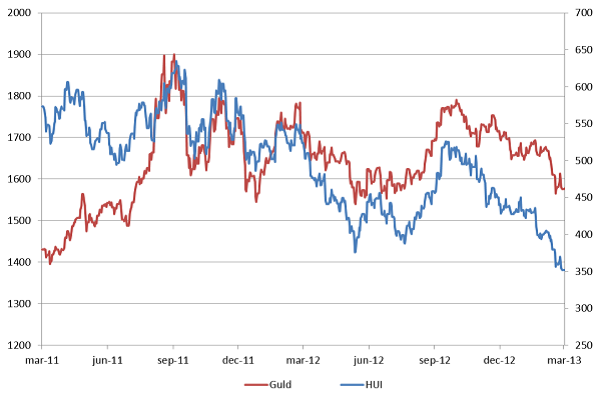
Den senaste tiden har guldpriset fallit och HUI Index har inte varit något undantag. Sedan slutet av september förra året har guldpriset tappat ca. 11 %. HUI index har under samma tid tappat 34 %.
Utveckling för guld och HUI indexars 2011 – mars 2013. (Höger axel för guldpriset och vänster för HUI)
Den senaste veckan har medierna kantats av att guldpriset gått in i en negativ trend och att fler investerare söker sig bort från den säkra hamn som guld symboliserat i lite skakigare tider. Guldets fortsatta utveckling ser fortsatt spännande ut och ett viktigt stöd kring $1550 närmar sig. Om guld faller igenom kan detta mycket väl betyda en fortsatt nedgång för HUI Index.
Vid ett sådant scenario kan man utnyttja en nedåtgående rörelse genom att köpa MINISHRT GBUG
Vill man istället gå mot strömmen och har en fortsatt tro på att guldbolagen ska öka sin årliga tillväxt samt att guldpriset kommer att återhämta sig kan man köpa MINILONG GBUG
Alexander Frick
Råvaror – Energi
Brent olja
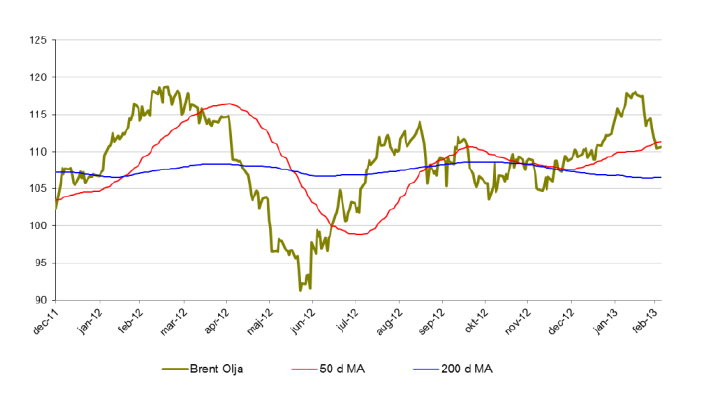
- Efter en stark start på året har brentoljan återigen vänt ned. För året är brentoljan på +-0 %.
- Minskad import från USA samt ökade lager bidrar till brentoljans nedgång.
- Uttalande från Ben Bernanke (FED) om en paus i stimulanspaket påverkar även priset på olja negativt.
- Bland spekulanter (bland annat fonder) ökas de långa positionerna vilket kan indikera att en vändning uppåt är på väg.
Naturgas
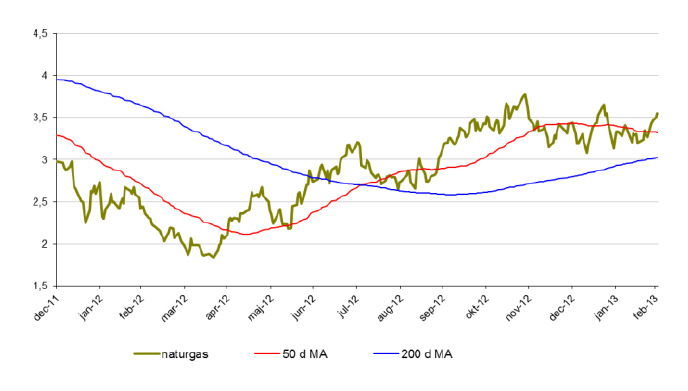
- Från i mitten av april hade Naturgas en mycket stark period under 2012. Sedan botten i april klättrade priset på naturgas med nästan 84 % och avslutade året på cirka 10 % upp.
- För året är priset på naturgas upp drygt 13 %.
- Naturgas handlas nu över 50 dagarsmedelvärde och den långa trenden pekar uppåt.
Råvaror – Metaller
Guld
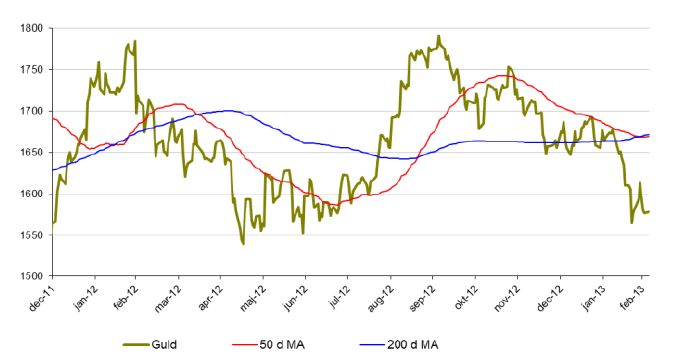
- Guld befinner sig i ett otroligt spännande läge. Sedan årets början är guld ned nära 5 %.
- Guld närmar sig nu ett stödområde kring $1550 som är väl värt att bevaka. Om stödet håller kan en lång position vara intressant. Om guld bryter under denna nivå är en kort position lika intressant.
- Vi har även sett ett s.k. dödskors i guld den senaste veckan vilket betyder att 50 dagars medelvärde skär 200 dagars uppifrån. Detta brukar kunna tolkas som en signal om nedgång.
Silver
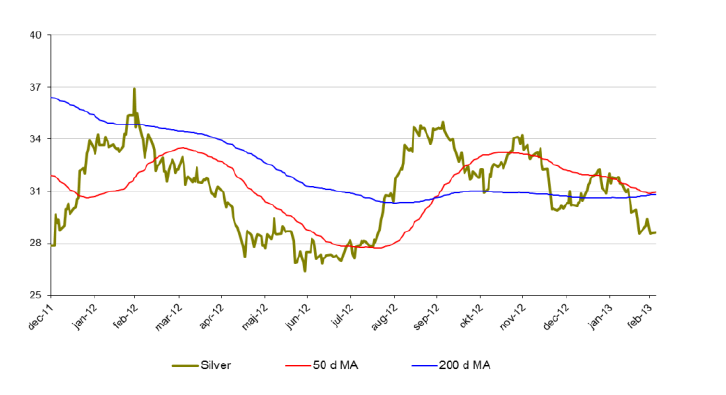
- Silver följer med guld nedåt.
- Tecken på framförallt en starkare amerikansk ekonomi driver priset på silver nedåt.
- För året är priset på silver ned knappa 7 %.
- Viktiga stödområden kring $27.
Platina
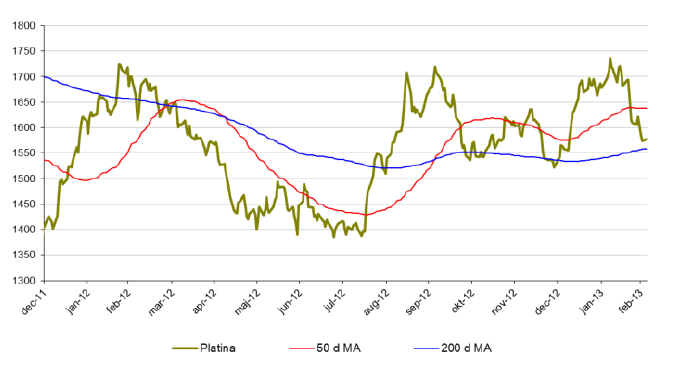
- Platina har likt silver och guld åkt berg och dalbana. För året är dock platina upp 3,5 % men föl under februari 11 %.
- Platina handlas nu till samma nivå som guld.
- Likt guld finns det intressanta motståndszoner kring $1550 att bevaka.
Koppar
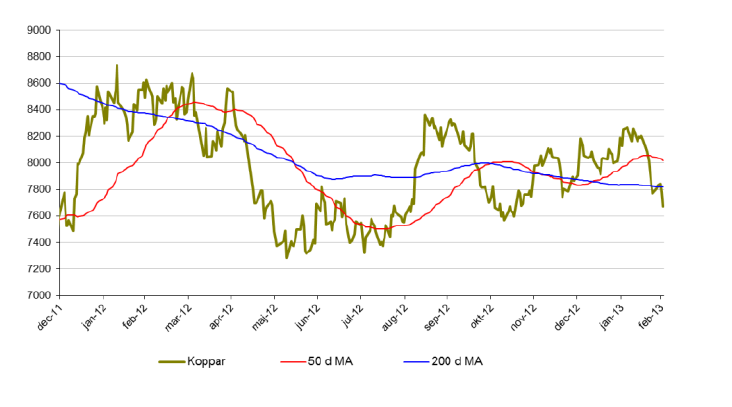
- Med risk att bli för tjatig så är koppar inget undantag. En stark start på året har växlat till en negativ trend.
- Koppar är för året ned 7% från att ha varit plus 5 % i början av februari.
- Koppar handlas just nu över
- Tillväxtländernas förbrukning kommer styra mycket under 2013.
Zink
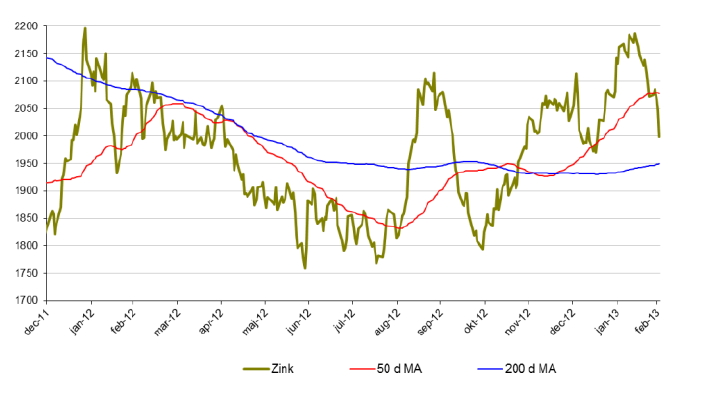
- Zink är för året ned 2,5 %.
- Sedan mitten av februari har zinkpriset fallit med 8 %.
- Zink handlas snart i regionen kring golvet i den stigande trendkanalen. Rekyler där kan vara intressanta att bevaka.
Nickel
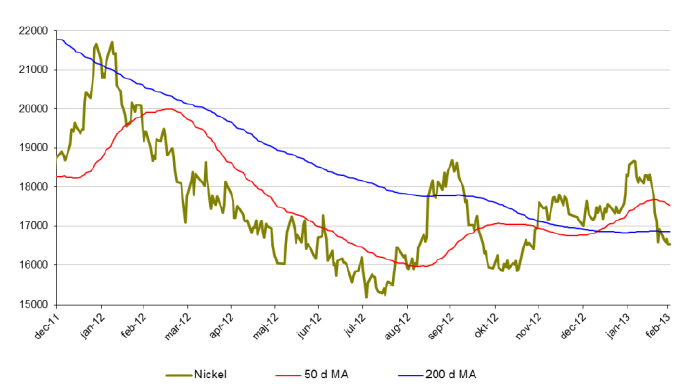
- Nickel är för året ned drygt 3 %.
- Under februari tappade nickel nästan 11 %.
- Nickel presterade sämst av alla basmetaller under 2012. Slutsiffran blev -8 % för 2012.
- Nickelmarknaden är fortsatt mättad med ökande lager.
- Många stora projekt inom nickelproduktion är redan finansierade och irreversibla vilket kommer att öka tillgången av nickel ytterligare.
Råvaror – Jordbruk
Socker
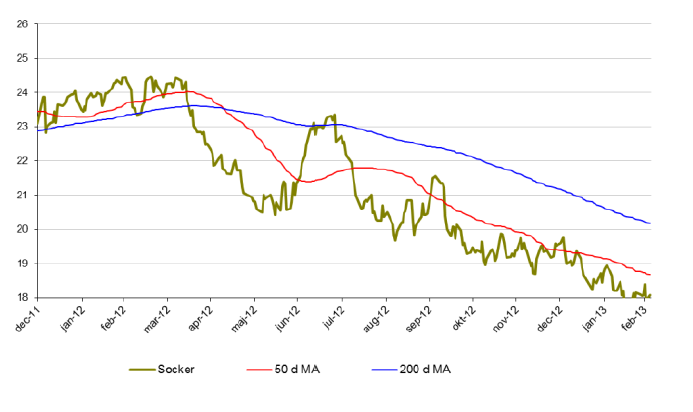
- Sockers kräftgång fortsätter. Sedan oktober förra året är sockerpriset ned 17 %.
- För året är sockerpriset ned knappt 8 %.
Bomull
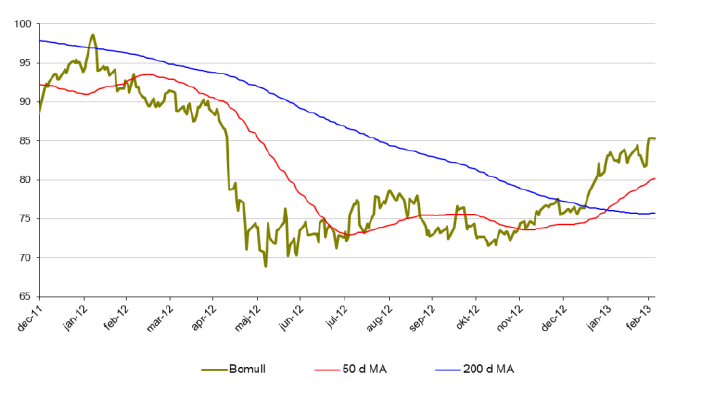
- Bomullspriset utvecklas starkt under början av 2013.
- För året är priset på bomull upp 13,7 %.
- Under februari månad är bomull upp 1,2 %.
- Sedan november 2012 är priset på bomull upp 22 %.
Majs
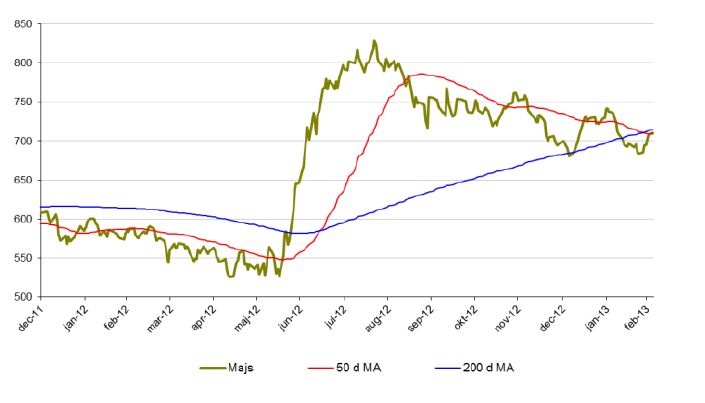
- Rekordstora skördar väntas i USA vilket kan pressa priset på majs.
- För året är dock majs upp 5 %.
- Under februari föll priset på majs med 1,7 % men köparna kom i slutet på månaden tillbaka.
Vete
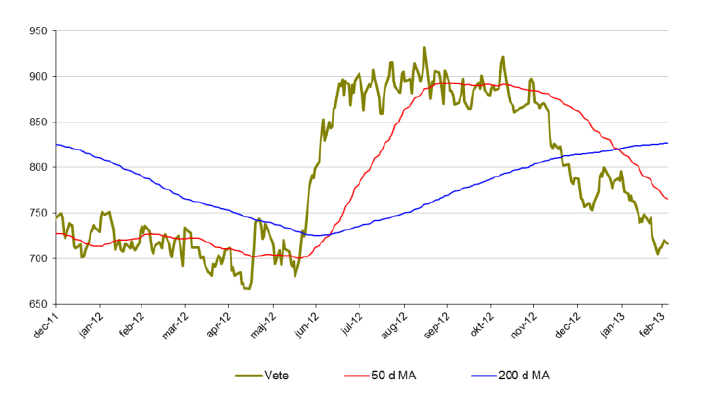
- Vete befinner sig i en negativ trend. Sedan i mitten av november 2012 har priset på vete backat med drygt 20 %.
- För året är vete ned 10 %.
- Under februari månad tappade vete 9 %.
Apelsinjuice
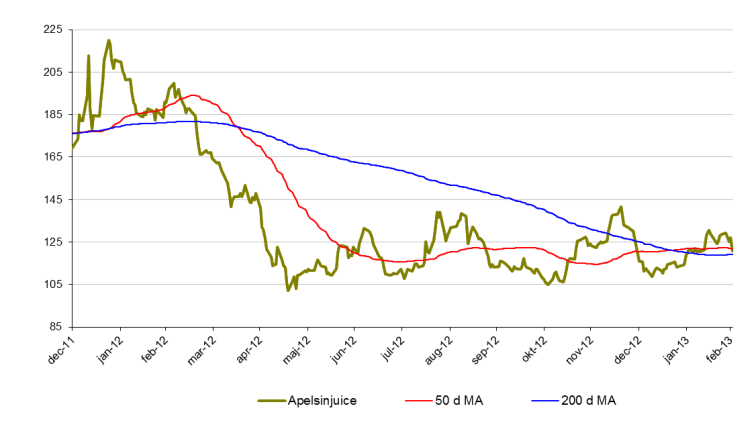
- Vi har länge bevakat apelsinjuice i Tradingklubben.
- Apelsinjuice konsoliderar nu och känns svårtippad.
- För året är apelsinjuice upp 4 %.
- Priset på apelsinjuice är fortfarande 70 % högre än botten 2009. Fallhöjden är således hög. Mycket hög.
Kaffe
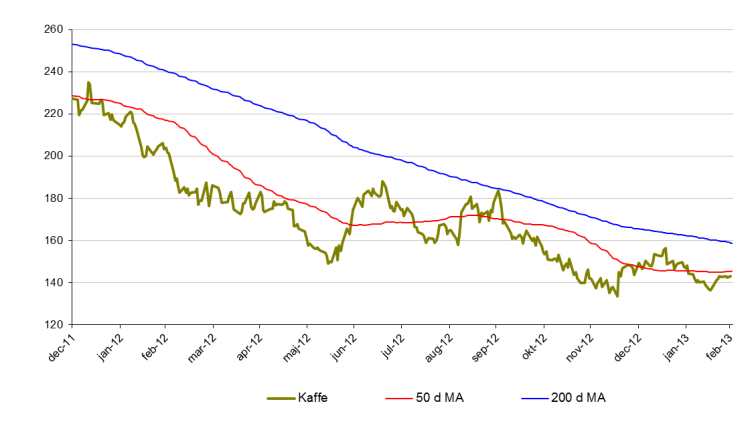
- Kaffe ligger fortfarande i en långsiktigt nedåtgående trend.
- För året är kaffe ned 2%.
- Viktigt stödområde kring 135$.
[box]Denna uppdatering är producerat av SIP Nordic och publiceras i samarbete och med tillstånd på Råvarumarknaden.se[/box]
Ansvarsbegränsning
Detta produktblad utgör endast marknadsföring och har sammanställts av SIP Nordic Fondkommission AB.
Innehållet ger inte fullständig information avseende det finansiella instrumentet. Investerare uppmanas att del av prospekt och slutliga villkor, vilka finns tillgängliga på: www.rbsbank.se/markets, innan ett investeringsbeslut tas.
Förekommande exempel är simulerade och baseras på SIP Nordics egna beräkningar och antaganden, en person som använder andra data eller antaganden kan nå andra resultat. Administrativa avgifter och transaktionsavgifter påverkar den faktiska avkastningen.
Analys
More weakness and lower price levels ahead, but the world won’t drown in oil in 2026

Some rebound but not much. Brent crude rebounded 1.5% yesterday to $65.47/b. This morning it is inching 0.2% up to $65.6/b. The lowest close last week was on Thursday at $64.11/b.

The curve structure is almost as week as it was before the weekend. The rebound we now have gotten post the message from OPEC+ over the weekend is to a large degree a rebound along the curve rather than much strengthening at the front-end of the curve. That part of the curve structure is almost as weak as it was last Thursday.
We are still on a weakening path. The message from OPEC+ over the weekend was we are still on a weakening path with rising supply from the group. It is just not as rapidly weakening as was feared ahead of the weekend when a quota hike of 500 kb/d/mth for November was discussed.
The Brent curve is on its way to full contango with Brent dipping into the $50ies/b. Thus the ongoing weakening we have had in the crude curve since the start of the year, and especially since early June, will continue until the Brent crude oil forward curve is in full contango along with visibly rising US and OECD oil inventories. The front-month Brent contract will then flip down towards the $60/b-line and below into the $50ies/b.
At what point will OPEC+ turn to cuts? The big question then becomes: When will OPEC+ turn around to make some cuts? At what (price) point will they choose to stabilize the market? Because for sure they will. Higher oil inventories, some more shedding of drilling rigs in US shale and Brent into the 50ies somewhere is probably where the group will step in.
There is nothing we have seen from the group so far which indicates that they will close their eyes, let the world drown in oil and the oil price crash to $40/b or below.
The message from OPEC+ is also about balance and stability. The world won’t drown in oil in 2026. The message from the group as far as we manage to interpret it is twofold: 1) Taking back market share which requires a lower price for non-OPEC+ to back off a bit, and 2) Oil market stability and balance. It is not just about 1. Thus fretting about how we are all going to drown in oil in 2026 is totally off the mark by just focusing on point 1.
When to buy cal 2026? Before Christmas when Brent hits $55/b and before OPEC+ holds its last meeting of the year which is likely to be in early December.
Brent crude oil prices have rebounded a bit along the forward curve. Not much strengthening in the structure of the curve. The front-end backwardation is not much stronger today than on its weakest level so far this year which was on Thursday last week.

The front-end backwardation fell to its weakest level so far this year on Thursday last week. A slight pickup yesterday and today, but still very close to the weakest year to date. More oil from OPEC+ in the coming months and softer demand and rising inventories. We are heading for yet softer levels.

Analys
A sharp weakening at the core of the oil market: The Dubai curve

Down to the lowest since early May. Brent crude has fallen sharply the latest four days. It closed at USD 64.11/b yesterday which is the lowest since early May. It is staging a 1.3% rebound this morning along with gains in both equities and industrial metals with an added touch of support from a softer USD on top.

What stands out the most to us this week is the collapse in the Dubai one to three months time-spread.
Dubai is medium sour crude. OPEC+ is in general medium sour crude production. Asian refineries are predominantly designed to process medium sour crude. So Dubai is the real measure of the balance between OPEC+ holding back or not versus Asian oil demand for consumption and stock building.
A sharp weakening of the front-end of the Dubai curve. The front-end of the Dubai crude curve has been holding out very solidly throughout this summer while the front-end of the Brent and WTI curves have been steadily softening. But the strength in the Dubai curve in our view was carrying the crude oil market in general. A source of strength in the crude oil market. The core of the strength.
The now finally sharp decline of the front-end of the Dubai crude curve is thus a strong shift. Weakness in the Dubai crude marker is weakness in the core of the oil market. The core which has helped to hold the oil market elevated.
Facts supports the weakening. Add in facts of Iraq lifting production from Kurdistan through Turkey. Saudi Arabia lifting production to 10 mb/d in September (normal production level) and lifting exports as well as domestic demand for oil for power for air con is fading along with summer heat. Add also in counter seasonal rise in US crude and product stocks last week. US oil stocks usually decline by 1.3 mb/week this time of year. Last week they instead rose 6.4 mb/week (+7.2 mb if including SPR). Total US commercial oil stocks are now only 2.1 mb below the 2015-19 seasonal average. US oil stocks normally decline from now to Christmas. If they instead continue to rise, then it will be strongly counter seasonal rise and will create a very strong bearish pressure on oil prices.
Will OPEC+ lift its voluntary quotas by zero, 137 kb/d, 500 kb/d or 1.5 mb/d? On Sunday of course OPEC+ will decide on how much to unwind of the remaining 1.5 mb/d of voluntary quotas for November. Will it be 137 kb/d yet again as for October? Will it be 500 kb/d as was talked about earlier this week? Or will it be a full unwind in one go of 1.5 mb/d? We think most likely now it will be at least 500 kb/d and possibly a full unwind. We discussed this in a not earlier this week: ”500 kb/d of voluntary quotas in October. But a full unwind of 1.5 mb/d”
The strength in the front-end of the Dubai curve held out through summer while Brent and WTI curve structures weakened steadily. That core strength helped to keep flat crude oil prices elevated close to the 70-line. Now also the Dubai curve has given in.

Brent crude oil forward curves

Total US commercial stocks now close to normal. Counter seasonal rise last week. Rest of year?

Total US crude and product stocks on a steady trend higher.

Analys
OPEC+ will likely unwind 500 kb/d of voluntary quotas in October. But a full unwind of 1.5 mb/d in one go could be in the cards

Down to mid-60ies as Iraq lifts production while Saudi may be tired of voluntary cut frugality. The Brent December contract dropped 1.6% yesterday to USD 66.03/b. This morning it is down another 0.3% to USD 65.8/b. The drop in the price came on the back of the combined news that Iraq has resumed 190 kb/d of production in Kurdistan with exports through Turkey while OPEC+ delegates send signals that the group will unwind the remaining 1.65 mb/d (less the 137 kb/d in October) of voluntary cuts at a pace of 500 kb/d per month pace.

Signals of accelerated unwind and Iraqi increase may be connected. Russia, Kazakhstan and Iraq were main offenders versus the voluntary quotas they had agreed to follow. Russia had a production ’debt’ (cumulative overproduction versus quota) of close to 90 mb in March this year while Kazakhstan had a ’debt’ of about 60 mb and the same for Iraq. This apparently made Saudi Arabia angry this spring. Why should Saudi Arabia hold back if the other voluntary cutters were just freeriding? Thus the sudden rapid unwinding of voluntary cuts. That is at least one angle of explanations for the accelerated unwinding.
If the offenders with production debts then refrained from lifting production as the voluntary cuts were rapidly unwinded, then they could ’pay back’ their ’debts’ as they would under-produce versus the new and steadily higher quotas.
Forget about Kazakhstan. Its production was just too far above the quotas with no hope that the country would hold back production due to cross-ownership of oil assets by international oil companies. But Russia and Iraq should be able to do it.
Iraqi cumulative overproduction versus quotas could reach 85-90 mb in October. Iraq has however steadily continued to overproduce by 3-5 mb per month. In July its new and gradually higher quota came close to equal with a cumulative overproduction of only 0.6 mb that month. In August again however its production had an overshoot of 100 kb/d or 3.1 mb for the month. Its cumulative production debt had then risen to close to 80 mb. We don’t know for September yet. But looking at October we now know that its production will likely average close to 4.5 mb/d due to the revival of 190 kb/d of production in Kurdistan. Its quota however will only be 4.24 mb/d. Its overproduction in October will thus likely be around 250 kb/d above its quota with its production debt rising another 7-8 mb to a total of close to 90 mb.
Again, why should Saudi Arabia be frugal while Iraq is freeriding. Better to get rid of the voluntary quotas as quickly as possible and then start all over with clean sheets.
Unwinding the remaining 1.513 mb/d in one go in October? If OPEC+ unwinds the remaining 1.513 mb/d of voluntary cuts in one big go in October, then Iraq’s quota will be around 4.4 mb/d for October versus its likely production of close to 4.5 mb/d for the coming month..
OPEC+ should thus unwind the remaining 1.513 mb/d (1.65 – 0.137 mb/d) in one go for October in order for the quota of Iraq to be able to keep track with Iraq’s actual production increase.
October 5 will show how it plays out. But a quota unwind of at least 500 kb/d for Oct seems likely. An overall increase of at least 500 kb/d in the voluntary quota for October looks likely. But it could be the whole 1.513 mb/d in one go. If the increase in the quota is ’only’ 500 kb/d then Iraqi cumulative production will still rise by 5.7 mb to a total of 85 mb in October.
Iraqi production debt versus quotas will likely rise by 5.7 mb in October if OPEC+ only lifts the overall quota by 500 kb/d in October. Here assuming historical production debt did not rise in September. That Iraq lifts its production by 190 kb/d in October to 4.47 mb/d (August level + 190 kb/d) and that OPEC+ unwinds 500 kb/d of the remining quotas in October when they decide on this on 5 October.

-

 Nyheter4 veckor sedan
Mahvie Minerals i en guldtrend
-

 Analys4 veckor sedan
Volatile but going nowhere. Brent crude circles USD 66 as market weighs surplus vs risk
-
 Nyheter4 veckor sedan
Aktier i guldbolag laggar priset på guld
-

 Nyheter3 veckor sedan
Kinas elproduktion slog nytt rekord i augusti, vilket även kolkraft gjorde
-

 Nyheter3 veckor sedan
Tyskland har så höga elpriser att företag inte har råd att använda elektricitet
-
 Nyheter4 veckor sedan
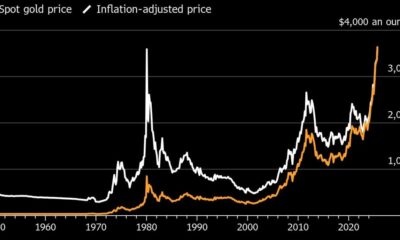
Guld når sin högsta nivå någonsin, nu även justerat för inflation
-
 Nyheter4 veckor sedan
Det stigande guldpriset en utmaning för smyckesköpare
-

 Analys4 veckor sedan
Waiting for the surplus while we worry about Israel and Qatar


