

Analys
SHB Råvarubrevet 1 mars 2013

 Råvaror allmänt
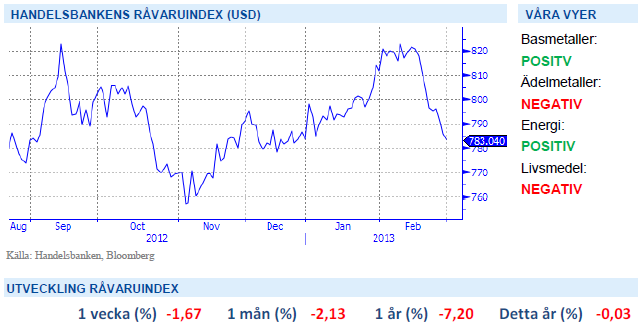
Ytterligare svag vecka för råvarorna
Dödläget efter italienska valet tillsammans oron över kommande finanspolitiska åtstramningar i USA utöver en svagare aktiemarknad har lett råvarorna nedåt under ytterligare en svag vecka. Värst drabbad var åter nickel som nu tappat 11 % från sin högsta notering under februari. Även om vissa datautfall som inköpschefsindex för EMU-området och Kina varit något sämre än väntat har dataskörden överlag varit fortsatt god. För Kina sjönk PMI för februari till 50,1 från januari 50,4 (väntat var 50,5).
Som vanligt är data från Kina svårtolkad under första kvartalet då effekterna av ledigheten efter det kinesiska nyåret ibland infaller i januari och ibland i februari. Årets börsrally har fortsatt att sätta positivt avtryck i företagens och hushållens stämningsläge, skattehöjningar och nedskärningar till trots. Den bild vi har av makroutvecklingen ger stöd för uppgång för konjunkturhandlade råvaror. I USA handlar det om att hushållen svarar mot den förbättring som äger rum på bostadsmarknaden. Skattehöjningar, nedskärningar och kanske även en minskning av federala utgifter i slutet av april utgör motvindar. Detta har dock hittills motverkats av positiva förmögenhets- och sentimentseffekter.
Vi återgår även till negativ vy för livsmedel, trots risk för fortsatt torka i USA tror vi att dagens nivåer på spannmål är alltjämnt för höga.
Basmetaller
Metallernas fall fortsätter
Basmetallerna lägger ytterligare en vecka bakom sig med fallande priser. Ett sämre PMI än väntat från Kina ger metallerna fortsatt skjuts nedåt under fredagen. Nickel föll under veckan med 3 % och koppar med 2,2 %. Stigande lager på både koppar (+7 % under veckan) och nickel (+2,8 % under veckan) ger också stöd åt bilden.
Basmetallerna har svajat omkring bland sina tekniska handelsintervall styrda av de olika glidande medelvärdena. Vi tycker att nedgången i basmetaller är driven av kortsiktig besvikelse och har väldigt lite med realekonomin att göra. Därför ser vi de svaga basmetallerna som köpvärda. Vi fortsätter hålla nickel och koppar som de bästa alternativen för att kapitalisera på ett starkare Kina.
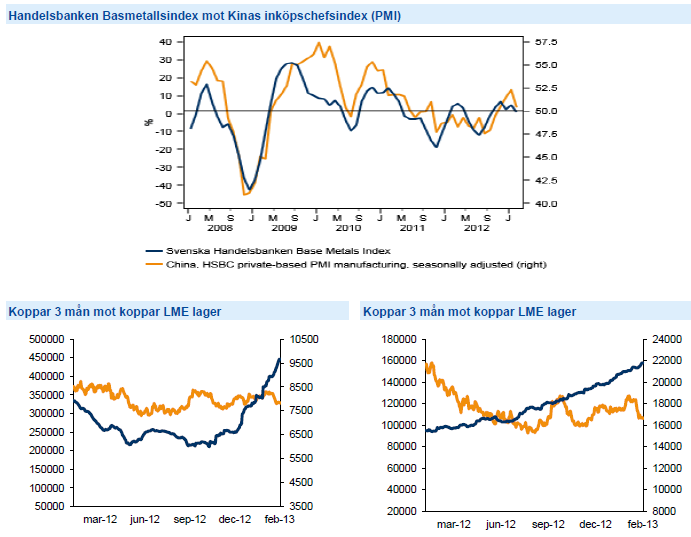
Trots nedgången senaste veckorna tror vi på högre priser på basmetaller och ser istället möjlighet till ”buy on dip”. Vi tror på: BASMET H
Ädelmetaller
Dödskors för guld
Under förra veckan inträffade vad som bland tekniska analytiker brukar kallas ett dödskors. Det korta glidande medelvärdet på 50 dagar skär då ner igenom det långa glidande medelvärdet på 200 dagar. Det brukar ofta signalera ett trendskifte nedåt för en marknad. Det omvända kallas guldkors och signalerar ett köpläge för en marknad som bryter uppåt. För guld var detta dödskors det fjärde på sex år och nu väntar investerare med andan i halsen på utvecklingen denna gång. Även om guldraset summerar till över 5 % i februari tror vi att resan nedåt bara har börjat.
Guldet handlas svagt ned under veckan trots en stark början med en uppgång på 2,3 % som en respons på oron efter italienska valet och Bernankes tal i tisdags kväll som minskade oron för att QE3 kommer tas bort tidigare än väntat. Starkare dollar och högre räntor blir utmanande för guldet samtidigt som inflationen väntas vara låg under året. Vi behåller vår negativa vy för ädelmetallerna.
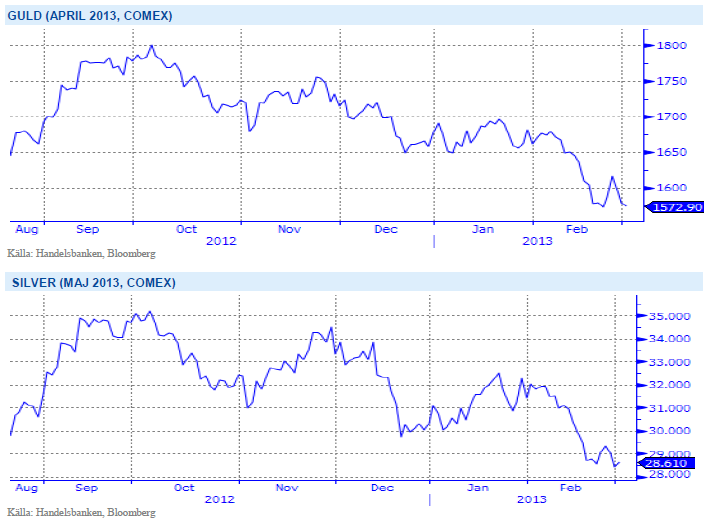
Starkare dollar och högre räntor blir utmanande för guldet samtidigt som inflationen väntas vara låg under året. Vi tror på: GULD S H
Energi
Iran i samtal om atomprogram
Oljan har också haft en tuff vecka där vi har fått se brent-oljan tillbaka på 110- nivån efter att legat om-kring 118 dollar under de två tidigare veckorna. Vi tycker att det är köpläge i råolja men såklart finns en hög risk på grund av senaste tidens oro på marknaderna. P5+1 (USA, U.K., Frankrike, Tyskland, Kina och Ryssland) träffade under veckan Iran i Almaty, Kazakhstan för att diskutera Irans atomprogram. Inga detaljer har släppts efter mötet där maktnationerna vill begränsa Irans atomprogram i utbyte mot att ta bort sanktionerna mot Irans oljeexport. Israel har hotat att bomba Irans atomenheter ifall samtalen inte leder till resultat. Nya möten ska upptas i mars.
En stilla elmarknad där kvartalskontraktet handlas upp någon procent till månadshögsta 37 euro som ett resultat av en något torrare väderutveckling. Energi-balansen oförändrad på ca -10 TWh och brytpriset på kol kvar strax under 36 euro för Q2 2013 efter att både kol och CO2 återhämtat sig något. Utsläppsrätterna föll 17 procent efter nytt besked om att flytta fram beslutet kring en förskjuten tilldelning. Samtidigt signalerar Tyskland att man står bakom en reform av EU ETS och eventuell backloading vilket bidrog till en återhämtning eftersom Tyskland med sin tyngd sannolikt kan komma att påverka att förslagen går igenom. Vi förväntar oss att rätterna handlas kvar på nuvarande nivå kring 5 euro.
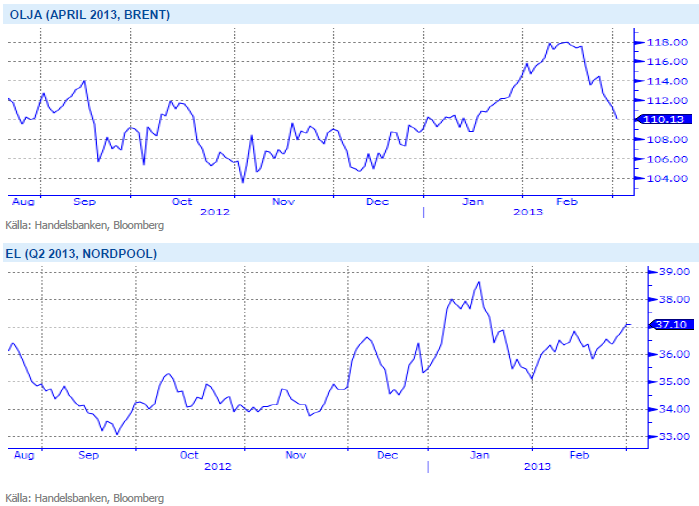
Den råvarugrupp som är mest beroende av den globala konjunkturen är Energi och med en starkare konjunktur ser vi positivt på utvecklingen för denna sektor. Vi tror på: ENERGI H
Livsmedel
Kaffepriset får stöd
Under senare delen av februari har vi sett starka kaffepriser. De colombianska kaffeodlarna har pressat upp priserna efter ovilja att sälja på den senaste tidens låga nivåer. Även uteblivet regn i centrala Vietnam har gett stöd i veckan. De låga vattennivåerna ökar risken för minskad skörd nästa säsong. Skörden i Centralamerika är så gott som färdig med 20 procent av årets skörd beräknas vara skadat. Export från Indonesien, som världens tredje största Robusta producent, beräknas minska i takt med ökad inhemsk konsumtion, trots rekordskördar i området. Vi tror att marknaden prisat in dessa nyheter redan och anser att fortsatt uppsida är begränsad.
Under senaste veckan har vi kunnat notera stigande vetepriser som en följd av fortsatt torka i de amerikanska vetefälten men även i EU-området väntas regnet utebli. Med förväntat höga amerikanska majs-skördar, dagens historiskt höga vetepriser och än så länge inga dramatiska väderförändringar så ändrar vi vår vy från neutral till negativ på livsmedel och tror på fallande vetepriser.
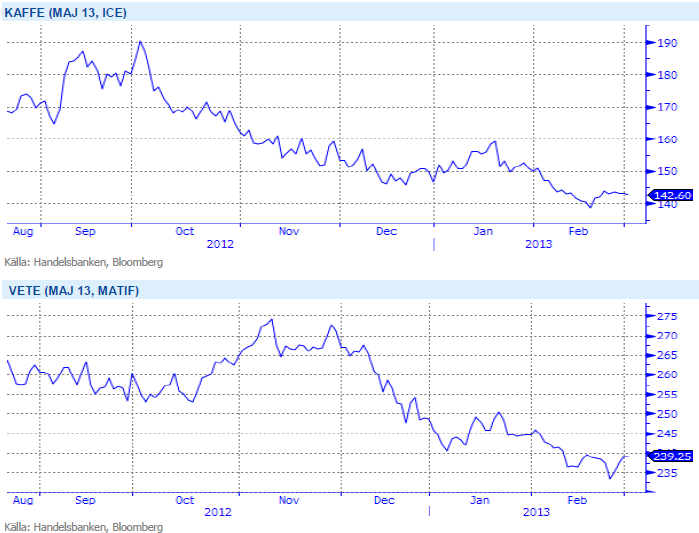
Vi återgår till negative syn för soja, majs och vete, trots riskerna för torrt väder i USA. Normal väderlek bör ge press på spannmålspriserna. Vi tror på: LIVSMEDEL S H
Handelsbankens Råvaruindex
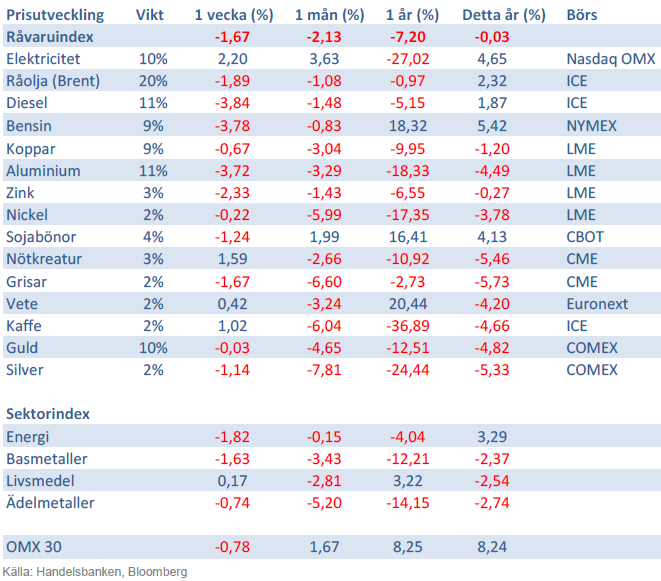
Handelsbankens råvaruindex består av de underliggande indexen för respektive råvara. Vikterna är bestämda till hälften från värdet av nordisk produktion (globala produktionen för sektorindex) och till hälften från likviditeten i terminskontrakten.
[box]SHB Råvarubrevet är producerat av Handelsbanken och publiceras i samarbete och med tillstånd på Råvarumarknaden.se[/box]
Ansvarsbegränsning
Detta material är producerat av Svenska Handelsbanken AB (publ) i fortsättningen kallad Handelsbanken. De som arbetar med innehållet är inte analytiker och materialet är inte oberoende investeringsanalys. Innehållet är uteslutande avsett för kunder i Sverige. Syftet är att ge en allmän information till Handelsbankens kunder och utgör inte ett personligt investeringsråd eller en personlig rekommendation. Informationen ska inte ensamt utgöra underlag för investeringsbeslut. Kunder bör inhämta råd från sina rådgivare och basera sina investeringsbeslut utifrån egen erfarenhet.
Informationen i materialet kan ändras och också avvika från de åsikter som uttrycks i oberoende investeringsanalyser från Handelsbanken. Informationen grundar sig på allmänt tillgänglig information och är hämtad från källor som bedöms som tillförlitliga, men riktigheten kan inte garanteras och informationen kan vara ofullständig eller nedkortad. Ingen del av förslaget får reproduceras eller distribueras till någon annan person utan att Handelsbanken dessförinnan lämnat sitt skriftliga medgivande. Handelsbanken ansvarar inte för att materialet används på ett sätt som strider mot förbudet mot vidarebefordran eller offentliggörs i strid med bankens regler.


Parts of the Brent crude curve dipping into the high $50ies/b. Brent crude fell 2.3% over the week to Friday. It closed the week at $61.29/b, a slight gain on the day, but also traded to a low of $60.14/b that same day and just barely avoided trading into the $50ies/b. This morning it is risk-on in equities which seems to help industrial metals a little higher. But no such luck for oil. It is down 0.8% at $60.8/b. This week looks set for Brent crude to dip its feet in the $50ies/b. The Brent 3mth contract actually traded into the high $50ies/b on Friday.

The front-end backwardation has been on a weakening foot and is now about to fully disappear. The lowest point of the crude oil curve has also moved steadily lower and lower and its discount to the 5yr contract is now $6.8/b. A solid contango. The Brent 3mth contract did actually dip into the $50ies/b intraday on Friday when it traded to a low point of $59.93/b.
More weakness to come as lots of oil at sea comes to ports. Mid-East OPEC countries have boosted exports along with lower post summer consumption and higher production. The result is highly visibly in oil at sea which increased by 17 mb to 1,311 mb over the week to Sunday. Up 185 mb since mid-August. On its way to discharge at a port somewhere over the coming month or two.
Don’t forget that the oil market path ahead is all down to OPEC+. Remember that what is playing out in the oil market now is all by design by OPEC+. The group has decided that the unwind of the voluntary cuts is what it wants to do. In a combination of meeting demand from consumers as well as taking back market share. But we need to remember that how this plays out going forward is all at the mercy of what OPEC+ decides to do. It will halt the unwinding at some point. It will revert to cuts instead of unwind at some point.
A few months with Brent at $55/b and 40-50 US shale oil rigs kicked out may be what is needed. We think OPEC+ needs to see the exit of another 40-50 drilling rigs in the US shale oil patches to set US shale oil production on a path to of a 1 mb/d year on year decline Dec-25 to Dec-26. We are not there yet. But a 2-3 months period with Brent crude averaging $55/b would probably do it.
Oil on water increased 17 mb over the week to Sunday while oil in transit increased by 23 mb. So less oil was standing still. More was moving.

Crude oil floating storage (stationary more than 7 days). Down 11 mb over week to Sunday

The lowest point of the Brent crude oil curve versus the 5yr contract. Weakest so far this year.

Crude oil 1mth to 3mth time-spreads. Dubai held out strongly through summer, but then that center of strength fell apart in late September and has been leading weakness in crude curves lower since then.

Rebounding along with most markets. But concerns over solidity of Gaza peace may also contribute. Brent crude fell 0.8% yesterday to $61.91/b and its lowest close since May this year. This morning it is bouncing up 0.9% to $62.5/b along with a softer USD amid positive sentiment with both equities and industrial metals moving higher. Concerns that the peace in Gaza may be less solid than what one might hope for also yields some support to Brent. Bets on tech stocks are rebounding, defying fears of trade war. Money moving back into markets. Gold continues upwards its strong trend and a softer dollar helps it higher today as well.
US crude & products probably rose 5.6 mb last week (API) versus a normal seasonal decline of 2.4 mb. The US API last night partial and thus indicative data for US oil inventories. Their data indicates that US crude stocks rose 7.4 mb last week, gasoline stocks rose 3.0 mb while Distillate stocks fell 4.8 mb. Altogether an increase in commercial crude and product stocks of 5.6 mb. Commercial US crude and product stocks normally decline by 2.4 mb this time of year. So seasonally adjusted the US inventories rose 8 mb last week according to the indicative numbers by the API. That is a lot. Also, the counter seasonal trend of rising stocks versus normally declining stocks this time of year looks on a solid pace of continuation. If the API is correct then total US crude and product stocks would stand 41 mb higher than one year ago and 6 mb higher than the 2015-19 average. And if we combine this with our knowledge of a sharp increase in production and exports by OPEC(+) and a large increase in oil at sea, then the current trend in US oil inventories looks set to continue. So higher stocks and lower crude oil prices until OPEC(+) switch to cuts. Actual US oil inventory data today at 18:00 CET.
US commercial crude and product stocks rising to 1293 mb in week 41 if last nights indicative numbers from API are correct.

Crude oil soon coming to a port near you. OPEC has lifted production sharply higher this autumn. At the same time demand for oil in the Middle-East has fallen as we have moved out of summer heat and crude oil burn for power for air-conditioning. The Middle-East oil producers have thus been able to lift exports higher on both accounts. Crude oil and condensates on water has shot up by 177 mb since mid-August. This oil is now on its way to ports around the world. And when they arrive, it will likely help to lift stocks onshore higher. That is probably when we will lose the last bit of front-end backwardation the the crude oil curves. That will help to drive the front-month Brent crude oil price down to the $60/b line and revisit the high $50ies/b. Then the eyes will be all back on OPEC+ when they meet in early November and then again in early December.
Crude oil and condensates at sea have moved straight up by 177 mb since mid-August as OPEC(+) has produced more, consumed less and exported more.

When it starts to move lower it moves rather quickly. Gaza, China, IEA. Brent crude is down 2.1% today to $62/b after having traded as high as $66.58/b last Thursday and above $70/b in late September. The sell-off follows the truce/peace in Gaze, a flareup in US-China trade and yet another bearish oil outlook from the IEA.
A lasting peace in Gaze could drive crude oil at sea to onshore stocks. A lasting peace in Gaza would probably calm down the Houthis and thus allow more normal shipments of crude oil to sail through the Suez Canal, the Red Sea and out through the Bab-el-Mandeb Strait. Crude oil at sea has risen from 48 mb in April to now 91 mb versus a pre-Covid normal of about 50-60 mb. The rise to 91 mb is probably the result of crude sailing around Africa to be shot to pieces by the Houthis. If sailings were to normalize through the Suez Canal, then it could free up some 40 mb in transit at sea moving onshore into stocks.
The US-China trade conflict is of course bearish for demand if it continues.
Bearish IEA yet again. Getting closer to 2026. Credibility rises. We expect OPEC to cut end of 2025. The bearish monthly report from the IEA is what it is, but the closer we get to 2026, the more likely the IEA is of being ball-park right in its outlook. In its monthly report today the IEA estimates that the need for crude oil from OPEC in 2026 will be 25.4 mb/d versus production by the group in September of 29.1 mb/d. The group thus needs to do some serious cutting at the end of 2025 if it wants to keep the market balanced and avoid inventories from skyrocketing. Given that IEA is correct that is. We do however expect OPEC to implement cuts to avoid a large increase in inventories in Q1-26. The group will probably revert to cuts either at its early December meeting when they discuss production for January or in early January when they discuss production for February. The oil price will likely head yet lower until the group reverts to cuts.
Dubai: The Mid-East anchor dragging crude oil lower. Surplus emerging in Mid-East pricing. Crude oil prices held surprisingly strong all through the summer. A sign and a key source of that strength came from the strength in the front-end backwardation of the Dubai crude oil curve. It held out strong from mid-June and all until late September with an average 1-3mth time-spread premium of $1.8/b from mid-June to end of September. The 1-3mth time-spreads for Brent and WTI however were in steady deterioration from late June while their flat prices probably were held up by the strength coming from the Persian Gulf. Then in late September the strength in the Dubai curve suddenly collapsed. Since the start of October it has been weaker than both the Brent and the WTI curves. The Dubai 1-3mth time-spread now only stands at $0.25/b. The Middle East is now exporting more as it is producing more and also consuming less following elevated summer crude burn for power (Aircon) etc.
The only bear-element missing is a sudden and solid rise in OECD stocks. The only thing that is missing for the bear-case everyone have been waiting for is a solid, visible rise in OECD stocks in general and US oil stocks specifically. So watch out for US API indications tomorrow and official US oil inventories on Thursday.
No sign of any kind of fire-sale of oil from Saudi Arabia yet. To what we can see, Saudi Arabia is not at all struggling to sell its oil. It only lowered its Official Selling Prices (OSPs) to Asia marginally for November. A surplus market + Saudi determination to sell its oil to the market would normally lead to a sharp lowering of Saudi OSPs to Asia. Not yet at least and not for November.
The 5yr contract close to fixed at $68/b. Of importance with respect to how far down oil can/will go. When the oil market moves into a surplus then the spot price starts to trade in a large discount to the 5yr contract. Typically $10-15/b below the 5yr contract on average in bear-years (2009, 2015, 2016, 2020). But the 5yr contract is usually pulled lower as well thus making this approach a moving target. But the 5yr contract price has now been rock solidly been pegged to $68/b since 2022. And in the 2022 bull-year (Brent spot average $99/b), the 5yr contract only went to $72/b on average. If we assume that the same goes for the downside and that 2026 is a bear-year then the 5yr goes to $64/b while the spot is trading at a $10-15/b discount to that. That would imply an average spot price next year of $49-54/b. But that is if OPEC doesn’t revert to cuts and instead keeps production flowing. We think OPEC(+) will trim/cut production as needed into 2026 to prevent a huge build-up in global oil stocks and a crash in prices. But for now we are still heading lower. Into the $50ies/b.


Australien och USA investerar 8,5 miljarder USD för försörjningskedja av kritiska mineraler
Brent crude set to dip its feet into the high $50ies/b this week

Vad guldets uppgång egentligen betyder för världen

Spotpriset på guld över 4300 USD och silver över 54 USD
Crude oil soon coming to a port near you

OPEC+ missar produktionsmål, stöder oljepriserna

Goldman Sachs höjer prognosen för guld, tror priset når 4900 USD

Ett samtal om guld, olja, fjärrvärme och förnybar energi

Blykalla och amerikanska Oklo inleder ett samarbete
Guld nära 4000 USD och silver 50 USD, därför kan de fortsätta stiga
-
 Nyheter4 veckor sedan
OPEC+ missar produktionsmål, stöder oljepriserna
-
 Nyheter2 veckor sedan
Goldman Sachs höjer prognosen för guld, tror priset når 4900 USD
-
 Nyheter4 veckor sedan
Ett samtal om guld, olja, fjärrvärme och förnybar energi
-
 Nyheter3 veckor sedan
Blykalla och amerikanska Oklo inleder ett samarbete
-
 Nyheter3 veckor sedan
Guld nära 4000 USD och silver 50 USD, därför kan de fortsätta stiga
-
Analys4 veckor sedan
Are Ukraine’s attacks on Russian energy infrastructure working?
-

 Nyheter4 veckor sedan
Guldpriset uppe på nya höjder, nu 3750 USD
-
Nyheter3 veckor sedan
Ett samtal om guld, olja, koppar och stål