

Analys
SHB Råvarubrevet 2 november 2012
 Veckan bjöd på några gröna skott
Vi lämnar nu oktober och vi kan konstatera att månaden som gått bjöd på fallande priser på råvaror. Prisfallet på både metaller och energi ledde till att råvaror har haft det största fallet sedan maj under oktober månad med 4 %. Därmed ligger nedgången i paritet med börsen för samma period. Investerares optimism grusades av bland annat att IMF reviderade ner de globala utsikterna för tillväxt. Kina har rapporterat det sjunde kvartalet i rad med fallande tillväxt och inbromsningen i de 17 euroländerna fortsätter.
Bolagsrapporter har varit sämre än väntat och det har gjort att pessimism har spridit sig till råvarorna. Blickar vi framåt talar mycket för att Kinas ekonomi åter börjar få fotfäste och att botten på den kinesiska konjunkturen var under det tredje kvartalet. Veckan bjöd på några gröna skott i form av bra inköpschefsindex i USA och Kina. Den mest framåtblickande komponenten i inköpschefsindex, nya order, steg både i Kina och USA. Vi fortsätter därför att vara positiva till råvaror som tillgångsslag trots den motiga utvecklingen på marknaden under september. Antalet nya jobb i USA slog också förväntningarna idag och ger stöd åt USA:s återhämtning.

Basmetallerna
Är Kina på väg tillbaka?
Basmetallpriserna har under veckan utvecklats mestadels positivt. Alla metallerna har gått upp, med undantag för koppar som fallit cirka 1,3 % i pris. Zink och bly har visat på kraftiga uppgångar, upp respektive 2.2 % och 5,3 %. Under fredag eftermiddag föll basmetallerna på bred front på en förstärkt dollar.
Kopparpriset föll för den fjärde veckan i rad, främst till följd av höga lagernivåer i Shanghai. Uppgången i blypriset kunde förklaras med statistik som visade att produktionen hade fallit med 10 % i oktober, vilket var det största minskningen sedan i januari. Vi är fortsatt positiva till basmetallpriserna då vi ser tecken på att konjunkturen håller på att få upp farten i Kina och USA.

Buy on dips är intressant på basmetaller just nu. Under oktober har basmetallerna haft ett kraftigt ras, efter den kraftiga uppgången i september. Finansmarknaden hade handlat in för mycket på för kort tid. Däremot ser Kinadata allt bättre ut nu. Vi tror på: BASMET H
Ädelmetaller
Kalldusch för guldet efter jobbdata från USA
Positiva arbetsmarknadssiffror från USA och en stärkt dollar fick guldpriset att falla kraftigt under fredagseftermiddag. I skrivande stund handlas guldet på 1685 USD/uns – det är 1,85 % lägre än dagens öppning. Platinum har däremot stärkts under veckan från förra veckans nedgångar, men uppgången raderades under fredagen och platinum stänger veckan i oförändrad.
Arbetet vid guldgruvorna i Sydafrika är nu delvis återupptaget men utdragna rättsprocesser är att vänta. Gold Fields, världens fjärde största producent, uppskattar att strejkerna har kostat företaget uppåt 150 miljoner dollar.
Trots det senaste raset är vi fortsatt positiva till ädelmetaller där vi tror centralbanksstimulanserna är det största drivkraften.

Vi fortsätter att se centralbankernas nytryckta pengar och framförallt Feds QE3 operation som starkt skäl att vara investerad i ädelmetallerna. Konflikterna i Sydafrika fortsätter och ger stöd åt och guldpriset. Vi tror på: ADELMET H
Energi
Fortsatt svaga utsikter för elpriset
Oljepriset (Brent) har haft en fallande trend under veckan, efter positiva under fredag eftermiddag av positiva arbetsmarknadssiffror från USA steg priset 1,7 USD/fat men den uppgången raderades under eftermiddagen. Brent-oljan handlas nu på 107,70 USD/fat vilket är 1,2 % lägre än veckans öppning. Orkanen Sandy som svepte in över USA:s östkust tidigare i veckan har lämnat förstörelse och dödsfall efter sig. Orkanens framfart har även haft betydelse för oljepriset, främst priset på WTI-oljan som till motsats till Brent-oljan stigit under veckan. Mindre lager än väntat på råolja ger även det stöd till oljepriset. Amerikanska lager minskade med 2 miljoner fat mot en förväntad ökning på 1,8 miljoner fat.
Elmarknaden faller tillbaka närmare tre procent under veckan efter att såväl väder, spot, som tysk el verkat för lägre priser i Norden. Kol och utsläppsrätter handlas i stort sett oförändrat över veckan (89.50 dollar respektive 8 euro per ton) så inga större förändringar vad gäller brytpriset. Fokus är därmed återigen på vädret där temperaturen nu återgått till normala nivåer och ser ut att landa strax över normalt mot slutet av perioden. Energibalansen har förbättrats med närmare 2 TWh de senaste två veckorna (se blå graf nedan) och ser vi till prognoserna förväntas uppemot 7 TWh de kommande 10 dagarna vilket kan förbättra energibalansen med ytterligare någon TWh. Det är således svårt att motivera köp under rådande omständigheter, snarare sannolikt att marknaden faller tillbaka ytterligare 50 cent och testar 40 euro nivån för kvartalet Q1 2013 (underliggande för våra sparprodukter på el) om prognosen står fast över helgen. I övrigt noteras en stark tillväxt av vindkraft i kvartalsrapporten från Svensk vindenergi under 2012. 3,977 MW kommer att vara installerat i Sverige vid årsskiftet (ca 3% av Sveriges elanvändning) men pga av låga priser på el och elcertifikat förväntas endast 500 MW utbyggnad under 2013 (ca hälften av 2012 års installationer).

Oljan har sett allt svagare ut och vi fortsätter tycka att underliggande fundamenta är väl balanserad. Vi ser även att förutsättningarna för fortsatt lågt elpris kvarstår. Vi håller en neutral syn på energisektorn.
Livsmedel
Ökad oro för det amerikanska höstvetet
Terminspriser på vete har gått upp något sedan förra veckan i både Chicago och Paris. Det amerikanska höstvetet har längtat efter regn under en lång tid och skicket på grödan bedöms nu vara det värsta på 20 år vid den här tiden på året – vi har flera gånger sett att en dålig gröda lyckats återhämta sig väl efter vintern om vädret tillåter men helt klart har oron nu ökat. Det torra vädret har dock snabbat på sådden något, för vilken nu omkring 10 procent återstår. Något regn från stormen Sandy verkar inte ha nått de viktiga veteregionerna i USA i större utsträckning, vilket det talades mycket om i början av veckan.
Lite regn har fallit i Australien, möjligen kan det ha en positiv effekt på grödan längst ned i söder men generellt sett bedöms det vara för sent för att göra någon nytta. Fortsätter regnandet framöver lär det istället bli en nackdel då skörden i norr redan startat. I EU regnar det fortfarande i ganska stora delar och den del av sådden som kvarstår går sakta framåt, helt säkert kommer detta leda till en mindre höstsådd areal. I regndrabbade Argentina är skörden nu avklarad till omkring 6 procent, vädret har dock förbättrats något de sista dagarna men mer regn väntas under nästa vecka. I Östeuropa är det kallt och vetet börjar nu gå in i vintervila.
Väldigt mycket negativt är inprisat i dagens nivå och vi förväntar oss viss svårighet för priserna att nå så mycket högre. Långsiktigt är det svårt att se varför dagens nära rekordhöga priser ska hålla i sig – även om väldigt mycket kan hända till dess.
 under 2012")
Vi ser soja, majs och vete som klara säljcase där vi väntar oss prisfall före jul men senast till påsk. Vi tror på: LIVSMEDEL S H
Handelsbankens Råvaruindex

Handelsbankens råvaruindex består av de underliggande indexen för respektive råvara. Vikterna är bestämda till hälften från värdet av global produktion och till hälften från likviditeten i terminskontrakten.
[box]SHB Råvarubrevet är producerat av Handelsbanken och publiceras i samarbete och med tillstånd på Råvarumarknaden.se[/box]
Ansvarsbegränsning
Detta material är producerat av Svenska Handelsbanken AB (publ) i fortsättningen kallad Handelsbanken. De som arbetar med innehållet är inte analytiker och materialet är inte oberoende investeringsanalys. Innehållet är uteslutande avsett för kunder i Sverige. Syftet är att ge en allmän information till Handelsbankens kunder och utgör inte ett personligt investeringsråd eller en personlig rekommendation. Informationen ska inte ensamt utgöra underlag för investeringsbeslut. Kunder bör inhämta råd från sina rådgivare och basera sina investeringsbeslut utifrån egen erfarenhet.
Informationen i materialet kan ändras och också avvika från de åsikter som uttrycks i oberoende investeringsanalyser från Handelsbanken. Informationen grundar sig på allmänt tillgänglig information och är hämtad från källor som bedöms som tillförlitliga, men riktigheten kan inte garanteras och informationen kan vara ofullständig eller nedkortad. Ingen del av förslaget får reproduceras eller distribueras till någon annan person utan att Handelsbanken dessförinnan lämnat sitt skriftliga medgivande. Handelsbanken ansvarar inte för att materialet används på ett sätt som strider mot förbudet mot vidarebefordran eller offentliggörs i strid med bankens regler.


Brent M1 moving below the 200 dma of $78.7/b. Brent crude continued its move lower yesterday with a decline of 3.3% to $77.9/b. This morning it is adding another drop of 1.4% to $76.8/b. Israel bombing Lebanon during the weekend was a violence of the MoU and Iran was quick to declare the SoH closed again. But the willingness to move forward by both the US and Iran obviously trumped the bombing in Lebanon making the event more of a hiccup on the road of further negotiations.

The US has now waived sanctions against Iranian oil exports for two months allowing Iran to sell its oil all over the world, though sanctions instated in Europe will take more time to unwind. Oil from Iran, Russia as well as Venezuela can for the time being be sold across the world without any sharp discount due to sanctions. Chinese Tea-pot refineries will suffer as they previously could buy rebated crude while selling products at market prices.
Crude oil is no flowing out of the SoH with latest number close to 7 mb/d on a three day moving average. That is still well below the 14 mb/d of crude and 6 mb/d of products normally flowing out of the SoH. Latest estimate is that there is around 80 mb of crude on water inside the Persian Gulf and maybe another 80 mb of oil products on water as well. If crude is exiting the SoH at a rate of around 7 mb/d, then the 80 mb of crude would be depleted within 10-15 days and there after the flow would rely on new crude tankers entering, loading and then exiting the SoH to continue further flows. Given the uncertainties surrounding the status of the SoH with Iran stating that it was closed again as recent as this weekend, there is likely an asymmetry here where ships and oil stranded in the SoH for months are much more eager to exit than new ships are eager to enter.
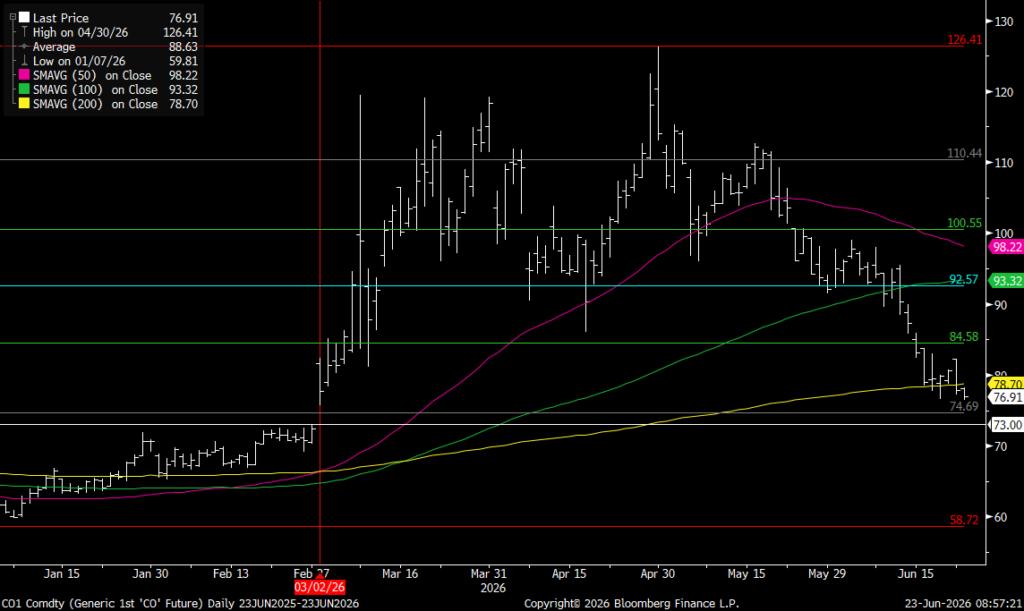
For now Brent crude keeps falling like a rock with the front-end Brent contract now only trading at a premium of $7.6/b above the five year contract. Quickly heading towards parity. The Brent M1 contract has now broken below its 200 dma of $78.7/b and is closing in on the Fibo-level at $74.7/b. Below that there is not much more supporting levels to be found before $73/b which would close the gap from February 3.
Brent crude M1 technical levels
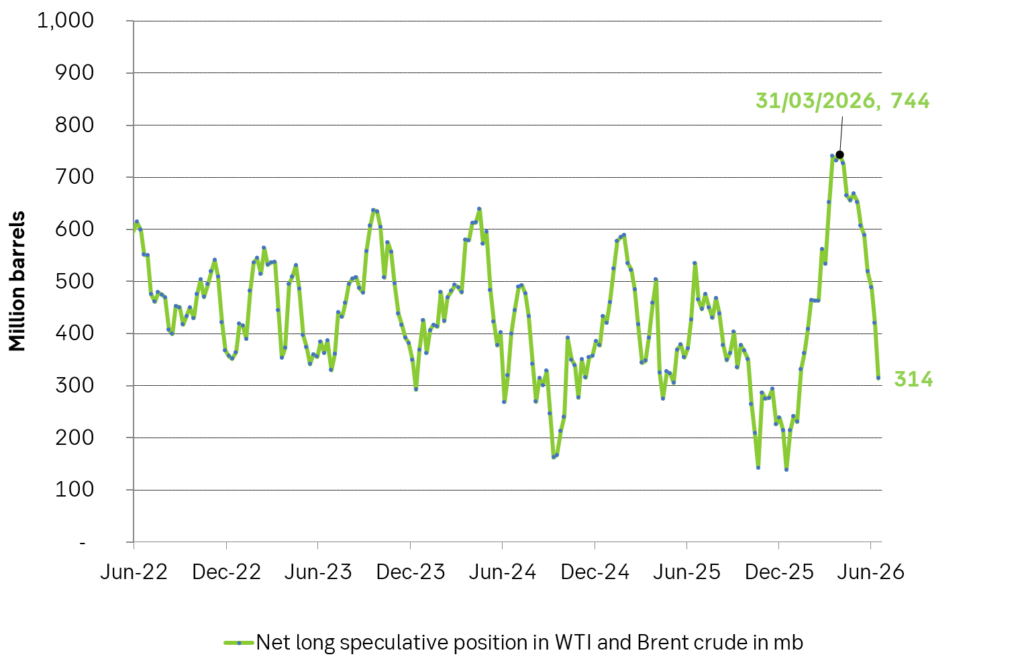
Net long speculative positions are also falling like a rock and as of Tuesday last week the net long positioning in Brent and WTI together summed to 314 million barrels and falling fast.
Will there be a rebound? A possible combination could be an exhaustion of the oil blob caught within the SoH within 1-2 weeks if exits continue at current rate while new ships entering are much more cautious, more Israeli bombardments in Lebanon as Netanyahu fights for re-election, a temporary closure of the SoH again while speculative short positions take cover buying back and covering their positions.
US and Israeli stands versus Iran could harden beyond elections so 2027 surplus is far from given. But Iran and the US are all in all moving towards a set of solutions with both clearly eager to reopen the SoH and keep it open. And that is what the market is pricing along with sharply falling prices. The ongoing discussions will likely take months and last beyond both the upcoming Israeli election (before 27 oct) and the US midterm elections on 3 Nov. Beyond those dates the stance by both Israel and the US may harden again versus Iran. But Iran knows that and is most likely preparing for such a hardening turn. Thus a surplus of oil and global oil stock rebuilding in 2027 (as now is mostly projected) is far from given.
Selling down on a ”deal”. Brent crude fell 6.2% last week with accelerated weakness towards the end of the week. Close of the week at $87.33/b and low of the week (and on Friday) of $85.8/b. Brent is falling another 4% this morning to $83.7/b on confirmation by Iran that a MoU text has been reached and that it will be signed on Friday this week.
So what is this ”deal” worth? Talk on the desk here this morning is that it is much like ”putting lipstick on a pig” where Trump has to sell this at home as a victory where ”the SoH has reopened”, the nuclear issue will be ironed out over the coming 60 days (or maybe 600 days?) and US consumers are getting a lower gasoline price and maybe US republicans survives the midterm elections.
The importance for Iran is that it emerges as the defacto winner of this war in the eyes of the non-US public world. That Iran now onwards is the ”ruler of the SoH” (combo of geography and new weapons systems like drones) or more softer: ”the guarantor of safe passage through the SoH”.
Iran doesn’t need nuclear weapons any more. Nuclear deterrence doesn’t work any more. Ukraine has made many attacks deep into Russia without being nuked in return. Plenty of Iranian ballistic rockets blasts over Israel but Iran wasn’t nuked in return.
There is no trust between the US and Iran. We don’t know all the details yet of the MoU. But what we do know is that there is no trust between the US and Iran what so ever. This is probably more like a descriptive text on how they can cooperate in a way where both sides keeps tactical leverage. Neither side makes irreversible concessions. Violations can be punished quickly. Cooperation produces immediate benefits.
This is a fragile structure. It can easily break down. There may be details which cannot be overcome. To be seen on Friday. The US has to show that it is willing put enough force behind managing and restraining Israel versus Hezbollah in Lebanon. We have seen that Netanyahu hasn’t listened all that much to Trump’s directives and wishes. This could be a major obstacle.
A gradual reopening is tactically preferable for Iran. A tactical leverage for Iran right now is that global oil stocks have been drawn down towards painful and increasingly dangerous levels with increasing risks for oil price spikes in mid-July to August. This together with US midterm elections on 3 November gives tactical leverage to Iran. Iran probably doesn’t want to fully give up on that leverage. A rapid, full reopening where global stocks are able to refill over the coming 60 days will significantly erode that leverage. If Iran reinstates a closure of the SoH after 60 days (if talks break down again), then the effect won’t be that impactful in terms of prices and the US midterm elections.
So a gradual and partial reopening where global markets gets the oil they need while they are unable to rebuild stocks could be a practical middle way for both parties. Trump can sell it as ”the SoH has reopened” and get affordable gasoline for US consumers. Iran can sell it as ”the SoH has fully reopened, but there is some friction” so flow is only 60-80% of normal.
Not much real demand destruction below $100/b. What we do know is that there is not much real price pain demand destruction for oil globally at an oil price below $100/b. A lot of demand-shock destruction. Fear. But demand should now come roaring back towards normal with fear for exceptionally high prices now is rapidly receding.
Sudden China demand destruction due to EVs? Bullocks. EV share of total Chinese carpool now around 13%. Share of new sales of EVs has reached 50%. This is a very gradual process. It doesn’t make oil demand fall like a rock over night. When EV new sales share reaches 100%, then the gasoline car pool will contract by some 5-10% per year. But that is only gasoline. Sudden reduction in Chinese oil demand is more about shock and risk.
Chinese crude oil imports will come roaring back. At what price? Today’s ”neutral” oil price is $70/b. That is the five year price which has steadily traded around the $70/b mark over the past 3-4 years. With still a risky picture one would think that China and the rest of the world will be big buyers of oil in the range of $70-85/b.
Global demand will likely snap back towards normal, forecasted demand and growth at such prices.
Physical reopening is a gradual process. The physical and practical reopening of the SoH will likely be gradual rather than sudden. And that probably suites Iran tactically as well.
Brent M1 price versus the Brent 5-yr (today’s ”normal” price)

Market is starting to take US/Iran headlines with a pinch of salt. Brent crude rose $2.8/b yesterday to an official close of $112.1/b. But after that it traded as low as $108.05/b before ending late night at around $109.7/b. Through the day it traded in a range of $106.87 – 112.72/b amid a flurry of news or rumors from Iran and the US. ”US temporary sanctions during negotiations” (falls alarm). ”We will bomb Iran” (not anyhow),… etc. While the market is still fluctuating to this kind of news flow, it is starting to take such headlines with a pinch of salt.
We’ll see. Maybe, maybe not. The Brent M1 contract is trading at $110.2/b this morning which very close to the average ticks through yesterday of $110.4/b.
Trump with bearish, verbal intervention whenever Brent trades above $110/b it seems. What seems to be a pattern is that Trump states something like ”very good negotiations going on with Iran”, ”New leaders in Iran are great,..”, ”Great progress in negotiations,…”, ”Deal in sight,..” etc whenever the Brent M1 contract trades above $110/b. An effort to cool the market. These hot air verbal interventions from Trump used to have a heavy bearish impact on prices, but they now seems to have less and less effect unless they are backed by reality.
As far as we can see there has been no real progress in the negotiations between the US and Iran with both sides still standing by their previous demands.
Iran is getting stronger while the cease fire lasts making a return to war for Trump yet harder. Iran is naturally in constant preparation for a return to war given Trump’s steady threats of bombing Iran again. Iran is naturally doing what ever is possible to prepare for a return to war. And every day the cease fire lasts it is better prepared. This naturally makes it more and more difficult and dangerous for the US to return to warring activity versus Iran as the consequences for energy infrastructure in the Persian Gulf will be more and more severe the longer the cease fire lasts. Israel seems to see it this way as well. That the war is not won and that current frozen state of a cease fire gives Iran opportunity to rebuild military and politically.
Global inventories are drawing down day by day. How much? In the meantime the Strait of Hormuz stays closed. There is varying measures and estimates of how much global inventories are drawing down. Our rough estimate, back of the envelope, is that global inventories are drawing down by at least some 10 mb/d or about 300 mb/d in a balance between loss of supply versus demand destruction. Other estimates we see are a monthly draw of 250-270 mb/d. The IEA only ’measured’ a draw in global observable stocks of 117 mb in April with oil on water rising 53 mb while on shore stocks fell 170 mb. But global stocks are hard to measure with large invisible, unmeasured stocks. As such a back of the envelope approach may be better.
Oil products is what the world is consuming. Oil product prices likely to rise while product stocks fall. Strategic Petroleum Reserves (SPR) are predominantly crude oil. Discharging oil from OECD SPR stocks, a sharp reduction in Chinese crude imports and a reduction in global refinery throughput of 6-7 mb/d has helped to keep crude oil markets satisfactorily supplied. But global inventories are drawing down none the less. And oil products is really what the world is consuming. So if global refinery throughput stays subdued, then demand will eventually have to match the supply of oil products. The likely path forward this summer is a steady draw down in jet fuel, diesel and gasoline. Higher prices for these. Then, if possible, higher refinery throughput and higher usage of crude in response to very profitable refinery margins. And lastly sharper draw in crude stocks and higher prices for these. But some 6 mb/d of oil products used to be exported through the Strait of Hormuz. And it may not be so easy to ramp up refinery activity across the world to compensate. Especially as Ukraine continues to damage Russian refineries as well as Russian crude production and export facilities.
Watch oil product stocks and prices as well as Brent calendar 2027. What to watch for this summer is thus oil product inventories falling and oil product premiums to crude rising. Another measure to watch is the Brent crude 2027 contract as it rises steadily day by day as the Strait of Hormuz stays closed and global oil inventories decline. The latter is close to the highest level since the start of the war and keeps rising.
The Brent M1 contract and the Brent 2027 prices and current price of jet fuel in Europe (ARA). All in USD/b

Our back of the envelope calculation of the global shortage created by the closure of the Strait of Hormuz. Note that 3.5 mb/d of discharge from SPR is also a draw. Note also that ’Forced demand loss’ of 2.5 mb/d is probably temporary and will fall back towards zero as logistics are sorted out leaving ’Price demand loss’ to do the job of balancing the market. Thus a shortfall of at least 9 mb/d created by the closure. More if SPR discharge is included and more if Forced demand loss recedes.


Brent falling like a rock with oil likely to flow from SoH until at least 3 November

Vattenfalls och Industrikrafts kärnkraftsbolag Videberg Kraft har valt Rolls-Royce SMR
Selling down on a ”deal”

Sommarväder skapar prisrally på elbörsen
Oil product price pain is set to rise as the Strait of Hormuz stays closed into summer
Sommarväder skapar prisrally på elbörsen
Vattenfalls och Industrikrafts kärnkraftsbolag Videberg Kraft har valt Rolls-Royce SMR
Selling down on a ”deal”
Brent falling like a rock with oil likely to flow from SoH until at least 3 November
-
Nyheter3 veckor sedan
Sommarväder skapar prisrally på elbörsen
-
 Nyheter1 vecka sedan
Vattenfalls och Industrikrafts kärnkraftsbolag Videberg Kraft har valt Rolls-Royce SMR
-
Analys1 vecka sedan
Selling down on a ”deal”
-
Analys6 timmar sedan
Brent falling like a rock with oil likely to flow from SoH until at least 3 November