

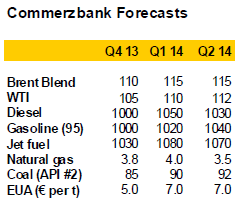
Analys
What is behind the recent fall in US crude oil stocks?
 US crude oil stocks have fallen significantly during the summer months. This was mainly attributable to an increase in crude oil processing. In this way US refineries reacted to robust demand for middle distillates, which is reflected in low US distillate stocks and record US distillate exports. As crude oil processing declines, US crude oil stocks will likely rise again in the fourth quarter. Robust US distillate exports are exerting pressure on refinery margins in Europe, which will probably increase Europe’s dependency on imports of oil products.
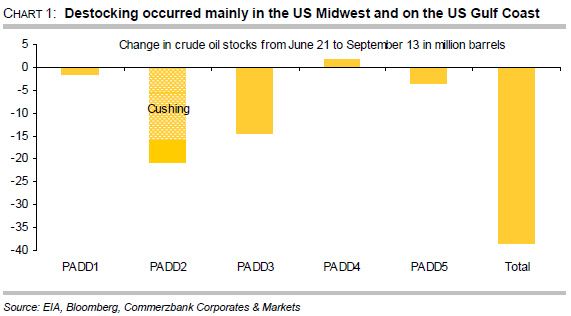
 US crude oil stocks have fallen significantly during the summer months. Since the end of June they have declined by 38m barrels and in mid-September reached their lowest level for 18 months. Destocking has been concentrated on two regions: in the Midwest (PADD 2) stocks have fallen by more than 20m barrels, and on the US Gulf Coast (PADD 3) by more than 14m barrels (chart 1). The lion’s share of the destocking in the Midwest related to the storage hub in Cushing, where stocks have fallen by a total of 16.5m barrels for 13 weeks in succession. What is the reason for this surprising trend and will the destocking continue?
The trend in stock levels can be divided into three sub-components: on the supply side are US oil production and US oil imports, and on the demand side, crude oil processing by refineries. US oil production has increased until recently. In mid-September it reached its highest level since May 1989 of more than 7.4m barrels per day. This component cannot therefore explain the destocking of recent weeks. On the other hand, imports of crude oil have fallen sharply. In the summer months they were, on average, 1m barrels per day lower than in the previous year. However, this will not be sufficient to balance out the simultaneous increase in US oil production. Between the end of June and mid-September this was, on average, 1.4m barrels per day above the previous year’s level. The trend on the supply side would therefore have been an indication of stockbuilding. The main reason for the significant destocking this summer is therefore to be found on the demand side, i.e. from the higher volumes of crude oil processed at refineries.
Crude oil processing in the USA was higher than usual this summer
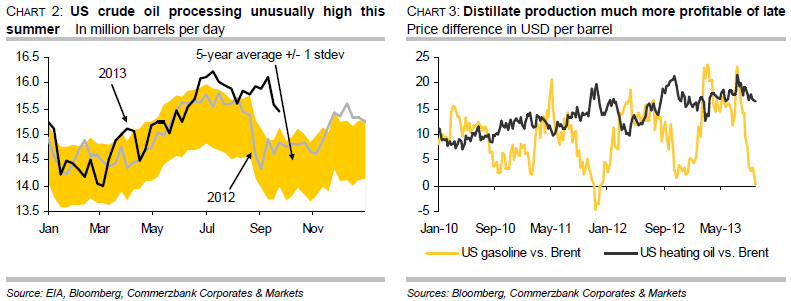
US refineries stepped up crude oil processing much more significantly than usual this summer. Between the end of June and mid-September, an average of 16m barrels of crude oil was processed daily. This was 600,000 barrels per day more than in the corresponding period last year, and 900,000 barrels per day more than the long-term average level (chart 2). At the beginning of July, more crude oil was processed than at any time in the last eight years. It was also striking that refineries maintained processing rates at their high levels of July and August up to mid-September. Normally, refineries scale back their utilisation from the end of August as the summer driving season approaches an end. Refineries usually use the time in early autumn to carry out maintenance and to switch operations to the winter season. Hence, significantly more crude oil has been processed this summer than would otherwise be normal at this time of the year. This has only been possible by consistently dipping into crude oil stocks, although more crude oil has also been available as a result of the increased level of domestic oil production.
This cannot be explained with trends in the US gasoline market…
The fact that US refineries have increased their crude oil processing so strongly over an extended period this summer cannot be explained by trends in the US gasoline market, which is normally the most important driver of refinery activity in the summer months. Demand for gasoline in the US during the summer driving season showed virtually no increase compared to last year. US gasoline stocks have remained consistently 5 to 6 per cent above their long-term average for weeks with a few exceptions. US gasoline production was just slightly higher this summer than in the previous years. Moreover, the US exported less gasoline between March and July than one year ago, according to the EIA.
…but is attributable to distillate production in particular
The reason for the unusually high level of refinery activity over a prolonged period is above all attributable to middle distillates. US refineries have significantly increased the production of middle distillates in particular. This increased to an average of 5m barrels per day in the summer months, which was 13% higher than average for the last five years. More than half of the increase in crude oil processing this summer is therefore attributable to the middle distillates segment. The varying trend in processing margins is likely to have played a part here. While margins for gasoline production have fallen to the lowest level since end of 2011, they are still relatively high for middle distillates (chart 3). The fact that margins for middle distillates have held up much better is attributable to low US distillate stocks, which have remained well below their long-term average levels despite robust production of middle distillates.
Strong demand for distillates in and outside the USA
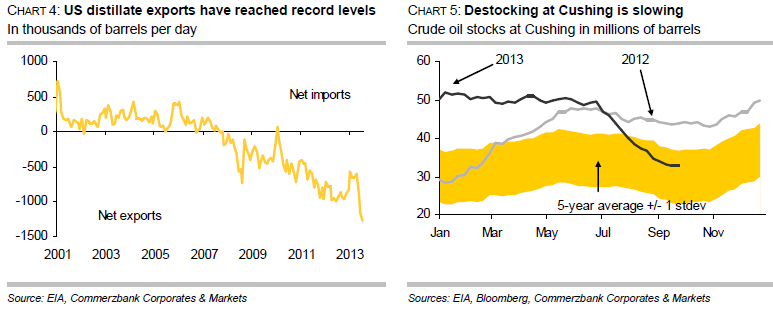
This is mainly the result of higher domestic demand and robust demand for distillates from abroad. Distillate demand from US consumers was 10% higher than last year during the summer months and 6% above the average of the last five years. Moreover, the USA exported 1.276m barrels of middle distillates per day on balance in July after having reached a level nearly as high in June (chart 4, page 3). Daily net distillate exports were almost twice as high in June and July as in the first four months of the year and also 26% above the same period last year. Weekly estimates from the US Energy Information Administration also indicate that distillate exports remained at a similarly high level in August and September.
Refinery activity is unlikely to sustain these exceptionally high levels
US refineries have benefited from cheaper crude oil from the country’s interior until recently, which, thanks to new pipeline capacity, can be transported to the US Gulf Coast, where roughly half of US refinery capacity is situated. This also enables US refineries to avoid the continuing restrictions on crude oil exports from the USA, since these restrictions do not apply to the export of oil products. Despite everything, US refineries are unlikely to maintain their distinctly high levels of crude oil processing of recent months, given lower margins. The EIA expects average crude oil processing of 15.3m barrels per day in the fourth quarter. This would still be more than 500,000 barrels per day above the average of the last five years, but some 600,000 barrels per day less than in the third quarter. The lower demand for crude oil from refineries indicates higher stock levels, if US oil imports are not being reduced markedly, as US oil production is likely to increase further as a result of the surge in shale oil production in North Dakota and Texas. In fact, the decline in US crude oil stocks seems to have come to an end. In the second half of September stocks were already increasing by roughly 8m barrels, due to lower volume of crude oil processing and higher oil imports.
Decline in crude oil stocks has recently also slowed at Cushing
The 13-week long decline in crude oil stocks at Cushing has also weakened visibly in recent weeks (chart 5). Whereas, between the beginning of July and the end of August, on balance an average of 1.36m barrels of crude oil per week were drained off Cushing, in September the figure had fallen to an average of less than 500,000 barrels per week. At the end of September, the decline in stocks at Cushing had almost come to an end. Should stocks be built up also at Cushing in the weeks ahead, this would not be attributable to a lack of transport or processing capacities. These are now sufficient – as the steady fall in Cushing stocks over the summer months despite rising shale oil production in the Midwest demonstrated. In fact, once the Southern leg of the Keystone XL pipeline is completed, additional transport capacities of 700,000 barrels per day will be available by year-end. A stock build-up would instead be attributable to lower crude oil processing at refineries. This should exert pressure on the WTI price in particular.
Record US distillate exports creating problems for refineries in Europe
What are the implications of these trends for Europe? According to data from the EIA, the USA was already exporting record volumes of middle distillates to Europe in May and June. Based on shipping data, this trend has continued in September. The high levels of US distillate exports will exert pressure on refinery margins in Europe. Despite low gasoil stocks, the price differential between gasoil and Brent oil has been moving in a narrow range around USD 15 per barrel for some months, which is hardly sufficient to offset the very low margins in gasoline production. The situation has been compounded by the fact that the USA itself has now become a net gasoline exporter. As a result the US market – formerly the most important sales market for European refineries – has been lost. At the same time, the USA is also competing in gasoline on other sales markets such as South America, for instance. Further refinery closures in Europe are thus on the cards, which would further increase Europe’s dependency on imports of oil products.

Market is starting to take US/Iran headlines with a pinch of salt. Brent crude rose $2.8/b yesterday to an official close of $112.1/b. But after that it traded as low as $108.05/b before ending late night at around $109.7/b. Through the day it traded in a range of $106.87 – 112.72/b amid a flurry of news or rumors from Iran and the US. ”US temporary sanctions during negotiations” (falls alarm). ”We will bomb Iran” (not anyhow),… etc. While the market is still fluctuating to this kind of news flow, it is starting to take such headlines with a pinch of salt.

We’ll see. Maybe, maybe not. The Brent M1 contract is trading at $110.2/b this morning which very close to the average ticks through yesterday of $110.4/b.
Trump with bearish, verbal intervention whenever Brent trades above $110/b it seems. What seems to be a pattern is that Trump states something like ”very good negotiations going on with Iran”, ”New leaders in Iran are great,..”, ”Great progress in negotiations,…”, ”Deal in sight,..” etc whenever the Brent M1 contract trades above $110/b. An effort to cool the market. These hot air verbal interventions from Trump used to have a heavy bearish impact on prices, but they now seems to have less and less effect unless they are backed by reality.
As far as we can see there has been no real progress in the negotiations between the US and Iran with both sides still standing by their previous demands.
Iran is getting stronger while the cease fire lasts making a return to war for Trump yet harder. Iran is naturally in constant preparation for a return to war given Trump’s steady threats of bombing Iran again. Iran is naturally doing what ever is possible to prepare for a return to war. And every day the cease fire lasts it is better prepared. This naturally makes it more and more difficult and dangerous for the US to return to warring activity versus Iran as the consequences for energy infrastructure in the Persian Gulf will be more and more severe the longer the cease fire lasts. Israel seems to see it this way as well. That the war is not won and that current frozen state of a cease fire gives Iran opportunity to rebuild military and politically.
Global inventories are drawing down day by day. How much? In the meantime the Strait of Hormuz stays closed. There is varying measures and estimates of how much global inventories are drawing down. Our rough estimate, back of the envelope, is that global inventories are drawing down by at least some 10 mb/d or about 300 mb/d in a balance between loss of supply versus demand destruction. Other estimates we see are a monthly draw of 250-270 mb/d. The IEA only ’measured’ a draw in global observable stocks of 117 mb in April with oil on water rising 53 mb while on shore stocks fell 170 mb. But global stocks are hard to measure with large invisible, unmeasured stocks. As such a back of the envelope approach may be better.
Oil products is what the world is consuming. Oil product prices likely to rise while product stocks fall. Strategic Petroleum Reserves (SPR) are predominantly crude oil. Discharging oil from OECD SPR stocks, a sharp reduction in Chinese crude imports and a reduction in global refinery throughput of 6-7 mb/d has helped to keep crude oil markets satisfactorily supplied. But global inventories are drawing down none the less. And oil products is really what the world is consuming. So if global refinery throughput stays subdued, then demand will eventually have to match the supply of oil products. The likely path forward this summer is a steady draw down in jet fuel, diesel and gasoline. Higher prices for these. Then, if possible, higher refinery throughput and higher usage of crude in response to very profitable refinery margins. And lastly sharper draw in crude stocks and higher prices for these. But some 6 mb/d of oil products used to be exported through the Strait of Hormuz. And it may not be so easy to ramp up refinery activity across the world to compensate. Especially as Ukraine continues to damage Russian refineries as well as Russian crude production and export facilities.
Watch oil product stocks and prices as well as Brent calendar 2027. What to watch for this summer is thus oil product inventories falling and oil product premiums to crude rising. Another measure to watch is the Brent crude 2027 contract as it rises steadily day by day as the Strait of Hormuz stays closed and global oil inventories decline. The latter is close to the highest level since the start of the war and keeps rising.
The Brent M1 contract and the Brent 2027 prices and current price of jet fuel in Europe (ARA). All in USD/b

Our back of the envelope calculation of the global shortage created by the closure of the Strait of Hormuz. Note that 3.5 mb/d of discharge from SPR is also a draw. Note also that ’Forced demand loss’ of 2.5 mb/d is probably temporary and will fall back towards zero as logistics are sorted out leaving ’Price demand loss’ to do the job of balancing the market. Thus a shortfall of at least 9 mb/d created by the closure. More if SPR discharge is included and more if Forced demand loss recedes.

Brent is climbing higher. Front-month is at USD 106.3/bl this morning, close to a weekly high and a USD 9/bl jump from Mondays open. This is the move we flagged as a risk earlier in the week: the market shifting from ”a deal is around the corner” to ”this is going to take longer than we thought”.

Analyst Commodities, SEB
During April, rest-of-year Brent remained remarkably stable around USD 90/bl. A stability which rested on one single assumption: the SoH reopens around 1 May. That assumption is now slowly falling apart.
As we highlighted yesterday: every week of delay beyond 1 May adds (theoretically) ish USD 5/bl to the rest-of-year average, as global inventories draw 100 million barrels per week. i.e., a mid-May reopening implies rest-of-year Brent closer to USD 100/bl, and anything pushing into June or July takes us meaningfully higher.
What’s changed in the last 48 hours:
#1: The US military has formally warned that clearing suspected sea mines from SoH could take up to six months. That is a completely different timescale from what the financial market is pricing. Even a political deal tomorrow does not immediately reopen the strait.
#2: Trump has shifted his tone from urgency to ”strategic patience”. In yesterday’s press conference: ”Don’t rush me… I want a great deal.” The market is reading this as a president no longer feeling pressured by timelines, with the naval blockade running in the background.
#3: So far, the military activity is escalating, not de-escalating. Axios reports Iran is laying more mines in SoH. The US 3rd carrier strike group (USS George H.W. Bush) is arriving with two countermine vessels. Trump yesterday ordered the US Navy to destroy any Iranian boats caught laying mines. While CNN reports that the Pentagon is actively drawing up plans to strike Iranian SoH capabilities and individual Iranian military leaders if the ceasefire collapses. i.e., NOT a attitude consistent with an imminent deal!
Spot crude and product prices eased off the early-April highs on a combination of system rerouting and deal optimism. Both now weakening. Goldman estimates April Gulf output is reduced by 14.5 mbl/d, or 57% of pre-war supply, a number that keeps getting worse the longer this drags on.
Demand-side adaptation is ongoing: S. Korea has cut its Middle East crude dependence from 69% to 56% by pulling more from the Americas and Africa, and Japan is kicking off a second round of SPR releases from 1 May. But SPRs are finite.
Ref. to the negotiations, we should not bet on speed. The current Iranian leadership is dominated by genuine hardliners willing to absorb economic pain and run the clock to extract concessions. That is not a setup for a rapid resolution. US/Israeli media briefings keep framing the delay as ”internal Iranian divisions”, the reality is more complicated and points toward weeks and months, not days.
Our point is that the complexity is large, and higher prices have only just started (given a scenario where the negotiations drag out in time). The market spent April leaning on the USD 90/bl rest-of-year assumption; that case is diminishing by the hour. If ”early May reopening” is replaced by ”June, July or later” over the next week or two, both crude and products have meaningful room to reprice higher from here. There is a high risk being short energy and betting on any immediate political resolution(!).
Down on Friday. Up on Monday. The Brent June crude oil contract traded down 5.1% last week to a close of $90.38/b. It reached a high of $103.87/b last Monday and a low of $86.09/b on Friday as Iran announced that the Strait of Hormuz was fully open for transit. That quickly changed over the weekend as the US upheld its blockade of Iranian oil exports while Iran naturally responded by closing the SoH again. The US blew a hole in the engine room of the Iranian ship TOUSKA and took custody of the ship on Sunday. Brent crude is up 5.6% this morning to $95.4/b.
The cease-fire is expiring tomorrow. The US has said it will send a delegation for a second round of negotiations in Islamabad in Pakistan. But Iran has for now rejected a second round of talks as it views US demands as unrealistic and excessive while the US is also blocking the Strait of Hormuz.
While Brent is up 5% this morning, the financial market is still very optimistic that progress will be made. That talks will continue and that the SoH will fully open by the start of May which is consistent with a rest-of-year average Brent crude oil price of around $90/b with the market now trading that balance at around $88/b.
Financial optimism vs. physical deterioration. We have a divergence where the financial market is trading negotiations, improvements and resolution while at the same time the physical market is deteriorating day by day. Physical oil flows remain constrained by disrupted flows, longer voyage times and elevated freight and insurance costs.
Financial markets are betting that a US/Iranian resolution will save us in time from violent shortages down the road. But every day that the SoH remains closed is bringing us closer to a potentially very painful point of shortages and much higher prices.
The US blockade is also a weapon of leverage against its European and Asian allies. When Iran closed the SoH it held the world economy as a hostage against the US. The US blockade of the SoH is of course blocking Iranian oil exports. But it is also an action of disruption directed towards Europe and Asia. The US has called for the rest of the world to engaged in the war with Iran: ”If you want oil from the Persian Gulf, then go and get it”. A risk is that the US plays brinkmanship with the global oil market directed towards its European and Asian allies and maybe even towards China to force them to engage and take part. Maybe unthinkable. But unthinkable has become the norm with Trump in the White House.


Sommarväder skapar prisrally på elbörsen
Oil product price pain is set to rise as the Strait of Hormuz stays closed into summer

Solkraften pressar elpriserna dagtid

Michel Gubel ger sin syn på oljemarknaden