

Analys
SHB Råvarubrevet 8 februari 2013

 Råvaror allmänt
Visst bottnar det!
Risktillgångar har sett fortsatt stigande priser under de senaste veckorna. Bilden av en global ekonomi som bottnat och drivs uppåt av tillväxtekonomiernas importbehov börjar klarna och sprida sig. Exportdata från Kina bekräftar industrivändning där januariexporten kom in bättre än väntat på 25 % y-o-y (väntat 17,5%), vilket var upp 14 % från december. Även importen steg, upp hela 28,8 % y-o-y (väntat 23,5%), och nettobalansen var sammantaget högre än väntat. Även positiv jobbdata från USA stärker sentimentet under veckan. De uppskjutna budgetåtstramningarna i USA börjar dock åter komma nära marknadens näsa och riskerna för sentimentet kring USA i närtid har ökat.
Råvarorna har handlats sidledes efter förra veckans häftiga uppgångar. Det torra vädret i USA fortsätter och även om vår syn på soja, majs och vete fortfarande är att normalt väder ska få priserna att falla så väljer vi att ändra vår syn på livsmedelssektorn till neutral i det korta perspektivet på grund av riskerna för högre priser om regn uteblir i februari.
Basmetaller
Fokus på Kinas metallhandlare
Basmetaller hade en blandad utveckling under veckan där handeln successivt skruvades ner inför kinesernas nyårsfirande på söndag och påföljande lediga vecka. Metallerna steg någon procent i slutet av veckan efter positiv kinesisk handelsdata. Mycket förväntningar och fokus ligger nu på hur kinesiska metallhandlare kommer att agera när de kommer tillbaka efter nyårsledigheten.
Om kinesiska köpintressen tar vid kommer rallyt i basmetaller att fortsätta en bra bit till under februari. Om kineserna inte är intresserade att köpa på dessa nivåer lär det bli motigt för basmetallerna. Vi tror på fortsatt styrka i kinesiska konjunkturen och att högre priser kommer nås under slutet av februari. Rykten i marknaden säger att stora mängder köpoptioner på koppar med lösenpris 9000 USD i september har köpts av en stor aktör. Det tyder på att det är fler som är positiva till utvecklingen i Kina under 2013.
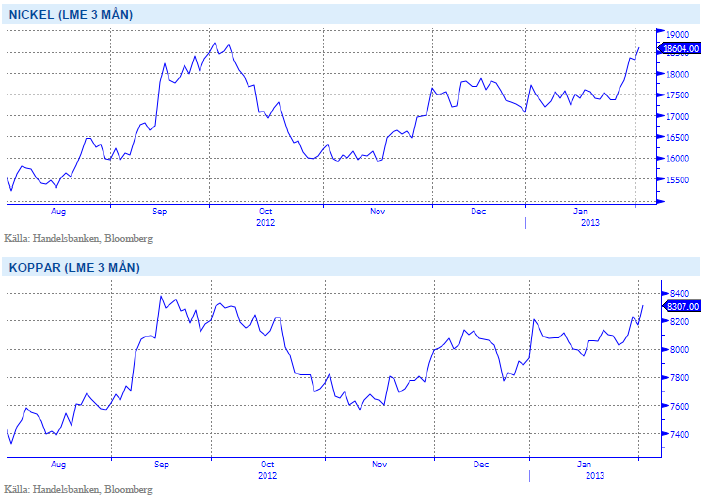
Den globala tillväxten har fått ny kraft och gynnar konjunkturkänsliga råvaror som basmetaller. Vi tror på: BASMET H
Ädelmetaller
Draghi fick guldet på fall
Resultatet efter veckans handel på ädelmetallerna är blandat där silver och palladium har tappat någon procent och där guld och platinum stärkts något. Mario Draghi´s tal om nedsidesrisker fick EUR/USD på fall efter presskonferensen på torsdagen (efter oförändrat räntebesked). En stärkt dollar fick samtidigt guld och silver att falla kraftigt men kunde återhämta sig redan under eftermiddagen.
Fortsatt ljusning i konjunkturen efter positiv data från USA och Kina stärker vår tro att nästa stora rörelse för guldet finns på nedsidan. Att FED´s ärkeduva Charles Evan igår sade att QE3 kan avslutas innan arbetslöshetsnivån når 7 % (vilket den kan göra till hösten) talar även för lägre guldpris.
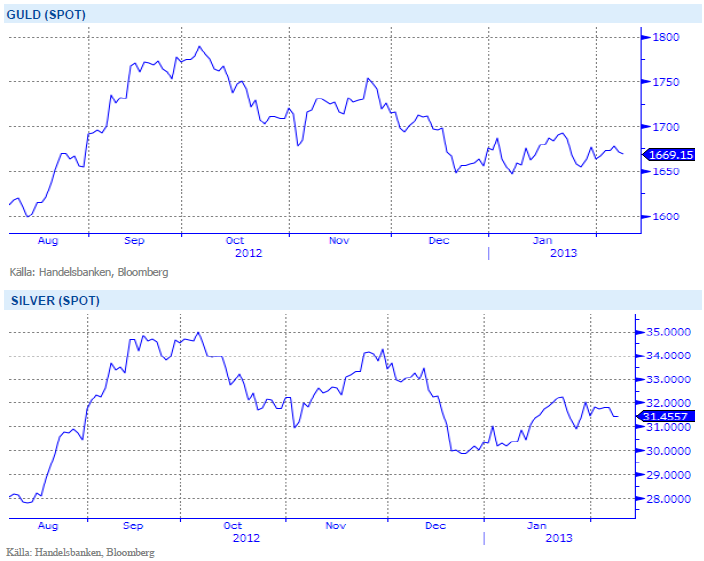
Med fortsatt positivt risksentiment och potentiellt stigande räntenivåer ser vi nästa stora rörelse kommer att vara nedåt. Vi tror på GULD S H
Energi
Fortsatt osäkert för utsläppsrätterna
Fram till fredag var det en ganska händelselös vecka för elpriset som till stort har handlats efter rörelser på utsläppsrätter. Under veckans sista dag fick dock både elen fart och steg dryga 1,6 %, med stöd från högre pris på både olja och utsläppsrätter. Angela Merkels uttalande förra fredagen fick priset på utsläppsrätter att skena mot slutet av förra veckan. Sedan dess har priset rört sig i intervallet EUR 4.10-4.75, nu kvar på 4,50 EUR/ton. Den 19 februari väntas ytterligare en omröstning om back-loadingplanen. Utan plan riskerar marknaden stort överskott av rätter och total kollaps. Om planen förvekligas kan vi få se priser åter på EUR 10-20nivån. Väderprognoserna visar på torrt och kallt väder längre fram vilket ger stöd medan kol och gas har försvagats något under veckan. Vi behåller vår neutrala syn för elpriset.
Oljan har stigit i slutet mot veckan och handlas nu over 118 (!) USD/fat. Torsdagens uttalande från Aya-tolla Ali Khemenei, Iran högsta ledare, att han vägrar föra samtal med USA om landets kärnenergiprogram så länge de ”riktar en pistol mot Iran” fick oljepriset att stiga och risken ökar för fortsatta exportsanktioner mot Iran. Marknaden har prisat in en riskpremie på USD 10-15 för ytterligare utbudstörningar. Vi tror att oljan kan stiga ytterligare trots höga nivåer och vi behåller vår positiva vy för energisektorn.
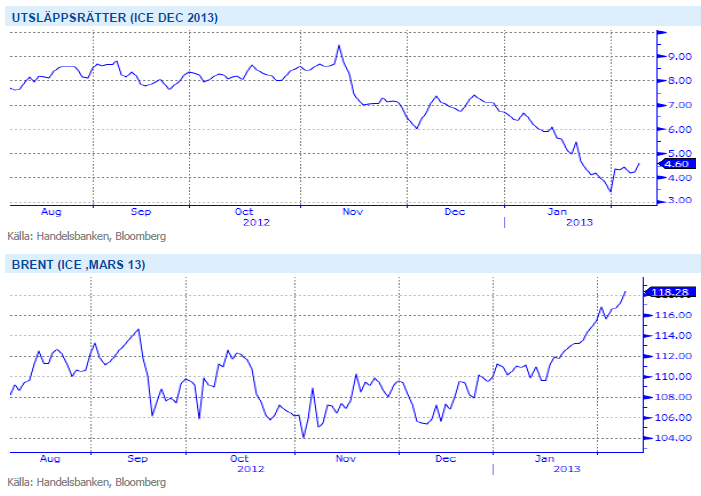
Den råvarugrupp som är mest beroende av den globala konjunkturen är Energi och med en starkare konjunktur ser vi positivt på utvecklingen för denna sektor. Vi tror på ENERGI H
Livsmedel
Socker väntas stiga
Idag handlas socker på nivåer kring18 cent/Ibs och närmar sig därmed produktionskostnaden, vilket satt hårt press på producenterna. Det senaste året har sockerpriset fallit 25 procent, delvis som följd av produktionsöverskott i Brasilien, världens största producent av socker. Även i år har det rapporterats om höga skördar i Brasilien trots den sega starten i november. Det torrare vädret har däremot fått produktionen att falla från rekordnivåer i Thailand, världens största exportör. Andra incitament som ger stöd till sockerpriset är efterfrågan på etanol som väntas stiga efter en prishöjning på bensin i Sydamerika.
Regn på det amerikanska höstvetet har pressat vete-priset något under veckan. Regnet är dock begränsat och skicket på grödan är fortfarande riktigt dåligt, men om vi får ett gynnsamt vårväder kan höstvetet återhämta sig väl. I andra veteregioner i världen råder inga större problem vilket ger viss press nedåt på priserna. Än finns det dessutom tid för regn att falla inför sådd av majs i USA – vilket spannmålsmarkna-den lägger stort fokus på för tillfället. Vetet handlas nu på de lägsta nivåerna sedan mitten av juli månad 2012, givet inga större väderproblem (vilket vi dock blivit ganska vana vid) bör vi kunna vänta oss fortsatt lägre priser lite längre fram på året. Under fredagskvällen väntas lagerrapport från Amerikanska jord-bruksdepartementet där bland annat lagret för majs globalt väntas justeras ned samtidigt som lager i USA väntas justeras upp något.
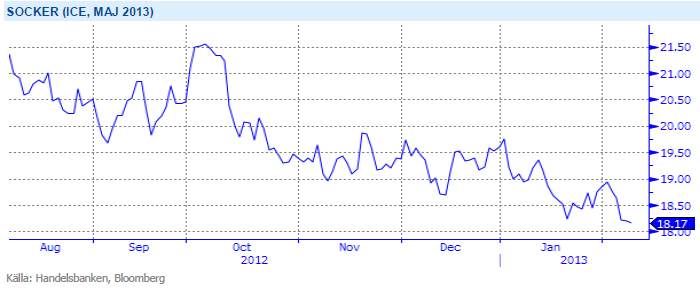
Sockerpris på nivåer som närmar sig produktionskostnaden, produktions fall i Thailand och ökad efterfrågan på etanol får oss att tro på BULL SOCKER H
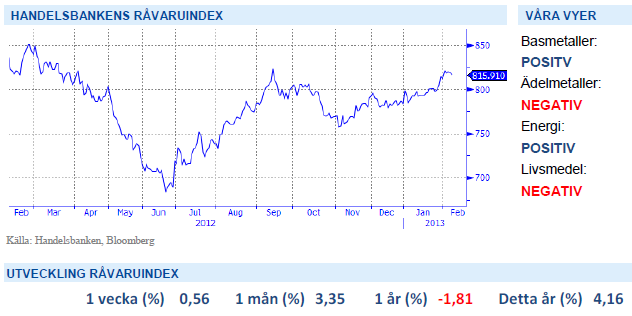
Handelsbankens Råvaruindex
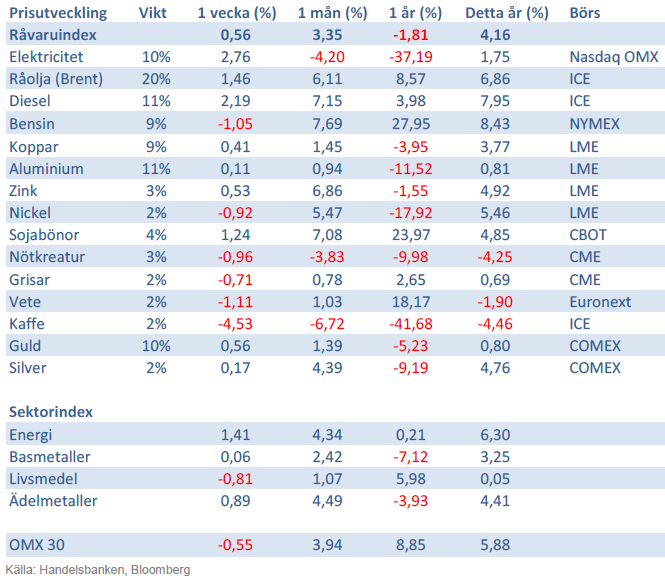
Handelsbankens råvaruindex består av de underliggande indexen för respektive råvara. Vikterna är bestämda till hälften från värdet av global produktion och till hälften från likviditeten i terminskontrakten.
[box]SHB Råvarubrevet är producerat av Handelsbanken och publiceras i samarbete och med tillstånd på Råvarumarknaden.se[/box]
Ansvarsbegränsning
Detta material är producerat av Svenska Handelsbanken AB (publ) i fortsättningen kallad Handelsbanken. De som arbetar med innehållet är inte analytiker och materialet är inte oberoende investeringsanalys. Innehållet är uteslutande avsett för kunder i Sverige. Syftet är att ge en allmän information till Handelsbankens kunder och utgör inte ett personligt investeringsråd eller en personlig rekommendation. Informationen ska inte ensamt utgöra underlag för investeringsbeslut. Kunder bör inhämta råd från sina rådgivare och basera sina investeringsbeslut utifrån egen erfarenhet.
Informationen i materialet kan ändras och också avvika från de åsikter som uttrycks i oberoende investeringsanalyser från Handelsbanken. Informationen grundar sig på allmänt tillgänglig information och är hämtad från källor som bedöms som tillförlitliga, men riktigheten kan inte garanteras och informationen kan vara ofullständig eller nedkortad. Ingen del av förslaget får reproduceras eller distribueras till någon annan person utan att Handelsbanken dessförinnan lämnat sitt skriftliga medgivande. Handelsbanken ansvarar inte för att materialet används på ett sätt som strider mot förbudet mot vidarebefordran eller offentliggörs i strid med bankens regler.


Market is starting to take US/Iran headlines with a pinch of salt. Brent crude rose $2.8/b yesterday to an official close of $112.1/b. But after that it traded as low as $108.05/b before ending late night at around $109.7/b. Through the day it traded in a range of $106.87 – 112.72/b amid a flurry of news or rumors from Iran and the US. ”US temporary sanctions during negotiations” (falls alarm). ”We will bomb Iran” (not anyhow),… etc. While the market is still fluctuating to this kind of news flow, it is starting to take such headlines with a pinch of salt.

We’ll see. Maybe, maybe not. The Brent M1 contract is trading at $110.2/b this morning which very close to the average ticks through yesterday of $110.4/b.
Trump with bearish, verbal intervention whenever Brent trades above $110/b it seems. What seems to be a pattern is that Trump states something like ”very good negotiations going on with Iran”, ”New leaders in Iran are great,..”, ”Great progress in negotiations,…”, ”Deal in sight,..” etc whenever the Brent M1 contract trades above $110/b. An effort to cool the market. These hot air verbal interventions from Trump used to have a heavy bearish impact on prices, but they now seems to have less and less effect unless they are backed by reality.
As far as we can see there has been no real progress in the negotiations between the US and Iran with both sides still standing by their previous demands.
Iran is getting stronger while the cease fire lasts making a return to war for Trump yet harder. Iran is naturally in constant preparation for a return to war given Trump’s steady threats of bombing Iran again. Iran is naturally doing what ever is possible to prepare for a return to war. And every day the cease fire lasts it is better prepared. This naturally makes it more and more difficult and dangerous for the US to return to warring activity versus Iran as the consequences for energy infrastructure in the Persian Gulf will be more and more severe the longer the cease fire lasts. Israel seems to see it this way as well. That the war is not won and that current frozen state of a cease fire gives Iran opportunity to rebuild military and politically.
Global inventories are drawing down day by day. How much? In the meantime the Strait of Hormuz stays closed. There is varying measures and estimates of how much global inventories are drawing down. Our rough estimate, back of the envelope, is that global inventories are drawing down by at least some 10 mb/d or about 300 mb/d in a balance between loss of supply versus demand destruction. Other estimates we see are a monthly draw of 250-270 mb/d. The IEA only ’measured’ a draw in global observable stocks of 117 mb in April with oil on water rising 53 mb while on shore stocks fell 170 mb. But global stocks are hard to measure with large invisible, unmeasured stocks. As such a back of the envelope approach may be better.
Oil products is what the world is consuming. Oil product prices likely to rise while product stocks fall. Strategic Petroleum Reserves (SPR) are predominantly crude oil. Discharging oil from OECD SPR stocks, a sharp reduction in Chinese crude imports and a reduction in global refinery throughput of 6-7 mb/d has helped to keep crude oil markets satisfactorily supplied. But global inventories are drawing down none the less. And oil products is really what the world is consuming. So if global refinery throughput stays subdued, then demand will eventually have to match the supply of oil products. The likely path forward this summer is a steady draw down in jet fuel, diesel and gasoline. Higher prices for these. Then, if possible, higher refinery throughput and higher usage of crude in response to very profitable refinery margins. And lastly sharper draw in crude stocks and higher prices for these. But some 6 mb/d of oil products used to be exported through the Strait of Hormuz. And it may not be so easy to ramp up refinery activity across the world to compensate. Especially as Ukraine continues to damage Russian refineries as well as Russian crude production and export facilities.
Watch oil product stocks and prices as well as Brent calendar 2027. What to watch for this summer is thus oil product inventories falling and oil product premiums to crude rising. Another measure to watch is the Brent crude 2027 contract as it rises steadily day by day as the Strait of Hormuz stays closed and global oil inventories decline. The latter is close to the highest level since the start of the war and keeps rising.
The Brent M1 contract and the Brent 2027 prices and current price of jet fuel in Europe (ARA). All in USD/b

Our back of the envelope calculation of the global shortage created by the closure of the Strait of Hormuz. Note that 3.5 mb/d of discharge from SPR is also a draw. Note also that ’Forced demand loss’ of 2.5 mb/d is probably temporary and will fall back towards zero as logistics are sorted out leaving ’Price demand loss’ to do the job of balancing the market. Thus a shortfall of at least 9 mb/d created by the closure. More if SPR discharge is included and more if Forced demand loss recedes.

Brent is climbing higher. Front-month is at USD 106.3/bl this morning, close to a weekly high and a USD 9/bl jump from Mondays open. This is the move we flagged as a risk earlier in the week: the market shifting from ”a deal is around the corner” to ”this is going to take longer than we thought”.

Analyst Commodities, SEB
During April, rest-of-year Brent remained remarkably stable around USD 90/bl. A stability which rested on one single assumption: the SoH reopens around 1 May. That assumption is now slowly falling apart.
As we highlighted yesterday: every week of delay beyond 1 May adds (theoretically) ish USD 5/bl to the rest-of-year average, as global inventories draw 100 million barrels per week. i.e., a mid-May reopening implies rest-of-year Brent closer to USD 100/bl, and anything pushing into June or July takes us meaningfully higher.
What’s changed in the last 48 hours:
#1: The US military has formally warned that clearing suspected sea mines from SoH could take up to six months. That is a completely different timescale from what the financial market is pricing. Even a political deal tomorrow does not immediately reopen the strait.
#2: Trump has shifted his tone from urgency to ”strategic patience”. In yesterday’s press conference: ”Don’t rush me… I want a great deal.” The market is reading this as a president no longer feeling pressured by timelines, with the naval blockade running in the background.
#3: So far, the military activity is escalating, not de-escalating. Axios reports Iran is laying more mines in SoH. The US 3rd carrier strike group (USS George H.W. Bush) is arriving with two countermine vessels. Trump yesterday ordered the US Navy to destroy any Iranian boats caught laying mines. While CNN reports that the Pentagon is actively drawing up plans to strike Iranian SoH capabilities and individual Iranian military leaders if the ceasefire collapses. i.e., NOT a attitude consistent with an imminent deal!
Spot crude and product prices eased off the early-April highs on a combination of system rerouting and deal optimism. Both now weakening. Goldman estimates April Gulf output is reduced by 14.5 mbl/d, or 57% of pre-war supply, a number that keeps getting worse the longer this drags on.
Demand-side adaptation is ongoing: S. Korea has cut its Middle East crude dependence from 69% to 56% by pulling more from the Americas and Africa, and Japan is kicking off a second round of SPR releases from 1 May. But SPRs are finite.
Ref. to the negotiations, we should not bet on speed. The current Iranian leadership is dominated by genuine hardliners willing to absorb economic pain and run the clock to extract concessions. That is not a setup for a rapid resolution. US/Israeli media briefings keep framing the delay as ”internal Iranian divisions”, the reality is more complicated and points toward weeks and months, not days.
Our point is that the complexity is large, and higher prices have only just started (given a scenario where the negotiations drag out in time). The market spent April leaning on the USD 90/bl rest-of-year assumption; that case is diminishing by the hour. If ”early May reopening” is replaced by ”June, July or later” over the next week or two, both crude and products have meaningful room to reprice higher from here. There is a high risk being short energy and betting on any immediate political resolution(!).
Down on Friday. Up on Monday. The Brent June crude oil contract traded down 5.1% last week to a close of $90.38/b. It reached a high of $103.87/b last Monday and a low of $86.09/b on Friday as Iran announced that the Strait of Hormuz was fully open for transit. That quickly changed over the weekend as the US upheld its blockade of Iranian oil exports while Iran naturally responded by closing the SoH again. The US blew a hole in the engine room of the Iranian ship TOUSKA and took custody of the ship on Sunday. Brent crude is up 5.6% this morning to $95.4/b.
The cease-fire is expiring tomorrow. The US has said it will send a delegation for a second round of negotiations in Islamabad in Pakistan. But Iran has for now rejected a second round of talks as it views US demands as unrealistic and excessive while the US is also blocking the Strait of Hormuz.
While Brent is up 5% this morning, the financial market is still very optimistic that progress will be made. That talks will continue and that the SoH will fully open by the start of May which is consistent with a rest-of-year average Brent crude oil price of around $90/b with the market now trading that balance at around $88/b.
Financial optimism vs. physical deterioration. We have a divergence where the financial market is trading negotiations, improvements and resolution while at the same time the physical market is deteriorating day by day. Physical oil flows remain constrained by disrupted flows, longer voyage times and elevated freight and insurance costs.
Financial markets are betting that a US/Iranian resolution will save us in time from violent shortages down the road. But every day that the SoH remains closed is bringing us closer to a potentially very painful point of shortages and much higher prices.
The US blockade is also a weapon of leverage against its European and Asian allies. When Iran closed the SoH it held the world economy as a hostage against the US. The US blockade of the SoH is of course blocking Iranian oil exports. But it is also an action of disruption directed towards Europe and Asia. The US has called for the rest of the world to engaged in the war with Iran: ”If you want oil from the Persian Gulf, then go and get it”. A risk is that the US plays brinkmanship with the global oil market directed towards its European and Asian allies and maybe even towards China to force them to engage and take part. Maybe unthinkable. But unthinkable has become the norm with Trump in the White House.


Sommarväder skapar prisrally på elbörsen
Oil product price pain is set to rise as the Strait of Hormuz stays closed into summer

Solkraften pressar elpriserna dagtid

Michel Gubel ger sin syn på oljemarknaden