

Analys
SHB Råvarubrevet 5 september 2014

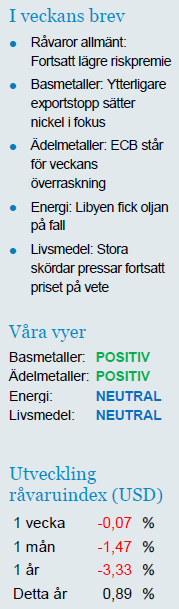 Råvaror allmänt: Fortsatt lägre riskpremie
Under veckan har presidenterna Porosjenko och Putin avtalat vapenvila. Förra veckan kom Israel och Hamas överens om ny vapenvila efter att Egypten medlat. Sammantaget har riskpremien kommit ner och bland råvaror har olja handlats upp med hopp om en starkare konjunktur utan handelssanktioner kring Ryssland på beskedet.
Makromässigt är Europa största orosmolnet just nu, även förut så starka Tyskland börjar visa svagare makrosiffror. ECB:s Draghi är redo att göra mer, men uppmanar också politiker att agera. Bland annat vill Draghi se sänkta skatter och ökade offentliga investeringar. Konjunkturtermometern visar just nu rimfrost i Europa, ljummet i Kina och bikramyogatemperatur i USA. I det klimatet trivs aluminium med sin stora USA exponering bra. Just basmetaller har utvecklats starkt senaste veckorna med stöd i USA makrodata.
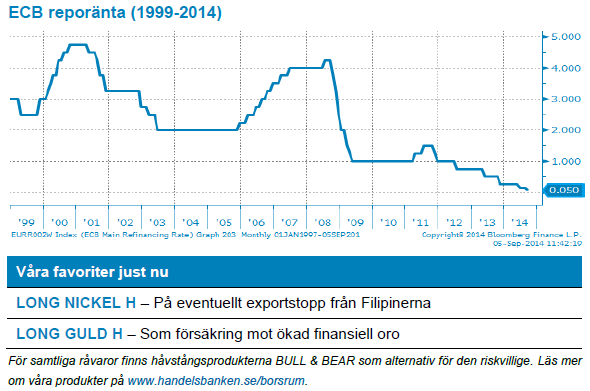
Förväntningarna var högt ställda inför ECB:s möte under torsdagen. Draghi lyckades dock än en gång att överraska marknaderna positivt. Räntan sänktes och man kommer även köpa säkerställda obligationer. Fallande inflationsförväntningar, svag statistik och geopolitik oroar uppenbarligen ECB. Man öppnar också för QE-spåret. Om ECB går hela vägen som man gjort i USA återstå att se men beskedet är positivt för guld och minskar våra föraningar om att guld ska tappa när vi närmar oss Fed-räntehöjningar.
Basmetaller: Ytterligare exportstopp sätter nickel i fokus
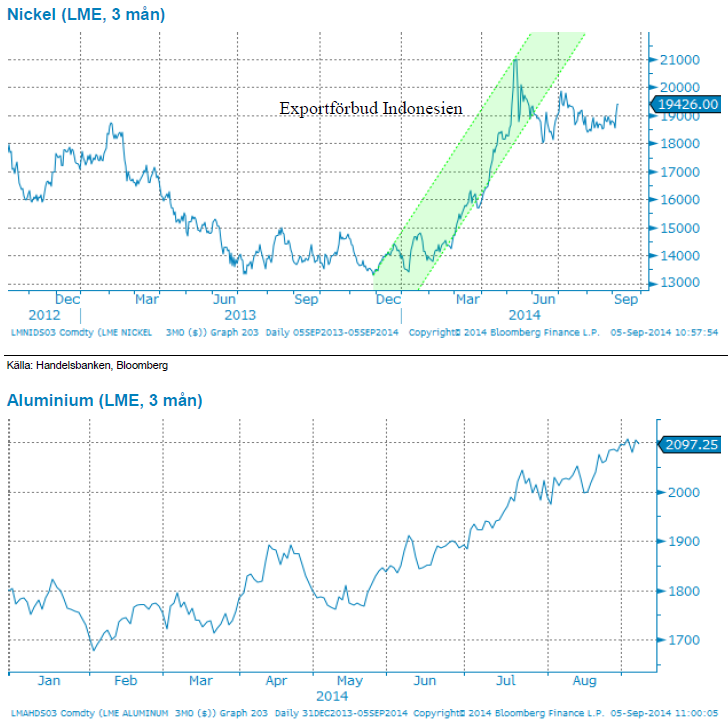
Tidigare i veckan skickade vi ut ytterligare ett trading case på nickel, denna gång på oro för att Filipinerna vill efterlikna Indonesien och införa exportstopp på oförädlad malm. Men timingen är viktigt och hur stor påverkan ett eventuellt exportförbud påverkar prisbilden beror på hur snabbt beslut och genomförande tar. Läs mer i vårt trading case här.
Basmetallerna i övrigt har haft en stark utveckling under sommaren och ser ut att kunna fortsätta. Främst pådrivna av den starka amerikanska konjunkturdatan. USA trenden ser robust ut och kompenserar för den stiltje som nu råder i Kina efter vårens katastrofala makrodata där. Aluminium fortsätter sin starka trend, drivet av stark efterfråga i USA och vårens nedstängningar av då olönsam produktion. Priset kan säkerligen gå högre före vi tror att nedstängdas smältverk dras igång igen och mättar efterfrågeuppgången. Med undantaget för koppar ser vi fortsatt positivt på basmetallerna.
Ädelmetaller: ECB står för veckans överraskning
Gårdagens ovanligt resoluta besked från Europeiska Centralbanken, ECB, kvalar in som veckans nyhet i finansmarknaden. Vi har ju sedan en tid en positiv syn på ädelmetaller, framför allt guld, med reservationen att hålla koll på om Federal Reserve börjar höja räntan.
Gårdagens besked från ECB, i kombination med att amerikanska räntor inte stigit nämnvärt under sommaren, gör att vi blir mer övertygade i vår positiva syn på ädelmetallsektorn. Fortsatt nedpressade räntenivåer, medvetet orkestrerade av en ganska enig centralbankskår, tvingar investerare in i mer riskfyllda tillgångsslag. I denna jakt på avkastning finns det naturligt nog många som blir tveksamma till vad konsekvensen blir för värderingar av finansiella tillgångar, och till vad som händer med dessa värderingar när centralbankerna börjar ta tillbaks sina extrema stimulanser.
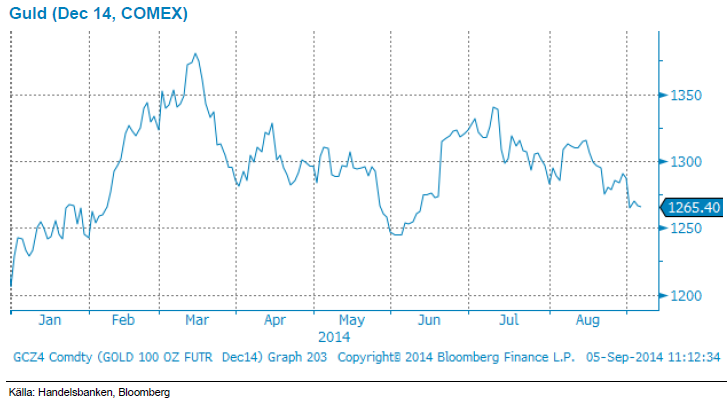
Vårt resonemang runt guldet har byggt – och bygger alltjämt – på balansen mellan guldets ”säker hamn-status” och alternativkostnaden för innehav i guld (vilket ju inte ger någon ränta). Höjd ränta borde – allt annat lika – leda till press nedåt på guldet, medan finansiell oro – som skulle kunna skapas av höjd ränta – brukar leda till köp av guld. Hittills i år har denna balans varit ganska jämn, vilket gjort att guldet visat upp osedvanligt små prisrörelser. ECB:s besked igår ska ses som att denna balans skiftas en bit i guldets favör.
Gårdagen besked skapade ju ingen rörelse i guldet, ett par dollar upp eller ner höjde inga ögonbryn. Men i den miljö vi har nu ska man inte titta på guldet – eller andra råvaror – i sin ”vanliga” prissättning i dollar. Gårdagens besked från ECB skapade en stor dollarförstärkning, varför man måste se hur guldet rör sig mot euron, eller – i vårt fall – den svenska kronan. ECB-beskedet igår fick guldet att stiga 1,5 procent mot euron, och 1 procent mot kronan. Sammantaget betyder detta att en svensk placerare som äger guld eller guldcertifikat kunnat se sina innehav stiga i värde under sommaren, trots att guldpriset mot dollar bara stigit marginellt. Handelsbankens raka certifikat, LONG GULD H, har stigit nära 7 procent under de tre senaste månaderna, drivet av att dollarkursen stärkts.
Sammanfattningsvis ser vi fortsatt bra potential i att äga guld, både som ett skydd mot finansiell oro, och då räntorna fortsätter pressas. Vi vill dessutom påminna om Handelsbankens syn på dollarn, som är fortsatt väldigt positiv trots senaste tidens förstärkning, med en ettårsprognos på 7,95. Som vanligt när det gäller mer långsiktiga positioner anser vi att hävstångscertifikat inte är lämpliga, utan det raka LONG GULD H är det som passar bäst.
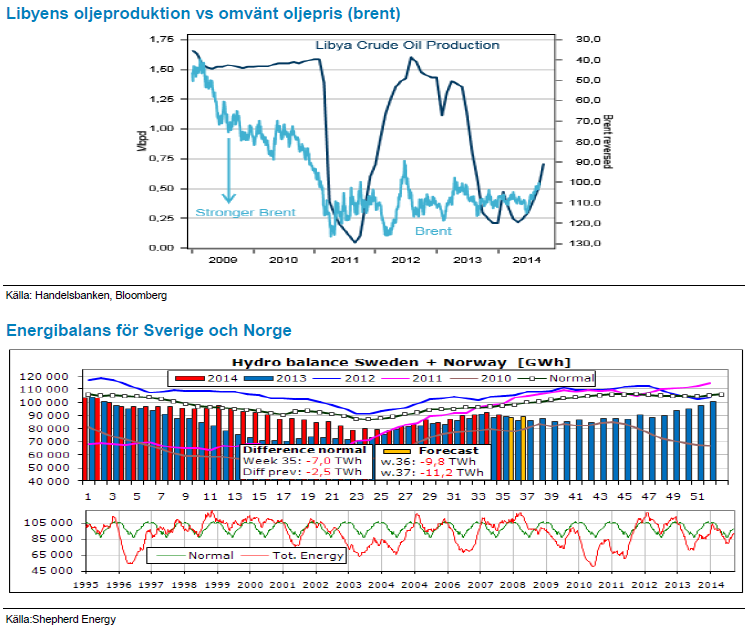
Energi: Libyen fick oljan på fall
Olja har handlats i princip oförändrat över denna vecka dock med en rejäl dip efter att Libyen utropat höjd oljeproduktion. Priset hämtade sig dock efter vapenvilan i Ryssland/Ukraina. Vi var tidigare övertygade om att oljan skulle rekylera tillbaka upp efter dykningen i augusti.
När vi nu ser Libyen på väg tillbaka blir vi mer försiktiga. USA har inlett året med en kraftig ökning i produktionen. Texas har nu adderat ett helt Norge på 3 år. Hittills har priseffekten av den ökade produktionen neutraliserats av utbudsstörningar i Mellanöstern. Om nu Libyen är på väg tillbaka blir det utbudspress både där och fortsatt från USA. Det är dock svårt att lita på trenden i Libyen, även vid årets början var Libyen på väg att öka produktionen men det föll snart samman i interna stridigheter där rebeller ville sälja oljan oberoende av de styrande i Tripoli.
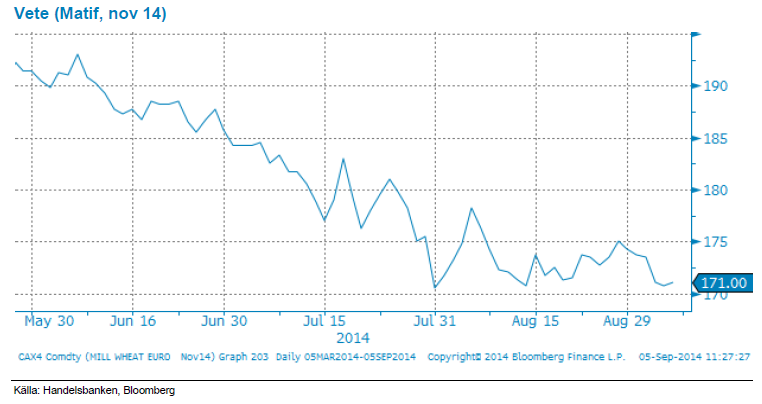
Elmarknaden handlas oförändrat under veckan men prisbilden får stöd av det högtrycksområde som vuxit in och pressat undan ett nederbördsrikt lågtrycksområde. Sämre påfyllnad i magasinen med andra ord och trenden med en försvagad energibalans fortsätter där man räknar med underskott om 11.2 TWh efter nästa vecka (se bilden nedan). Ser vi till bränslekomplexet är det fortsatt fokus på Ukraina/Ryssland som skapar osäkerhet främst på gasmarknaden där stigande priser ger stöd åt kontinentala elmarknader. Energikolet fortsätter dock ned då det finns gott om kol tillgängligt på exportmarknaden men där EURUSD balanserar. Även utsläppsrätterna försvagas något till omkring 6 EUR/ton men vi räknar med att dessa fortsätter att rangehandlas mellan 6-7 EUR i väntan på besked från kommissionen kring stabilitetsmekanismen så sammantaget en ganska mixad bild där vi bör kunna se ytterligare någon euro eller två på uppsidan om väderprognoserna står sig.
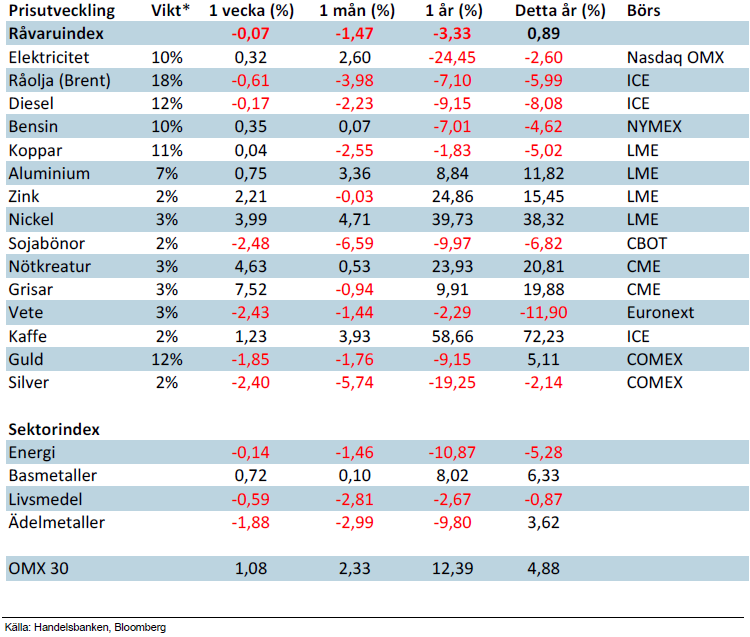
Livsmedel: Stora skördar pressar fortsatt priset på vete
Lägre riskpremie till följd av minskad oro i Ukraina har pressat vetepriset som under veckan handlades under 170 EUR/ton (nu något högre). Även skördepress med historiskt stora majsskördar i USA sätter press på både priset på majs och vetet då båda används som djurfoder.
För det amerikanska vetet verkar också brist på järnvägstransporter i USA bidra. Kall vinter har gjort att tågen som ska skeppa ut spannmål har fått vara kortare och stå stilla vissa veckor. Ökad konkurrens med att skeppa ut olja från Backen i North Dakota bidrar också till att järnvägarna är överbelastade. Vi behåller en neutral syn för utvecklingen på livsmedelssektorn.
För kaffet är det omvänt där september månad inleddes med stigande priser till följd av nedjustering av prognoserna för nästa års produktionssiffror. Det råder viss oro om världsproduktionen kan komma att möta efterfrågan trots flera år av rekordskördar. Under veckan har terminspriserna handlats uppemot 2,10 dollar/Ib för att sedan backa tillbaka. Den långa perioden av torka i början av året har nu orsakat stress och en för tidig utblomning av kaffeplantorna i vissa regioner av Brasilien. Den för tidiga utblomningen har försvårat skördearbetet och på de platser där maskiner använts har blommor rycks ut och skadats, vilket är ett stort orosmoment för de brasilianska kaffeodlarna. Frågan är nu vilka effekter detta kommer ha på den kommande skörden. Kaffemarknaden kan kort sammanfattas som fortsatt volatil och vi kan mycket väl se terminspriser över veckans högsta nivåer snart igen.
Handelsbankens råvaruindex (USD)
*Uppdaterade vikter från 29 november 2013
Handelsbankens råvaruindex består av de underliggande indexen för respektive råvara. Vikterna är bestämda till hälften från värdet av nordisk produktion (globala produktionen för sektorindex) och till hälften från likviditeten i terminskontrakten.
[box]SHB Råvarubrevet är producerat av Handelsbanken och publiceras i samarbete och med tillstånd på Råvarumarknaden.se[/box]
Ansvarsbegränsning
Detta material är producerat av Svenska Handelsbanken AB (publ) i fortsättningen kallad Handelsbanken. De som arbetar med innehållet är inte analytiker och materialet är inte oberoende investeringsanalys. Innehållet är uteslutande avsett för kunder i Sverige. Syftet är att ge en allmän information till Handelsbankens kunder och utgör inte ett personligt investeringsråd eller en personlig rekommendation. Informationen ska inte ensamt utgöra underlag för investeringsbeslut. Kunder bör inhämta råd från sina rådgivare och basera sina investeringsbeslut utifrån egen erfarenhet.
Informationen i materialet kan ändras och också avvika från de åsikter som uttrycks i oberoende investeringsanalyser från Handelsbanken. Informationen grundar sig på allmänt tillgänglig information och är hämtad från källor som bedöms som tillförlitliga, men riktigheten kan inte garanteras och informationen kan vara ofullständig eller nedkortad. Ingen del av förslaget får reproduceras eller distribueras till någon annan person utan att Handelsbanken dessförinnan lämnat sitt skriftliga medgivande. Handelsbanken ansvarar inte för att materialet används på ett sätt som strider mot förbudet mot vidarebefordran eller offentliggörs i strid med bankens regler.


The latest weekly report from the US DOE showed a substantial drawdown across key petroleum categories, adding more upside potential to the fundamental picture.

Commercial crude inventories (excl. SPR) fell by 5.8 million barrels, bringing total inventories down to 415.1 million barrels. Now sitting 11% below the five-year seasonal norm and placed in the lowest 2015-2022 range (see picture below).
Product inventories also tightened further last week. Gasoline inventories declined by 2.1 million barrels, with reductions seen in both finished gasoline and blending components. Current gasoline levels are about 3% below the five-year average for this time of year.
Among products, the most notable move came in diesel, where inventories dropped by almost 4.1 million barrels, deepening the deficit to around 20% below seasonal norms – continuing to underscore the persistent supply tightness in diesel markets.
The only area of inventory growth was in propane/propylene, which posted a significant 5.1-million-barrel build and now stands 9% above the five-year average.
Total commercial petroleum inventories (crude plus refined products) declined by 4.2 million barrels on the week, reinforcing the overall tightening of US crude and products.


A classic case of “buy the rumor, sell the news” played out in oil markets, as Brent crude has dropped sharply – down nearly USD 10 per barrel since yesterday evening – following Iran’s retaliatory strike on a U.S. air base in Qatar. The immediate reaction was: “That was it?” The strike followed a carefully calibrated, non-escalatory playbook, avoiding direct threats to energy infrastructure or disruption of shipping through the Strait of Hormuz – thus calming worst-case fears.
After Monday morning’s sharp spike to USD 81.4 per barrel, triggered by the U.S. bombing of Iranian nuclear facilities, oil prices drifted sideways in anticipation of a potential Iranian response. That response came with advance warning and caused limited physical damage. Early this morning, both the U.S. President and Iranian state media announced a ceasefire, effectively placing a lid on the immediate conflict risk – at least for now.
As a result, Brent crude has now fallen by a total of USD 12 from Monday’s peak, currently trading around USD 69 per barrel.
Looking beyond geopolitics, the market will now shift its focus to the upcoming OPEC+ meeting in early July. Saudi Arabia’s decision to increase output earlier this year – despite falling prices – has drawn renewed attention considering recent developments. Some suggest this was a response to U.S. pressure to offset potential Iranian supply losses.
However, consensus is that the move was driven more by internal OPEC+ dynamics. After years of curbing production to support prices, Riyadh had grown frustrated with quota-busting by several members (notably Kazakhstan). With Saudi Arabia cutting up to 2 million barrels per day – roughly 2% of global supply – returns were diminishing, and the risk of losing market share was rising. The production increase is widely seen as an effort to reassert leadership and restore discipline within the group.
That said, the FT recently stated that, the Saudis remain wary of past missteps. In 2018, Riyadh ramped up output at Trump’s request ahead of Iran sanctions, only to see prices collapse when the U.S. granted broad waivers – triggering oversupply. Officials have reportedly made it clear they don’t intend to repeat that mistake.
The recent visit by President Trump to Saudi Arabia, which included agreements on AI, defense, and nuclear cooperation, suggests a broader strategic alignment. This has fueled speculation about a quiet “pump-for-politics” deal behind recent production moves.
Looking ahead, oil prices have now retraced the entire rally sparked by the June 13 Israel–Iran escalation. This retreat provides more political and policy space for both the U.S. and Saudi Arabia. Specifically, it makes it easier for Riyadh to scale back its three recent production hikes of 411,000 barrels each, potentially returning to more moderate increases of 137,000 barrels for August and September.
In short: with no major loss of Iranian supply to the market, OPEC+ – led by Saudi Arabia – no longer needs to compensate for a disruption that hasn’t materialized, especially not to please the U.S. at the cost of its own market strategy. As the Saudis themselves have signaled, they are unlikely to repeat previous mistakes.
Conclusion: With Brent now in the high USD 60s, buying oil looks fundamentally justified. The geopolitical premium has deflated, but tensions between Israel and Iran remain unresolved – and the risk of missteps and renewed escalation still lingers. In fact, even this morning, reports have emerged of renewed missile fire despite the declared “truce.” The path forward may be calmer – but it is far from stable.
Analys
A muted price reaction. Market looks relaxed, but it is still on edge waiting for what Iran will do
Brent crossed the 80-line this morning but quickly fell back assigning limited probability for Iran choosing to close the Strait of Hormuz. Brent traded in a range of USD 70.56 – 79.04/b last week as the market fluctuated between ”Iran wants a deal” and ”US is about to attack Iran”. At the end of the week though, Donald Trump managed to convince markets (and probably also Iran) that he would make a decision within two weeks. I.e. no imminent attack. Previously when when he has talked about ”making a decision within two weeks” he has often ended up doing nothing in the end. The oil market relaxed as a result and the week ended at USD 77.01/b which is just USD 6/b above the year to date average of USD 71/b.

Brent jumped to USD 81.4/b this morning, the highest since mid-January, but then quickly fell back to a current price of USD 78.2/b which is only up 1.5% versus the close on Friday. As such the market is pricing a fairly low probability that Iran will actually close the Strait of Hormuz. Probably because it will hurt Iranian oil exports as well as the global oil market.
It was however all smoke and mirrors. Deception. The US attacked Iran on Saturday. The attack involved 125 warplanes, submarines and surface warships and 14 bunker buster bombs were dropped on Iranian nuclear sites including Fordow, Natanz and Isfahan. In response the Iranian Parliament voted in support of closing the Strait of Hormuz where some 17 mb of crude and products is transported to the global market every day plus significant volumes of LNG. This is however merely an advise to the Supreme leader Ayatollah Ali Khamenei and the Supreme National Security Council which sits with the final and actual decision.
No supply of oil is lost yet. It is about the risk of Iran closing the Strait of Hormuz or not. So far not a single drop of oil supply has been lost to the global market. The price at the moment is all about the assessed risk of loss of supply. Will Iran choose to choke of the Strait of Hormuz or not? That is the big question. It would be painful for US consumers, for Donald Trump’s voter base, for the global economy but also for Iran and its population which relies on oil exports and income from selling oil out of that Strait as well. As such it is not a no-brainer choice for Iran to close the Strait for oil exports. And looking at the il price this morning it is clear that the oil market doesn’t assign a very high probability of it happening. It is however probably well within the capability of Iran to close the Strait off with rockets, mines, air-drones and possibly sea-drones. Just look at how Ukraine has been able to control and damage the Russian Black Sea fleet.
What to do about the highly enriched uranium which has gone missing? While the US and Israel can celebrate their destruction of Iranian nuclear facilities they are also scratching their heads over what to do with the lost Iranian nuclear material. Iran had 408 kg of highly enriched uranium (IAEA). Almost weapons grade. Enough for some 10 nuclear warheads. It seems to have been transported out of Fordow before the attack this weekend.
The market is still on edge. USD 80-something/b seems sensible while we wait. The oil market reaction to this weekend’s events is very muted so far. The market is still on edge awaiting what Iran will do. Because Iran will do something. But what and when? An oil price of 80-something seems like a sensible level until something do happen.


USA ska införa 50 procent tull på koppar

Ryska staten siktar på att konfiskera en av landets största guldproducenter

Hur säkrar vi Sveriges tillgång till kritiska metaller och mineral i en ny geopolitisk verklighet?

Lundin Mining ska bli en av de tio största kopparproducenterna i världen

Sommarvädret styr elpriset i Sverige

Mahvie Minerals växlar spår – satsar fullt ut på guld

Uppgången i oljepriset planade ut under helgen

Låga elpriser i sommar – men mellersta Sverige får en ökning

Oljan, guldet och marknadens oroande tystnad
A muted price reaction. Market looks relaxed, but it is still on edge waiting for what Iran will do
-
 Nyheter3 veckor sedan
Mahvie Minerals växlar spår – satsar fullt ut på guld
-
 Nyheter4 veckor sedan
Uppgången i oljepriset planade ut under helgen
-
 Nyheter4 veckor sedan
Låga elpriser i sommar – men mellersta Sverige får en ökning
-
 Nyheter3 veckor sedan
Oljan, guldet och marknadens oroande tystnad
-
Analys3 veckor sedan
A muted price reaction. Market looks relaxed, but it is still on edge waiting for what Iran will do
-

 Nyheter3 veckor sedan
Jonas Lindvall är tillbaka med ett nytt oljebolag, Perthro, som ska börsnoteras
-
Analys4 veckor sedan
Very relaxed at USD 75/b. Risk barometer will likely fluctuate to higher levels with Brent into the 80ies or higher coming 2-3 weeks
-

 Nyheter3 veckor sedan
Domstolen ger klartecken till Lappland Guldprospektering