

Analys
SHB Råvarubrevet 4 april 2014

Råvaror allmänt: Dataintensiv vecka bekräftar global motvind
 Efter en viktig och tung datavecka står det klart att nedgången i början av året i USA inte enbart kan härledas till den kalla vintern. En lägre aktivitet än under slutet av förra året ska nu prisas in. I Kina fortsätter data att försämras.
Inköpschefsindex var visserligen snäppet bättre än under februari men ska normalt vara mycket starkare under mars och april som sparkar igång årets mest intensiva period i Kinesisk industri. Tar man hänsyn till det så fortsätter nedgången i den kinesiska dataströmmen.
Oljemarknaden tog till sig den svaga amerikanska inköpschefssiffran och föll snabbt 2 dollar under tisdagen. Under onsdagen gick sedan oljan till årslägst och under 105 USD efter att rebellerna i Libyen var nära en överrenskommelse om att öppna hamnarna för oljeexport igen. Vi har argumenterat för att oljan står inför sin svagaste period på året och att återkomsten av Iraq och Libyen kan göra årets svacka djupare än vanligt. Annars har råvarumarknaden inte reagerat nämnvärt på svag makrodata från Kina. Vi tror att förklaringen är att investerare redan är korta kinarelaterade råvaror vilket minskar rörelserna på nedsidan och förstärker rekyler uppåt. Marknaden har spekulerat tungt i att det ska komma stimulanser från kinesiska ledare, i veckan kom ministimulanser som inte är någon ”game changer”. Vi tror att det är inprisat en spänning i kinarelaterade råvaror, speciellt koppar, där eventuellt uteblivna stimulanser kan komma att leda till ytterligare en nedgång.
Amerikanska sysselsättningssiffror – vilka marknaden väntat på med spänning – kom in i linje med förväntningarna (192 000 nya jobb), En något högre arbetslöshet gjorde dock att räntorna kom ned en del, och marknaden ser för sig en längre period av QE. En mix som borde gynna riskaptiten!
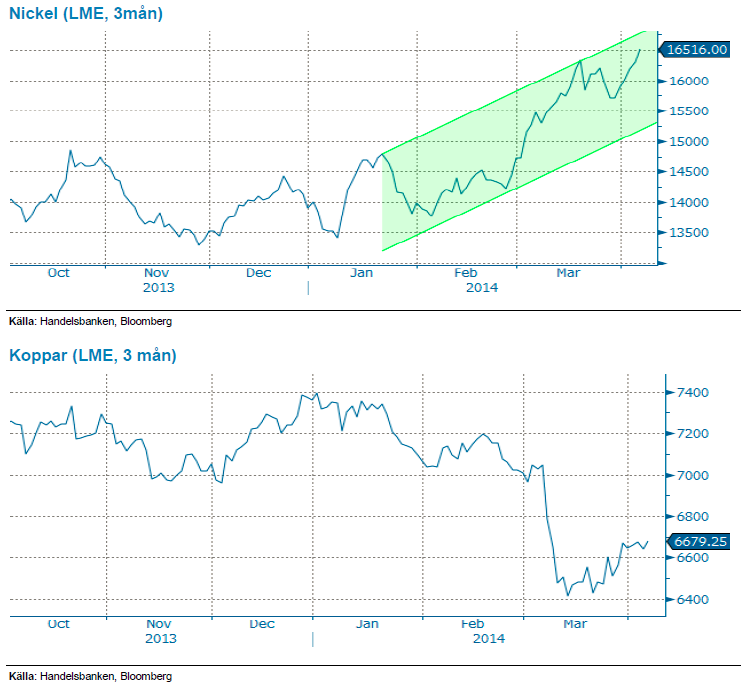
Basmetaller: Nickel fortsätter att imponera
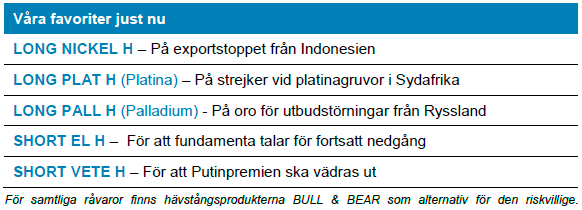
Under veckan har vi konkretiserat vår vy på nickel Trading Case på nickel. Nickel har under veckan stigit ytterligare 5 % och hittills i år har metallen stigit 18 %. Vi tror nickel kommer befinna sig i en stigande trend under hela året och bedömer den största risken som utgången av valet i Indonesien. Presidentval hålls i juli men vi tror att oavsett utgång av valet kommer Indonesien behålla exportförbudet fram till raffinaderierna är utbyggda under första halvåret 2015. Läs hela caset här.
Koppar har klarat sig någorlunda bra denna vecka efter ett tungt första kvartal. Data visar att investerar nu är rekordkorta koppar vilket gör att marknaden känslig för short covering (när investerare köper tillbaka sålda kontrakt). Vi är fortsatt något negativa till utvecklingen för metallen men bättre makrodata från USA, (lite) stimulans från Kina och korta investerare ger stöd till priset.
Till sist meddelades i förra veckan att den regelförändringen som LME skulle införa den 1 april i år, för att korta leveranstiderna från börsens lager, blir lagd på is.
Ädelmetaller: Guldet laddar för Fed-möte
Två veckor har gått sedan förra brevet då vi beskrev reaktionerna på Federal Reserves något mer hökaktiga kommunikation som väldigt viktiga för guldpriset. Sedan Janet Yellen började tala om räntehöjningar har guldet tappat drygt 2,5 %, men hela veckan har priset legat stilla. Vi handlar ganska nära topparna, men den senast tidens inflöden i ETF-marknaden har avstannat.
Sammantaget befinner sig guldet i ett ganska känsligt läge, och nästa Fed-möte är drygt tre veckor bort. Amerikanska räntor, vilka steg rejält efter Fed-mötet ligger kvar på sina högsta-nivåer, vilket indikerar att marknaden är rädd för ytterligare hökaktiga besked. Vi behåller vår positiva syn på guld, men anser fortfarande att man bör ”dansa nära nödutgången”, och vara ödmjuk om priset börjar falla igen. Konsensus-synen på guld är fortfarande negativ, vilket gör att man kan spela ”motvalls” genom att ligga lång eller köpa guld, och skulle Fed visa sig vara mindre hökaktig vid nästa möte (29-30 april) borde vi kunna ta ny fart uppåt igen. Rörelserna fram till dess kommer att ge mer signaler på hur marknaden positionerar sig.
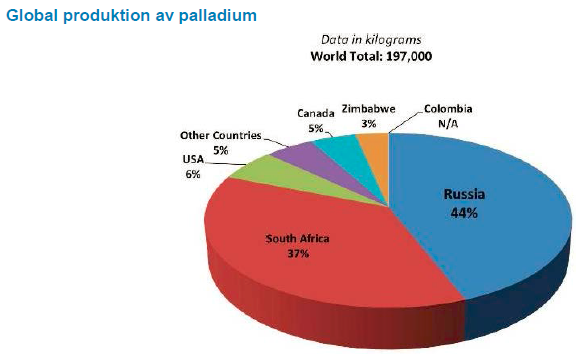
Vi noterar att både platina (+/- 0) och palladium (+3 %) har klarat Fed-retoriken avsevärt bättre än guldet, delvis med stöd av oron över Ryssland-Ukraina. Ryssland är världens största producent av palladium.
Mot bakgrund av risken för utbudsstörningar från Ryssland, och guldets större räntekänslighet, sätter vi nu palladium som en av våra favoriter, då vi fortfarande är positiva till ädelmetaller generellt.
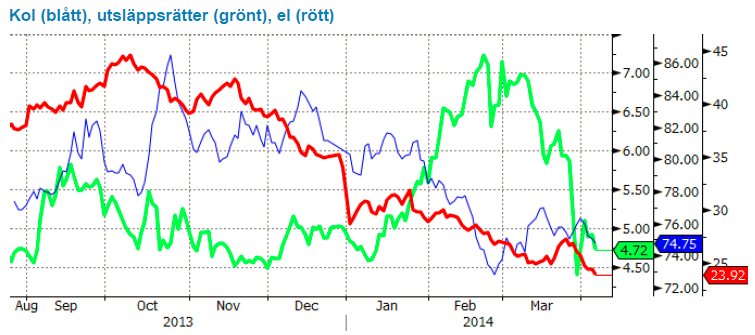
Energi: Elpriset ser svagt ut
Elmarknaden faller med närmare 7 procent under veckan och vi står fast vid vy att det kan finnas ytterligare några euro kvar på nedsidan för kvartalet Q3 2014 (nedan i rött indexerat ett år tillbaka). Det finns egentligen ingen faktor som pekar uppåt sett till energibalansen som bör landa på svagt plus under den kommande veckan, utsläppsrätter som förra veckan föll över 20 procent på utsläppsrapporten för 2013 (vilken påtvingade en del stoppar, se nedan i grönt) samt kol som faller med ytterligare en dollar.
Lägg därtill en ganska svag tysk marknaden och fortsatt press på gaspriset. Det enda som egentligen kan störa bilden något är Ringhals 1 som förväntas vara igång den 11e juni igen där det verkar finnas ovanligt stor risk för försening men i övrigt pekar det mesta ned. Med detta som grund har vi valt SHORT EL H som en annan av våra favoriter just nu.
Livsmedel: Vete väntas falla ytterligare
Med regnet tillbaka i Brasilien har kaffeterminerna fallit tillbaka från två-årshögsta och handlas sedan två veckor tillbaka inom intervallet 1.70-1.80 dollar/Ib. Vi bibehåller vår neutrala vy då situationen i de kaffeproducerande regionerna ser ut att ha stabiliserats. Dock kvarstår spekulationer om storleken på bortfallet för årets skörd, vilket vi följer med spänning. Efter en kortare mognadsperiod på grund av torkan under utblomningsperioden, väntas nu skörden starta tidigare än normalt.
Extrem torka i området kring Elfenbenskusten låg bakom förra årets höga kakaopriser. I år väntas goda skördar efter hittills gynnsamt väder i viktiga kakaoregioner med visst undantag för Indonesien där väder och svampangrepp varit en utmaning. På sikt ser vi dock risk på uppsidan då varmare och torrare klimat över normalen väntas i samband med El Niño. En studie från ICCO visar på vilka effekter som El Niño haft på den globala kakaoproduktionen de senaste 60 åren, där framförallt Indonesien och Ecuador tagit mest stryk.
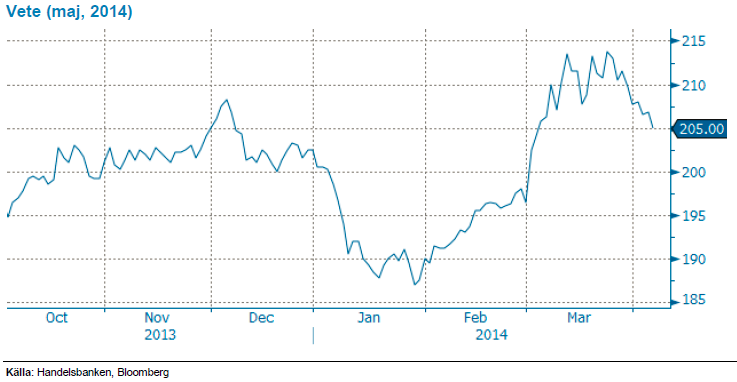
Priset på vete har gått ned 2,2 % under veckan, inte minst till följd av att det amerikanska höstvetet äntligen fått lite mer regn, mer önskas men helt klart har situationen lindrats. Dessutom ser det ut att komma mer regn under nästa vecka. Ukraina har nu fått en del skurar, vilket bara gynnar då det i vissa områden varit lite torrt. Höstvetet i Ukraina uppges vara i gott skick och vårsådden är i stort sett avklarad utan problem. Ryssland ser nästa vecka ut att få lite varmare väder – vilket gynnar både höstvetet och snabbar på starten av vårsådden. I Australien har det kommit en del regn, främst i landets östra delar, vilket tar bort en del av oron inför kommande sådd. Generellt sett är de höstsådda grödorna alltså i ett gott skick på det norra halvklotet, det största problemet har varit torkan för det amerikanska höstvetet – vilket dock fortfarande oroar men i alla fall lindrats. Problemen i Ukraina lever än men vetesådden har inte drabbats och än så länge inte heller majssådden och priserna ligger kvar på en klart högre nivå jämfört med innan konflikten startade. Givet att inget mer allvarligt sker i Ukraina/Ryssland kommer marknaden nu fokusera mer på väder och utsikter för ny skörd – vilket än så länge ser lovande ut. Vi placerar SHORT VETE H som en av våra favoriter just nu.
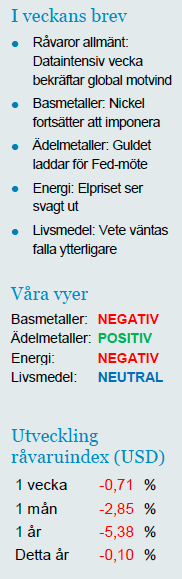
Handelsbankens råvaruindex (USD)
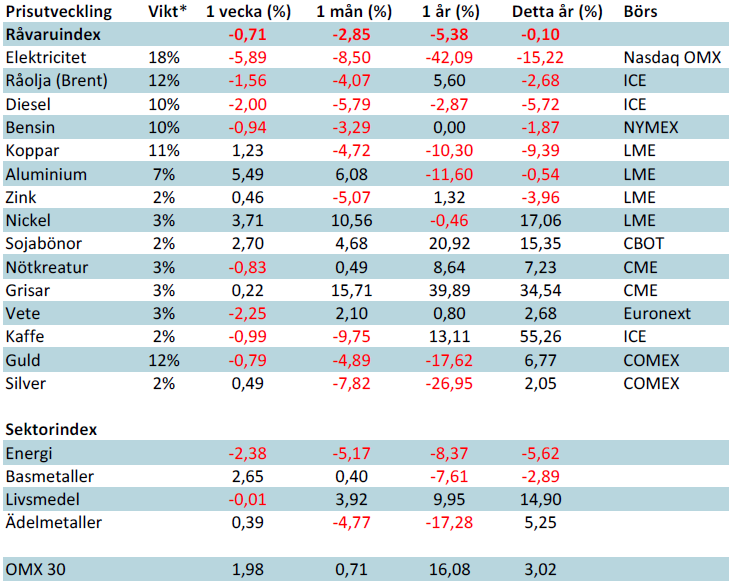
*Uppdaterade vikter från 29 november 2013
Handelsbankens råvaruindex består av de underliggande indexen för respektive råvara. Vikterna är bestämda till hälften från värdet av nordisk produktion (globala produktionen för sektorindex) och till hälften från likviditeten i terminskontrakten.
[box]SHB Råvarubrevet är producerat av Handelsbanken och publiceras i samarbete och med tillstånd på Råvarumarknaden.se[/box]
Ansvarsbegränsning
Detta material är producerat av Svenska Handelsbanken AB (publ) i fortsättningen kallad Handelsbanken. De som arbetar med innehållet är inte analytiker och materialet är inte oberoende investeringsanalys. Innehållet är uteslutande avsett för kunder i Sverige. Syftet är att ge en allmän information till Handelsbankens kunder och utgör inte ett personligt investeringsråd eller en personlig rekommendation. Informationen ska inte ensamt utgöra underlag för investeringsbeslut. Kunder bör inhämta råd från sina rådgivare och basera sina investeringsbeslut utifrån egen erfarenhet.
Informationen i materialet kan ändras och också avvika från de åsikter som uttrycks i oberoende investeringsanalyser från Handelsbanken. Informationen grundar sig på allmänt tillgänglig information och är hämtad från källor som bedöms som tillförlitliga, men riktigheten kan inte garanteras och informationen kan vara ofullständig eller nedkortad. Ingen del av förslaget får reproduceras eller distribueras till någon annan person utan att Handelsbanken dessförinnan lämnat sitt skriftliga medgivande. Handelsbanken ansvarar inte för att materialet används på ett sätt som strider mot förbudet mot vidarebefordran eller offentliggörs i strid med bankens regler.


Market is starting to take US/Iran headlines with a pinch of salt. Brent crude rose $2.8/b yesterday to an official close of $112.1/b. But after that it traded as low as $108.05/b before ending late night at around $109.7/b. Through the day it traded in a range of $106.87 – 112.72/b amid a flurry of news or rumors from Iran and the US. ”US temporary sanctions during negotiations” (falls alarm). ”We will bomb Iran” (not anyhow),… etc. While the market is still fluctuating to this kind of news flow, it is starting to take such headlines with a pinch of salt.

We’ll see. Maybe, maybe not. The Brent M1 contract is trading at $110.2/b this morning which very close to the average ticks through yesterday of $110.4/b.
Trump with bearish, verbal intervention whenever Brent trades above $110/b it seems. What seems to be a pattern is that Trump states something like ”very good negotiations going on with Iran”, ”New leaders in Iran are great,..”, ”Great progress in negotiations,…”, ”Deal in sight,..” etc whenever the Brent M1 contract trades above $110/b. An effort to cool the market. These hot air verbal interventions from Trump used to have a heavy bearish impact on prices, but they now seems to have less and less effect unless they are backed by reality.
As far as we can see there has been no real progress in the negotiations between the US and Iran with both sides still standing by their previous demands.
Iran is getting stronger while the cease fire lasts making a return to war for Trump yet harder. Iran is naturally in constant preparation for a return to war given Trump’s steady threats of bombing Iran again. Iran is naturally doing what ever is possible to prepare for a return to war. And every day the cease fire lasts it is better prepared. This naturally makes it more and more difficult and dangerous for the US to return to warring activity versus Iran as the consequences for energy infrastructure in the Persian Gulf will be more and more severe the longer the cease fire lasts. Israel seems to see it this way as well. That the war is not won and that current frozen state of a cease fire gives Iran opportunity to rebuild military and politically.
Global inventories are drawing down day by day. How much? In the meantime the Strait of Hormuz stays closed. There is varying measures and estimates of how much global inventories are drawing down. Our rough estimate, back of the envelope, is that global inventories are drawing down by at least some 10 mb/d or about 300 mb/d in a balance between loss of supply versus demand destruction. Other estimates we see are a monthly draw of 250-270 mb/d. The IEA only ’measured’ a draw in global observable stocks of 117 mb in April with oil on water rising 53 mb while on shore stocks fell 170 mb. But global stocks are hard to measure with large invisible, unmeasured stocks. As such a back of the envelope approach may be better.
Oil products is what the world is consuming. Oil product prices likely to rise while product stocks fall. Strategic Petroleum Reserves (SPR) are predominantly crude oil. Discharging oil from OECD SPR stocks, a sharp reduction in Chinese crude imports and a reduction in global refinery throughput of 6-7 mb/d has helped to keep crude oil markets satisfactorily supplied. But global inventories are drawing down none the less. And oil products is really what the world is consuming. So if global refinery throughput stays subdued, then demand will eventually have to match the supply of oil products. The likely path forward this summer is a steady draw down in jet fuel, diesel and gasoline. Higher prices for these. Then, if possible, higher refinery throughput and higher usage of crude in response to very profitable refinery margins. And lastly sharper draw in crude stocks and higher prices for these. But some 6 mb/d of oil products used to be exported through the Strait of Hormuz. And it may not be so easy to ramp up refinery activity across the world to compensate. Especially as Ukraine continues to damage Russian refineries as well as Russian crude production and export facilities.
Watch oil product stocks and prices as well as Brent calendar 2027. What to watch for this summer is thus oil product inventories falling and oil product premiums to crude rising. Another measure to watch is the Brent crude 2027 contract as it rises steadily day by day as the Strait of Hormuz stays closed and global oil inventories decline. The latter is close to the highest level since the start of the war and keeps rising.
The Brent M1 contract and the Brent 2027 prices and current price of jet fuel in Europe (ARA). All in USD/b

Our back of the envelope calculation of the global shortage created by the closure of the Strait of Hormuz. Note that 3.5 mb/d of discharge from SPR is also a draw. Note also that ’Forced demand loss’ of 2.5 mb/d is probably temporary and will fall back towards zero as logistics are sorted out leaving ’Price demand loss’ to do the job of balancing the market. Thus a shortfall of at least 9 mb/d created by the closure. More if SPR discharge is included and more if Forced demand loss recedes.

Brent is climbing higher. Front-month is at USD 106.3/bl this morning, close to a weekly high and a USD 9/bl jump from Mondays open. This is the move we flagged as a risk earlier in the week: the market shifting from ”a deal is around the corner” to ”this is going to take longer than we thought”.

Analyst Commodities, SEB
During April, rest-of-year Brent remained remarkably stable around USD 90/bl. A stability which rested on one single assumption: the SoH reopens around 1 May. That assumption is now slowly falling apart.
As we highlighted yesterday: every week of delay beyond 1 May adds (theoretically) ish USD 5/bl to the rest-of-year average, as global inventories draw 100 million barrels per week. i.e., a mid-May reopening implies rest-of-year Brent closer to USD 100/bl, and anything pushing into June or July takes us meaningfully higher.
What’s changed in the last 48 hours:
#1: The US military has formally warned that clearing suspected sea mines from SoH could take up to six months. That is a completely different timescale from what the financial market is pricing. Even a political deal tomorrow does not immediately reopen the strait.
#2: Trump has shifted his tone from urgency to ”strategic patience”. In yesterday’s press conference: ”Don’t rush me… I want a great deal.” The market is reading this as a president no longer feeling pressured by timelines, with the naval blockade running in the background.
#3: So far, the military activity is escalating, not de-escalating. Axios reports Iran is laying more mines in SoH. The US 3rd carrier strike group (USS George H.W. Bush) is arriving with two countermine vessels. Trump yesterday ordered the US Navy to destroy any Iranian boats caught laying mines. While CNN reports that the Pentagon is actively drawing up plans to strike Iranian SoH capabilities and individual Iranian military leaders if the ceasefire collapses. i.e., NOT a attitude consistent with an imminent deal!
Spot crude and product prices eased off the early-April highs on a combination of system rerouting and deal optimism. Both now weakening. Goldman estimates April Gulf output is reduced by 14.5 mbl/d, or 57% of pre-war supply, a number that keeps getting worse the longer this drags on.
Demand-side adaptation is ongoing: S. Korea has cut its Middle East crude dependence from 69% to 56% by pulling more from the Americas and Africa, and Japan is kicking off a second round of SPR releases from 1 May. But SPRs are finite.
Ref. to the negotiations, we should not bet on speed. The current Iranian leadership is dominated by genuine hardliners willing to absorb economic pain and run the clock to extract concessions. That is not a setup for a rapid resolution. US/Israeli media briefings keep framing the delay as ”internal Iranian divisions”, the reality is more complicated and points toward weeks and months, not days.
Our point is that the complexity is large, and higher prices have only just started (given a scenario where the negotiations drag out in time). The market spent April leaning on the USD 90/bl rest-of-year assumption; that case is diminishing by the hour. If ”early May reopening” is replaced by ”June, July or later” over the next week or two, both crude and products have meaningful room to reprice higher from here. There is a high risk being short energy and betting on any immediate political resolution(!).
Down on Friday. Up on Monday. The Brent June crude oil contract traded down 5.1% last week to a close of $90.38/b. It reached a high of $103.87/b last Monday and a low of $86.09/b on Friday as Iran announced that the Strait of Hormuz was fully open for transit. That quickly changed over the weekend as the US upheld its blockade of Iranian oil exports while Iran naturally responded by closing the SoH again. The US blew a hole in the engine room of the Iranian ship TOUSKA and took custody of the ship on Sunday. Brent crude is up 5.6% this morning to $95.4/b.
The cease-fire is expiring tomorrow. The US has said it will send a delegation for a second round of negotiations in Islamabad in Pakistan. But Iran has for now rejected a second round of talks as it views US demands as unrealistic and excessive while the US is also blocking the Strait of Hormuz.
While Brent is up 5% this morning, the financial market is still very optimistic that progress will be made. That talks will continue and that the SoH will fully open by the start of May which is consistent with a rest-of-year average Brent crude oil price of around $90/b with the market now trading that balance at around $88/b.
Financial optimism vs. physical deterioration. We have a divergence where the financial market is trading negotiations, improvements and resolution while at the same time the physical market is deteriorating day by day. Physical oil flows remain constrained by disrupted flows, longer voyage times and elevated freight and insurance costs.
Financial markets are betting that a US/Iranian resolution will save us in time from violent shortages down the road. But every day that the SoH remains closed is bringing us closer to a potentially very painful point of shortages and much higher prices.
The US blockade is also a weapon of leverage against its European and Asian allies. When Iran closed the SoH it held the world economy as a hostage against the US. The US blockade of the SoH is of course blocking Iranian oil exports. But it is also an action of disruption directed towards Europe and Asia. The US has called for the rest of the world to engaged in the war with Iran: ”If you want oil from the Persian Gulf, then go and get it”. A risk is that the US plays brinkmanship with the global oil market directed towards its European and Asian allies and maybe even towards China to force them to engage and take part. Maybe unthinkable. But unthinkable has become the norm with Trump in the White House.


Sommarväder skapar prisrally på elbörsen
Oil product price pain is set to rise as the Strait of Hormuz stays closed into summer

Solkraften pressar elpriserna dagtid

Michel Gubel ger sin syn på oljemarknaden