

Analys
SHB Råvarubrevet 3 maj 2013

 Råvaror allmänt
Råvaror fortsatt under press, men det finns skäl att vara positiv
Vågen av sämre än väntat makroekonomisk data fortsätter och har satt ytterligare press på råvarorna. Under veckan kom bland annat inköpschefsindex för april månad från USA och Kina. Till skillnad från tidigare veckor under mars och april så ser vi nu tydliga tecken på att råvarorna rekylerar kraftigt dagen efter att de blivit nersålda till tonerna av sämre makrodata. Realekonomin har trots allt inte försämrats så dramatiskt även om indikatorer har fallit ut sämre än förväntansbilden.
Ett skäl att vara mer positiv är att både FED och ECB denna vecka sagt eller indikerat att riskerna i ekonomin fortfarande är på nedsidan varför osäkerheten om att centralbankerna skulle minska sitt stöd till marknaden har minskat. ECB sänkte räntan under veckan enligt förväntansbild och kan sänka depositräntan till under 0 % redan i sommar. I takt med att förväntansbilden nu håller på att justeras ner så kommer också makrodata framöver att te sig bättre. Veckans positiva vindar kom i form av bättre än väntad jobbdata från USA både i torsdagens jobbless claims och i fredagens nonfarm payrolls.
Basmetallerna
Både ner och upp under veckan
Basmetallerna föll kraftigt inledningsvis under veckan som konsekvens av sämre inköpschefsindex i Kina och USA. Kinas metallhandlare hade dessutom ledigt vilket fick västerländska aktörer fria händer att handla ner metallerna, som alla föll ca 5 %. När kineserna kom tillbaka under fredagen studsade metallerna åter upp, vilket tyder på att kinesiska köpintresse är starka på dessa nivåer. Starka sysselsättningssiffror från USA gav ytterligare skjuts och basmetallarna steg på bred front under fredag eftermiddag.
Nickel har haft ytterligare ett ras under veckan men är nu väldigt billigt jämfört med produktionskostnaden som ligger uppe på 16-17 000, jämfört med dagens pris på strax över 15 000 USD/ton. Just nu är det dock ont om dem som vågar köpa på sig basmetaller trots att de ser riktigt billiga ut.
Vi tror att metallerna kommer fortsätta att ha det motigt i den rådande svaga makromiljön men har stor potential inför hösten från dagens låga nivåer.
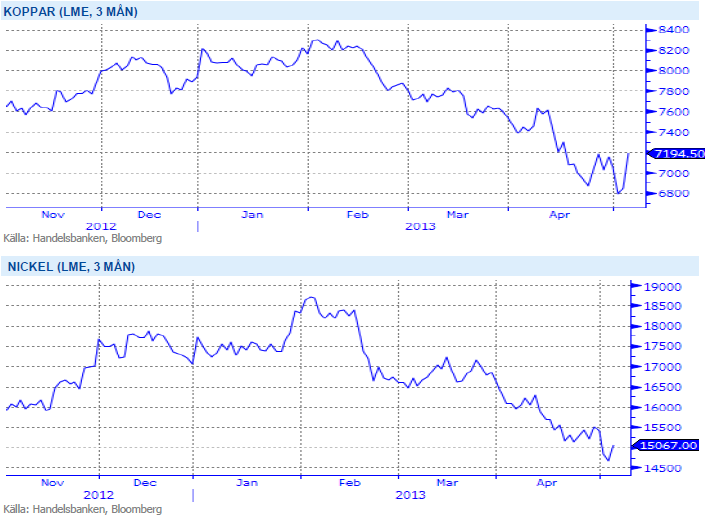
Trots fortsatt svag makromiljö och fortsatt risk på nedsidan ser vi ändå basmetaller som köpvärda på dessa nivåer. Vi tror på: LONG BASMET H
Ädelmetaller
Vi håller fast vid vår vy – guldet ska ner
En vecka med mjuka makrosiffror och en räntesänkning från ECB, tätt inpå det kraftiga guldras vi såg nyligen borde ha skickat guldpriset rejält uppåt. Detta har dock inte hänt, de högsta nivåerna denna vecka har varit exakt desamma som de högsta nivåerna förra veckan.
När nu denna vecka går mot sitt slut och vi kröner den med något starkare arbetslöshetssiffror från USA får vi ett bra test på guldets eventuella svaghet eller styrka. Ett initialt fall från 1480 dollar per uns ner till 1460 är det enda vi sett ännu, och intressant blir det först om vi antingen tar nya highs för veckan över 1500 dollar, alternativt nya lows under 1440 dollar.
Vår vy är vid detta laget väl känd, vi tror inte på annat än kortsiktig uppsida, och den känsliga sidan är alltjämt nedsidan.
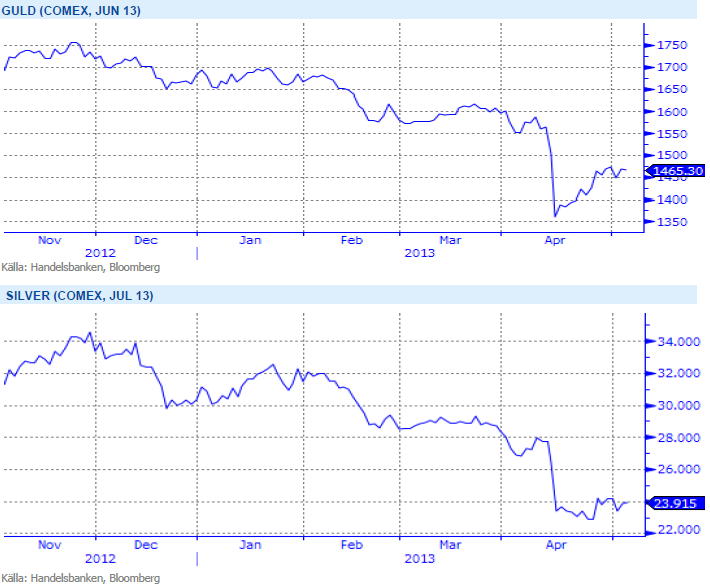
Trots det största raset på 30 år tror vi att förtroendet för guld håller på urholkas och att trenden nedåt fortsätter. Vi tror på: SHRT GULD H
Energi
Förbättrad energibalans!
Elpriset föll under veckan med nästan 3 % (Q3 13) och vi förväntar oss fallande kurser de närmaste dagarna med någon euro eller två för Q313. Bränslekomplexet och kol i synnerhet är fortsatt under press då utbudet av energikol på exportmarknaden överträffar förväntningarna. Detta beror främst på en god tillgång på gas som i sin tur ger USA tillgång till billig el och mindre behov av den lokala kolen. Ser man till kostnaden för att bryta kol, dvs diesel och arbete, ger den dock stöd för kol på dessa lägre nivåer och dessa faktorer lär inte heller ge vika på lite längre sikt. Väderprognoserna pekar däremot återigen mot en våt avslutning och energibalansen ser nu ut att förbättras till -14.35 TWh från -24 TWh där vi var för två veckor sedan.
Ser vi till utsläppsrätterna steg priset under fredagen med dryga 16 % efter uttalande från Merkel om att backloadningplanen är nödvändig för att utvecklingen inte ska gå åt fel håll. Marknaden har även fått stöd under veckan då sista köparna täcker sina behov för att klara sina leveransåtaganden och undvika en straffavgift om 100 euro per ton. Vi förväntar oss att utsläppsrätterna handlas vidare på dessa låga nivåer i väntan på ett eventuellt försök från EU Kommissionen att återuppliva EU ETS (eller i alla fall hoppet om EU ETS framtid).
Oljan (brent) har följt med makrodata under veckan, ner under 100 efter PMI siffror för att senare stärkas efter positiv jobbdata och handlas nu över 104 USD/fat. Ryssland ökar sin produktion under april med 1,5 % y-o-y till 10,47 miljoner fat per dag och president Putin kräver att produktionen ska upprätthållas över 10 miljoner fat per dag. Vi behåller vår positiva vy för denna sektor.
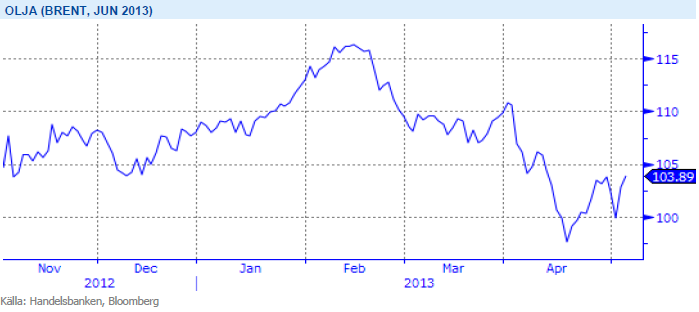
OPEC har tidigare aktivt och framgångsrikt försvarat prismålet 100-110 USD och vi väntar oss handling snarare än besked från kartellen inom kort. Konfliken mellan Israel och Iran är nästa skäl att förvänta sig högre oljepriser under H2. Vi tror på: LONG OLJA H
Livsmedel
Ännu ingen panik för majssådden
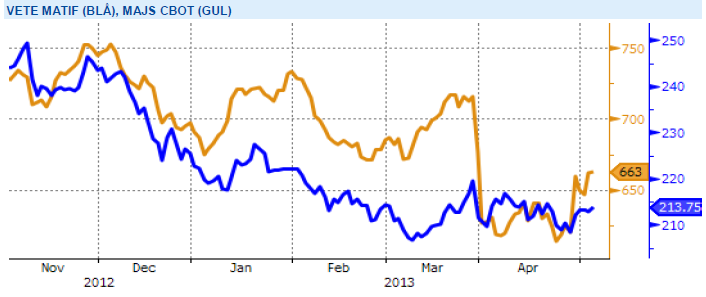
Priserna på majs i Chicago har gått upp kraftigt under veckan (vilket även drog upp vetepriset) det främst som följd av fortsatt fördröjning för den amerikanska majssådden. Resterande del av veckan ser ut att vara kall och även innehålla ytterligare lite nederbörd. Nästa vecka ser dock, i alla fall för tillfället, ut att bjuda på både varmare och torrare väder. Den 10:e maj benämns ofta som ett viktigt datum för den amerikanska majssådden, sådd efter det brukar innebära lägre avkastningspotential med omkring 1 bushel per acre för varje dag. I kommande måndags rapport från USDA bör inte sådden ha nått så mycket mer än 20 procent avklarat – med få dagar kvar till 10:e maj. Förbättrat väder kan dock förändra situationen snabbt, år 2001 sådde t.ex. den viktiga delstaten Indiana 50 procent av majsarealen på bara en vecka. Än tycker vi därför att paniken kan vänta ett tag till – genomsnittliga avkastningen för åren 2007-2011 är 154 bushels per acre, vi bör således ännu vara väldigt långt ifrån att inte få en kraftig produktionsökning jämfört med förra årets låga 123 bushels per acre.
Höstvetet i USA upplever nu ett ganska kallt och nederbördsrikt väder, vilket inte gynnar de redan hårt ansträngda grödorna. Liknande situation råder i de amerikanska vårveteregionerna, vilket inte underlättar för pågående sådd. Helgen och nästa vecka ser dock ut att kunna ge både varmare och torrare väder, till de amerikanska lantbrukarnas glädje. I EU är vädret ganska varierande, de centrala och södra delarna har fått en hel del nederbörd medan de norra och nordöstra områdena är torra. Grödorna i EU är generellt sett efter i utvecklingen men än finns chans att komma ikapp. Kommande prisutveckling är väldigt beroende av vädret den närmsta tiden, inte minst för pågående och försenade majssådd i USA. I dagsläget upplevs dock större problem enbart för de amerikanska grödorna, gällande väderprognos för kommande vecka inger dock visst hopp om förbättring. Mycket kan hända innan skörd men i dagsläget är vi kvar i vår tro om större skördar och ökade lagernivåer med lägre priser längre fram på året som följd. Vi behåller dock neutral vy för sektorn livsmedel på kort sikt.
Då priserna har på de stora jordbruksråvarorna soja, majs och vete har fallit tillbaka till nivåer före torkan i USA, tror vi att en nedsida är begränsad på kort sikt och därför är vi neutrala till utvecklingen för denna sektor.
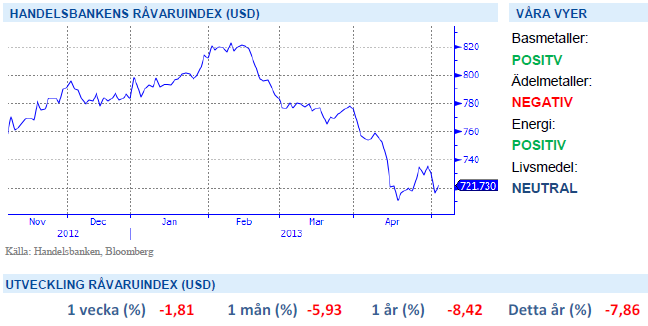
Handelsbankens Råvaruindex
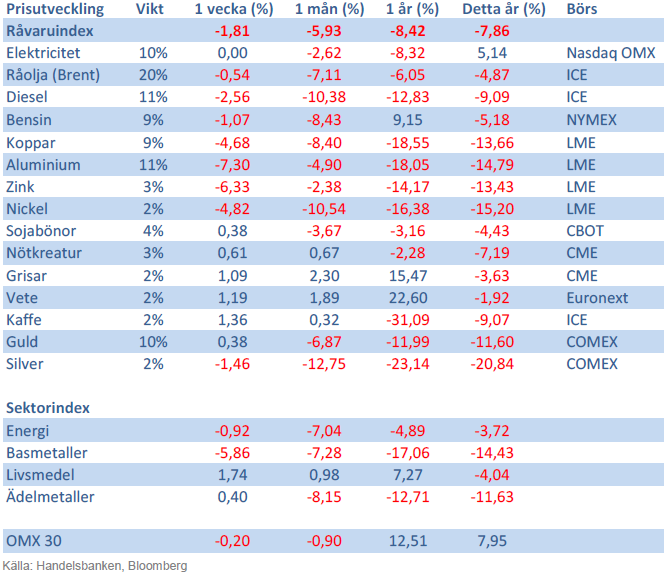
Handelsbankens råvaruindex består av de underliggande indexen för respektive råvara. Vikterna är bestämda till hälften från värdet av global produktion och till hälften från likviditeten i terminskontrakten.
[box]SHB Råvarubrevet är producerat av Handelsbanken och publiceras i samarbete och med tillstånd på Råvarumarknaden.se[/box]
Ansvarsbegränsning
Detta material är producerat av Svenska Handelsbanken AB (publ) i fortsättningen kallad Handelsbanken. De som arbetar med innehållet är inte analytiker och materialet är inte oberoende investeringsanalys. Innehållet är uteslutande avsett för kunder i Sverige. Syftet är att ge en allmän information till Handelsbankens kunder och utgör inte ett personligt investeringsråd eller en personlig rekommendation. Informationen ska inte ensamt utgöra underlag för investeringsbeslut. Kunder bör inhämta råd från sina rådgivare och basera sina investeringsbeslut utifrån egen erfarenhet.
Informationen i materialet kan ändras och också avvika från de åsikter som uttrycks i oberoende investeringsanalyser från Handelsbanken. Informationen grundar sig på allmänt tillgänglig information och är hämtad från källor som bedöms som tillförlitliga, men riktigheten kan inte garanteras och informationen kan vara ofullständig eller nedkortad. Ingen del av förslaget får reproduceras eller distribueras till någon annan person utan att Handelsbanken dessförinnan lämnat sitt skriftliga medgivande. Handelsbanken ansvarar inte för att materialet används på ett sätt som strider mot förbudet mot vidarebefordran eller offentliggörs i strid med bankens regler.


Market is starting to take US/Iran headlines with a pinch of salt. Brent crude rose $2.8/b yesterday to an official close of $112.1/b. But after that it traded as low as $108.05/b before ending late night at around $109.7/b. Through the day it traded in a range of $106.87 – 112.72/b amid a flurry of news or rumors from Iran and the US. ”US temporary sanctions during negotiations” (falls alarm). ”We will bomb Iran” (not anyhow),… etc. While the market is still fluctuating to this kind of news flow, it is starting to take such headlines with a pinch of salt.

We’ll see. Maybe, maybe not. The Brent M1 contract is trading at $110.2/b this morning which very close to the average ticks through yesterday of $110.4/b.
Trump with bearish, verbal intervention whenever Brent trades above $110/b it seems. What seems to be a pattern is that Trump states something like ”very good negotiations going on with Iran”, ”New leaders in Iran are great,..”, ”Great progress in negotiations,…”, ”Deal in sight,..” etc whenever the Brent M1 contract trades above $110/b. An effort to cool the market. These hot air verbal interventions from Trump used to have a heavy bearish impact on prices, but they now seems to have less and less effect unless they are backed by reality.
As far as we can see there has been no real progress in the negotiations between the US and Iran with both sides still standing by their previous demands.
Iran is getting stronger while the cease fire lasts making a return to war for Trump yet harder. Iran is naturally in constant preparation for a return to war given Trump’s steady threats of bombing Iran again. Iran is naturally doing what ever is possible to prepare for a return to war. And every day the cease fire lasts it is better prepared. This naturally makes it more and more difficult and dangerous for the US to return to warring activity versus Iran as the consequences for energy infrastructure in the Persian Gulf will be more and more severe the longer the cease fire lasts. Israel seems to see it this way as well. That the war is not won and that current frozen state of a cease fire gives Iran opportunity to rebuild military and politically.
Global inventories are drawing down day by day. How much? In the meantime the Strait of Hormuz stays closed. There is varying measures and estimates of how much global inventories are drawing down. Our rough estimate, back of the envelope, is that global inventories are drawing down by at least some 10 mb/d or about 300 mb/d in a balance between loss of supply versus demand destruction. Other estimates we see are a monthly draw of 250-270 mb/d. The IEA only ’measured’ a draw in global observable stocks of 117 mb in April with oil on water rising 53 mb while on shore stocks fell 170 mb. But global stocks are hard to measure with large invisible, unmeasured stocks. As such a back of the envelope approach may be better.
Oil products is what the world is consuming. Oil product prices likely to rise while product stocks fall. Strategic Petroleum Reserves (SPR) are predominantly crude oil. Discharging oil from OECD SPR stocks, a sharp reduction in Chinese crude imports and a reduction in global refinery throughput of 6-7 mb/d has helped to keep crude oil markets satisfactorily supplied. But global inventories are drawing down none the less. And oil products is really what the world is consuming. So if global refinery throughput stays subdued, then demand will eventually have to match the supply of oil products. The likely path forward this summer is a steady draw down in jet fuel, diesel and gasoline. Higher prices for these. Then, if possible, higher refinery throughput and higher usage of crude in response to very profitable refinery margins. And lastly sharper draw in crude stocks and higher prices for these. But some 6 mb/d of oil products used to be exported through the Strait of Hormuz. And it may not be so easy to ramp up refinery activity across the world to compensate. Especially as Ukraine continues to damage Russian refineries as well as Russian crude production and export facilities.
Watch oil product stocks and prices as well as Brent calendar 2027. What to watch for this summer is thus oil product inventories falling and oil product premiums to crude rising. Another measure to watch is the Brent crude 2027 contract as it rises steadily day by day as the Strait of Hormuz stays closed and global oil inventories decline. The latter is close to the highest level since the start of the war and keeps rising.
The Brent M1 contract and the Brent 2027 prices and current price of jet fuel in Europe (ARA). All in USD/b

Our back of the envelope calculation of the global shortage created by the closure of the Strait of Hormuz. Note that 3.5 mb/d of discharge from SPR is also a draw. Note also that ’Forced demand loss’ of 2.5 mb/d is probably temporary and will fall back towards zero as logistics are sorted out leaving ’Price demand loss’ to do the job of balancing the market. Thus a shortfall of at least 9 mb/d created by the closure. More if SPR discharge is included and more if Forced demand loss recedes.

Brent is climbing higher. Front-month is at USD 106.3/bl this morning, close to a weekly high and a USD 9/bl jump from Mondays open. This is the move we flagged as a risk earlier in the week: the market shifting from ”a deal is around the corner” to ”this is going to take longer than we thought”.

Analyst Commodities, SEB
During April, rest-of-year Brent remained remarkably stable around USD 90/bl. A stability which rested on one single assumption: the SoH reopens around 1 May. That assumption is now slowly falling apart.
As we highlighted yesterday: every week of delay beyond 1 May adds (theoretically) ish USD 5/bl to the rest-of-year average, as global inventories draw 100 million barrels per week. i.e., a mid-May reopening implies rest-of-year Brent closer to USD 100/bl, and anything pushing into June or July takes us meaningfully higher.
What’s changed in the last 48 hours:
#1: The US military has formally warned that clearing suspected sea mines from SoH could take up to six months. That is a completely different timescale from what the financial market is pricing. Even a political deal tomorrow does not immediately reopen the strait.
#2: Trump has shifted his tone from urgency to ”strategic patience”. In yesterday’s press conference: ”Don’t rush me… I want a great deal.” The market is reading this as a president no longer feeling pressured by timelines, with the naval blockade running in the background.
#3: So far, the military activity is escalating, not de-escalating. Axios reports Iran is laying more mines in SoH. The US 3rd carrier strike group (USS George H.W. Bush) is arriving with two countermine vessels. Trump yesterday ordered the US Navy to destroy any Iranian boats caught laying mines. While CNN reports that the Pentagon is actively drawing up plans to strike Iranian SoH capabilities and individual Iranian military leaders if the ceasefire collapses. i.e., NOT a attitude consistent with an imminent deal!
Spot crude and product prices eased off the early-April highs on a combination of system rerouting and deal optimism. Both now weakening. Goldman estimates April Gulf output is reduced by 14.5 mbl/d, or 57% of pre-war supply, a number that keeps getting worse the longer this drags on.
Demand-side adaptation is ongoing: S. Korea has cut its Middle East crude dependence from 69% to 56% by pulling more from the Americas and Africa, and Japan is kicking off a second round of SPR releases from 1 May. But SPRs are finite.
Ref. to the negotiations, we should not bet on speed. The current Iranian leadership is dominated by genuine hardliners willing to absorb economic pain and run the clock to extract concessions. That is not a setup for a rapid resolution. US/Israeli media briefings keep framing the delay as ”internal Iranian divisions”, the reality is more complicated and points toward weeks and months, not days.
Our point is that the complexity is large, and higher prices have only just started (given a scenario where the negotiations drag out in time). The market spent April leaning on the USD 90/bl rest-of-year assumption; that case is diminishing by the hour. If ”early May reopening” is replaced by ”June, July or later” over the next week or two, both crude and products have meaningful room to reprice higher from here. There is a high risk being short energy and betting on any immediate political resolution(!).
Down on Friday. Up on Monday. The Brent June crude oil contract traded down 5.1% last week to a close of $90.38/b. It reached a high of $103.87/b last Monday and a low of $86.09/b on Friday as Iran announced that the Strait of Hormuz was fully open for transit. That quickly changed over the weekend as the US upheld its blockade of Iranian oil exports while Iran naturally responded by closing the SoH again. The US blew a hole in the engine room of the Iranian ship TOUSKA and took custody of the ship on Sunday. Brent crude is up 5.6% this morning to $95.4/b.
The cease-fire is expiring tomorrow. The US has said it will send a delegation for a second round of negotiations in Islamabad in Pakistan. But Iran has for now rejected a second round of talks as it views US demands as unrealistic and excessive while the US is also blocking the Strait of Hormuz.
While Brent is up 5% this morning, the financial market is still very optimistic that progress will be made. That talks will continue and that the SoH will fully open by the start of May which is consistent with a rest-of-year average Brent crude oil price of around $90/b with the market now trading that balance at around $88/b.
Financial optimism vs. physical deterioration. We have a divergence where the financial market is trading negotiations, improvements and resolution while at the same time the physical market is deteriorating day by day. Physical oil flows remain constrained by disrupted flows, longer voyage times and elevated freight and insurance costs.
Financial markets are betting that a US/Iranian resolution will save us in time from violent shortages down the road. But every day that the SoH remains closed is bringing us closer to a potentially very painful point of shortages and much higher prices.
The US blockade is also a weapon of leverage against its European and Asian allies. When Iran closed the SoH it held the world economy as a hostage against the US. The US blockade of the SoH is of course blocking Iranian oil exports. But it is also an action of disruption directed towards Europe and Asia. The US has called for the rest of the world to engaged in the war with Iran: ”If you want oil from the Persian Gulf, then go and get it”. A risk is that the US plays brinkmanship with the global oil market directed towards its European and Asian allies and maybe even towards China to force them to engage and take part. Maybe unthinkable. But unthinkable has become the norm with Trump in the White House.


Sommarväder skapar prisrally på elbörsen
Oil product price pain is set to rise as the Strait of Hormuz stays closed into summer

Solkraften pressar elpriserna dagtid

Michel Gubel ger sin syn på oljemarknaden