Analys
SHB Råvarubrevet 26 oktober 2012
 Bättre data från Kina gläder
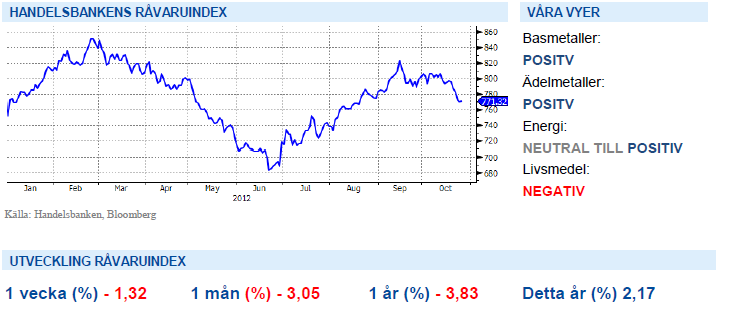
Det senaste rallyt i råvaror har främst skett i bas- och ädelmetaller. Den sista raketen var Kinas infrastrukturpaket den 7e september och QE3 i USA den 14e september. Därefter har åter oro för Europas skuldkris och sämre än väntat bolagsrapporter för Q3 tyngt marknaden. Dåliga nyheter har fört tillbaka metallerna till samma nivåer som före Kinas infrastrukturprogram. Så i princip hela QE3 effekten är nu utraderad.
Under de två senaste veckorna har dock data från Kina varit bra. Industriproduktionen har vänt upp, likaså huspriserna och försäljningen i konsumentledet. Investeringarna ökar återigen och HSBC:s preliminära inköpschefsindex för oktober visade på en ökning i onsdags. Vi tror därför att de senaste nedgångarna har gått för långt och att råvaror, men främst metaller åter kommer stiga under slutet av året. Nästa vecka (1:a nov kl 02.00) kommer Kinas officiella inköpschefsindex och vi tror att det är rimligt att indexet stiger upp över 50 som är gränsen för tillväxt i ekonomin. Ytterligare stöd kan också komma från USA:s inköpschefsindex som kommer samma dag som Kina men kl 15.00 svensk tid.
Efter en ny vecka med blandade makrosignaler är vi någonstans mellan neutrala till positiva till risksentimentet. Riskrallyt drivet av QE3 förstärker makro, speciellt i USA men förväntningarna på den globala återhämningen har skruvats ner de senaste veckorna, kanske för mycket och det finns möjlighet till positiva överraskningar i närtid. Vi tror att valet i USA och ledarskiftet i Kina plus rapport säsongen håller uppe riskviljan de kommande veckorna. Valet i USA tar bort fiscal cliff diskussionen ur fokus vilket är positivt för riskviljan.
Basmetallerna har åter vänt uppåt efter sitt fall på 6,5 % från toppen i september, vi byter därför fot från neutral till något positivare igen. Råoljan fortsätter handlas i sitt intervall mellan 109 och 117 och vi tycker att fundamenta är väl balanserat och motiverar att vara neutral. Även el, som vi hoppas på inför vintern med nedpressade förväntningar ligger kvar i sitt intervall och vi väntar fortfarande på rätt köpläge. Håll dock el under bevakning, vintern närmar sig och därmed riskerna. El är volatil och när det vänder upp går det snabbt.
Basmetallerna
Basmetallerna – en besvikelse
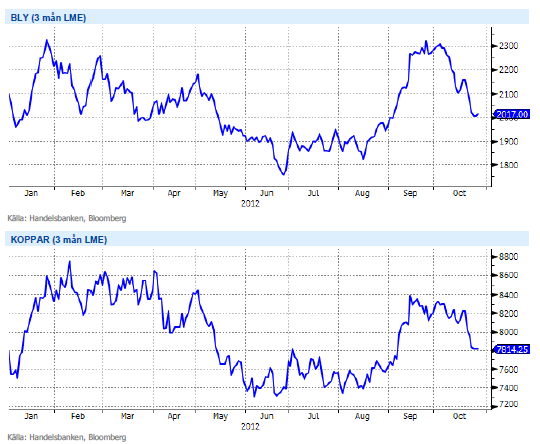
För basmetallerna har veckan varit en besvikelse. Aluminium har klarat sig bäst, relativt sett, med en nedgång på 1.4 %. Bly fick däremot mer stryk, med en nedgång på hela 4.6 %. Koppar, zink och nickel har tappat mellan 2 och 4 %. Nedgången kan till viss del förklaras med en starkare dollar men även ett svagare risksentiment bidrog.
Ser vi specifikt till koppar så verkar nedgången mildrats av låga lagernivåer (de lägsta sedan april 2008) och en något ökad efterfrågan (upp 5.7% sedan augusti). Vi är fortsatt positiva till basmetaller eftersom vi ser förnyade investeringar från Kina samt en något bättre global konjunktur.
Efter en tid med fallande priser på basmetaller är vi åter positiva. Vi tror på: BASMET H
Ädelmetaller
Priset på platinum rasar
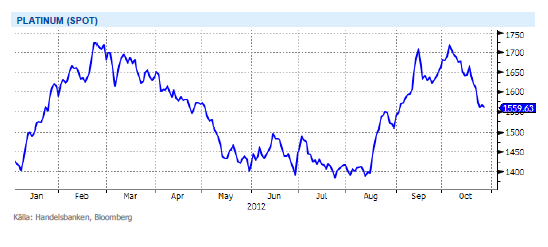
Guldet handlas i skrivande stund på 1714 USD/uns, vilket är marginellt lägre än veckans öppning. Platinum fortsätter sin väg ned, från toppnivån i början av oktober då platinum priset handlades på 1717 USD/uns har metallen tappat 9,3 % av sitt värde till 1559 USD/uns. Efter arbetarna vid platinumgruvan i Sydafrika har återvänt till arbete (efter en lönehöjning på hela 22 %) ser situationen på utbudssidan allt ljusare ut.
Däremot har guldgruvorna fortsatta problem och processen att avskeda 20 000 arbetare har startat. Gold Fields har avskedat 8 500 arbetare som inte återvänt från strejk trots ställt ultimatum och fler lär få samma besked vid andra guldgruvor om strejken fortsätter. Produktionsbortfallet på grund av strejkerna motsvarar nu 0,3 % av Sydafrikas BNP.
Vi fortsätter att se centralbankernas nytryckta pengar och framförallt Feds QE3 operation som starkt skäl att vara investerad i ädelmetallerna. Konflikterna i Sydafrika fortsätter och ger stöd åt och guldpriset. Vi tror på: ADELMET H
Energi
Priset på både olja och el faller
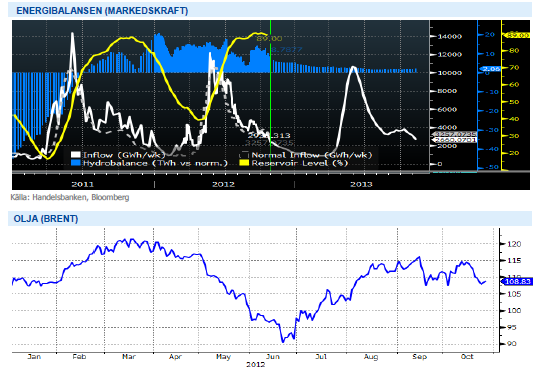
Oljepriset (Brent) föll i början av veckan men återhämtade sig något mot slutet och handlas under fredag eftermiddag på 109 USD/fat,vilket är 1 % lägre än samma tid förra veckan. Mindre risktagande i väntan på det amerikanska valet och höga spanska räntor tynger oljan. Översvämningar och infrastuktur sabotage i Nigeria ger dock stöd. Shell meddelade force majeure för export på ca 0,4 miljoner fat/ dag i oktober. Amerikansk lagerdata visar på lageruppbyggnad, lager på råoljan kom in på på 5,9 miljoner fat mot förväntade 1,9 miljoner fat.
Elmarknaden och kvartalskontraktet Q1 2013 backar närmare 3 procent till 41.35 euro under veckan till följd av ett väderomslag samtidigt som både kol och tyska elpriser försvagas. Om vi börjar med vädret så försvinner en del kylan i slutet av 10-dagarsprognosen och vi ser ut att få temperaturer på ca 2 grader under normalt (att jämföra med 5 grader kallare under normalt i början av veckan) samtidigt som vi förväntas få någon TWh nederbörd över normalt. Energibalansen borde således förbättras något till en ca +8TWh (se nedan). Kol och CO2 backar med 2 respektive 3 procent vilket gör att brytpriset för kol, dvs marginalen för kolgenererad kraft, landar strax under 37 euro vilket naturligtvis också tynger utvecklingen denna vecka. Bör finnas utrymme för ytterligare någon euro på nedsidan om den våta och varma avslutningen ligger kvar på väderprognoserna.
Oljan har sett allt svagare ut och vi fortsätter tycka att underliggande fundamenta är väl balanserad. El börjar se intressant ut inför vintern då riskerna på elmarknaden tilltar men vi låter sektorsynen vara neutral till positiv.
Livsmedel
Regn behövs i USA – inte i Europa
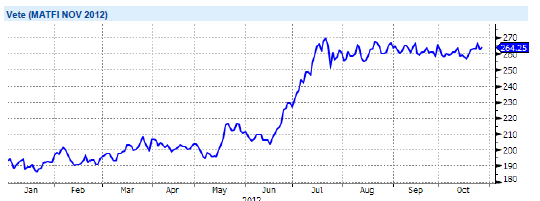
Terminspriser på vete är i stort sett oförändrade sedan förra veckan i både Chicago och Paris. Än behövs det mer regn på det nysådda höstvetet i USA, en del småskurar då och då lindrar dock situationen något. Även i Australien är det mestadels torrt för vetet, endast små regnmängder har fallit i de östra delarna av landet – längst i norr har skörden redan startat och avkastningsnivåerna sägs vara en klar besvikelse.
I Europa har det regnat lite väl mycket i de västra delarna, vilket fördröjer sådden i bland annat Frankrike och Storbritannien. I Frankrike är sådden nu bara klar till omkring 20 procent, att jämföra med 50 procent vid samma tid förra året – vilket lär leda till något mindre höstsådd areal. I Argentina är det fortfarande blött vilket försenar skördearbetet, bara omkring 4 procent av skörden bedöms nu vara klar. Helt klart kommer även kvalitetsnivån på vetet påverkas negativt av den blöta väderleken.
Väldigt mycket negativt är nu inprisat i dagens nivå och vi förväntar oss viss svårighet för priserna att nå så mycket högre. Långsiktigt är det svårt att se varför dagens nära rekordhöga priser ska hålla i sig – även om väldigt mycket kan hända till dess.
Vi ser soja, majs och vete som klara säljcase där vi väntar oss prisfall före jul men senast till påsk. Vi tror på: LIVSMEDEL S H
Handelsbankens Råvaruindex
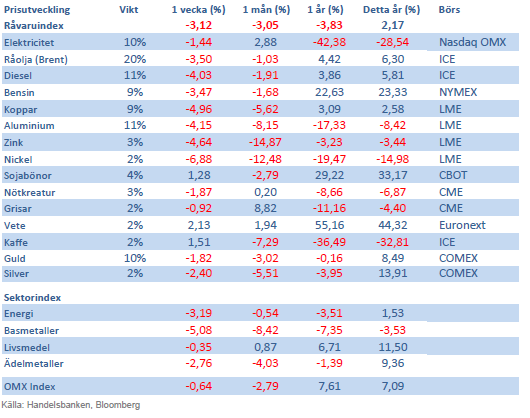
Handelsbankens råvaruindex består av de underliggande indexen för respektive råvara. Vikterna är bestämda till hälften från värdet av global produktion och till hälften från likviditeten i terminskontrakten.
[box]SHB Råvarubrevet är producerat av Handelsbanken och publiceras i samarbete och med tillstånd på Råvarumarknaden.se[/box]
Ansvarsbegränsning
Detta material är producerat av Svenska Handelsbanken AB (publ) i fortsättningen kallad Handelsbanken. De som arbetar med innehållet är inte analytiker och materialet är inte oberoende investeringsanalys. Innehållet är uteslutande avsett för kunder i Sverige. Syftet är att ge en allmän information till Handelsbankens kunder och utgör inte ett personligt investeringsråd eller en personlig rekommendation. Informationen ska inte ensamt utgöra underlag för investeringsbeslut. Kunder bör inhämta råd från sina rådgivare och basera sina investeringsbeslut utifrån egen erfarenhet.
Informationen i materialet kan ändras och också avvika från de åsikter som uttrycks i oberoende investeringsanalyser från Handelsbanken. Informationen grundar sig på allmänt tillgänglig information och är hämtad från källor som bedöms som tillförlitliga, men riktigheten kan inte garanteras och informationen kan vara ofullständig eller nedkortad. Ingen del av förslaget får reproduceras eller distribueras till någon annan person utan att Handelsbanken dessförinnan lämnat sitt skriftliga medgivande. Handelsbanken ansvarar inte för att materialet används på ett sätt som strider mot förbudet mot vidarebefordran eller offentliggörs i strid med bankens regler.
Analys
Tightening fundamentals – bullish inventories from DOE

The latest weekly report from the US DOE showed a substantial drawdown across key petroleum categories, adding more upside potential to the fundamental picture.

Commercial crude inventories (excl. SPR) fell by 5.8 million barrels, bringing total inventories down to 415.1 million barrels. Now sitting 11% below the five-year seasonal norm and placed in the lowest 2015-2022 range (see picture below).
Product inventories also tightened further last week. Gasoline inventories declined by 2.1 million barrels, with reductions seen in both finished gasoline and blending components. Current gasoline levels are about 3% below the five-year average for this time of year.
Among products, the most notable move came in diesel, where inventories dropped by almost 4.1 million barrels, deepening the deficit to around 20% below seasonal norms – continuing to underscore the persistent supply tightness in diesel markets.
The only area of inventory growth was in propane/propylene, which posted a significant 5.1-million-barrel build and now stands 9% above the five-year average.
Total commercial petroleum inventories (crude plus refined products) declined by 4.2 million barrels on the week, reinforcing the overall tightening of US crude and products.


Analys
Bombs to ”ceasefire” in hours – Brent below $70

A classic case of “buy the rumor, sell the news” played out in oil markets, as Brent crude has dropped sharply – down nearly USD 10 per barrel since yesterday evening – following Iran’s retaliatory strike on a U.S. air base in Qatar. The immediate reaction was: “That was it?” The strike followed a carefully calibrated, non-escalatory playbook, avoiding direct threats to energy infrastructure or disruption of shipping through the Strait of Hormuz – thus calming worst-case fears.

After Monday morning’s sharp spike to USD 81.4 per barrel, triggered by the U.S. bombing of Iranian nuclear facilities, oil prices drifted sideways in anticipation of a potential Iranian response. That response came with advance warning and caused limited physical damage. Early this morning, both the U.S. President and Iranian state media announced a ceasefire, effectively placing a lid on the immediate conflict risk – at least for now.
As a result, Brent crude has now fallen by a total of USD 12 from Monday’s peak, currently trading around USD 69 per barrel.
Looking beyond geopolitics, the market will now shift its focus to the upcoming OPEC+ meeting in early July. Saudi Arabia’s decision to increase output earlier this year – despite falling prices – has drawn renewed attention considering recent developments. Some suggest this was a response to U.S. pressure to offset potential Iranian supply losses.
However, consensus is that the move was driven more by internal OPEC+ dynamics. After years of curbing production to support prices, Riyadh had grown frustrated with quota-busting by several members (notably Kazakhstan). With Saudi Arabia cutting up to 2 million barrels per day – roughly 2% of global supply – returns were diminishing, and the risk of losing market share was rising. The production increase is widely seen as an effort to reassert leadership and restore discipline within the group.
That said, the FT recently stated that, the Saudis remain wary of past missteps. In 2018, Riyadh ramped up output at Trump’s request ahead of Iran sanctions, only to see prices collapse when the U.S. granted broad waivers – triggering oversupply. Officials have reportedly made it clear they don’t intend to repeat that mistake.
The recent visit by President Trump to Saudi Arabia, which included agreements on AI, defense, and nuclear cooperation, suggests a broader strategic alignment. This has fueled speculation about a quiet “pump-for-politics” deal behind recent production moves.
Looking ahead, oil prices have now retraced the entire rally sparked by the June 13 Israel–Iran escalation. This retreat provides more political and policy space for both the U.S. and Saudi Arabia. Specifically, it makes it easier for Riyadh to scale back its three recent production hikes of 411,000 barrels each, potentially returning to more moderate increases of 137,000 barrels for August and September.
In short: with no major loss of Iranian supply to the market, OPEC+ – led by Saudi Arabia – no longer needs to compensate for a disruption that hasn’t materialized, especially not to please the U.S. at the cost of its own market strategy. As the Saudis themselves have signaled, they are unlikely to repeat previous mistakes.
Conclusion: With Brent now in the high USD 60s, buying oil looks fundamentally justified. The geopolitical premium has deflated, but tensions between Israel and Iran remain unresolved – and the risk of missteps and renewed escalation still lingers. In fact, even this morning, reports have emerged of renewed missile fire despite the declared “truce.” The path forward may be calmer – but it is far from stable.
Analys
A muted price reaction. Market looks relaxed, but it is still on edge waiting for what Iran will do

Brent crossed the 80-line this morning but quickly fell back assigning limited probability for Iran choosing to close the Strait of Hormuz. Brent traded in a range of USD 70.56 – 79.04/b last week as the market fluctuated between ”Iran wants a deal” and ”US is about to attack Iran”. At the end of the week though, Donald Trump managed to convince markets (and probably also Iran) that he would make a decision within two weeks. I.e. no imminent attack. Previously when when he has talked about ”making a decision within two weeks” he has often ended up doing nothing in the end. The oil market relaxed as a result and the week ended at USD 77.01/b which is just USD 6/b above the year to date average of USD 71/b.

Brent jumped to USD 81.4/b this morning, the highest since mid-January, but then quickly fell back to a current price of USD 78.2/b which is only up 1.5% versus the close on Friday. As such the market is pricing a fairly low probability that Iran will actually close the Strait of Hormuz. Probably because it will hurt Iranian oil exports as well as the global oil market.
It was however all smoke and mirrors. Deception. The US attacked Iran on Saturday. The attack involved 125 warplanes, submarines and surface warships and 14 bunker buster bombs were dropped on Iranian nuclear sites including Fordow, Natanz and Isfahan. In response the Iranian Parliament voted in support of closing the Strait of Hormuz where some 17 mb of crude and products is transported to the global market every day plus significant volumes of LNG. This is however merely an advise to the Supreme leader Ayatollah Ali Khamenei and the Supreme National Security Council which sits with the final and actual decision.
No supply of oil is lost yet. It is about the risk of Iran closing the Strait of Hormuz or not. So far not a single drop of oil supply has been lost to the global market. The price at the moment is all about the assessed risk of loss of supply. Will Iran choose to choke of the Strait of Hormuz or not? That is the big question. It would be painful for US consumers, for Donald Trump’s voter base, for the global economy but also for Iran and its population which relies on oil exports and income from selling oil out of that Strait as well. As such it is not a no-brainer choice for Iran to close the Strait for oil exports. And looking at the il price this morning it is clear that the oil market doesn’t assign a very high probability of it happening. It is however probably well within the capability of Iran to close the Strait off with rockets, mines, air-drones and possibly sea-drones. Just look at how Ukraine has been able to control and damage the Russian Black Sea fleet.
What to do about the highly enriched uranium which has gone missing? While the US and Israel can celebrate their destruction of Iranian nuclear facilities they are also scratching their heads over what to do with the lost Iranian nuclear material. Iran had 408 kg of highly enriched uranium (IAEA). Almost weapons grade. Enough for some 10 nuclear warheads. It seems to have been transported out of Fordow before the attack this weekend.
The market is still on edge. USD 80-something/b seems sensible while we wait. The oil market reaction to this weekend’s events is very muted so far. The market is still on edge awaiting what Iran will do. Because Iran will do something. But what and when? An oil price of 80-something seems like a sensible level until something do happen.
-

 Nyheter4 veckor sedan
Stor uppsida i Lappland Guldprospekterings aktie enligt analys
-

 Nyheter4 veckor sedan
Silverpriset släpar efter guldets utveckling, har mer uppsida
-

 Nyheter3 veckor sedan
Uppgången i oljepriset planade ut under helgen
-

 Nyheter3 veckor sedan
Låga elpriser i sommar – men mellersta Sverige får en ökning
-

 Nyheter2 veckor sedan
Mahvie Minerals växlar spår – satsar fullt ut på guld
-

 Analys3 veckor sedan
Very relaxed at USD 75/b. Risk barometer will likely fluctuate to higher levels with Brent into the 80ies or higher coming 2-3 weeks
-

 Nyheter1 vecka sedan
Oljan, guldet och marknadens oroande tystnad
-

 Nyheter1 vecka sedan
Jonas Lindvall är tillbaka med ett nytt oljebolag, Perthro, som ska börsnoteras


