

Analys
SHB Råvarubrevet 25 januari 2013
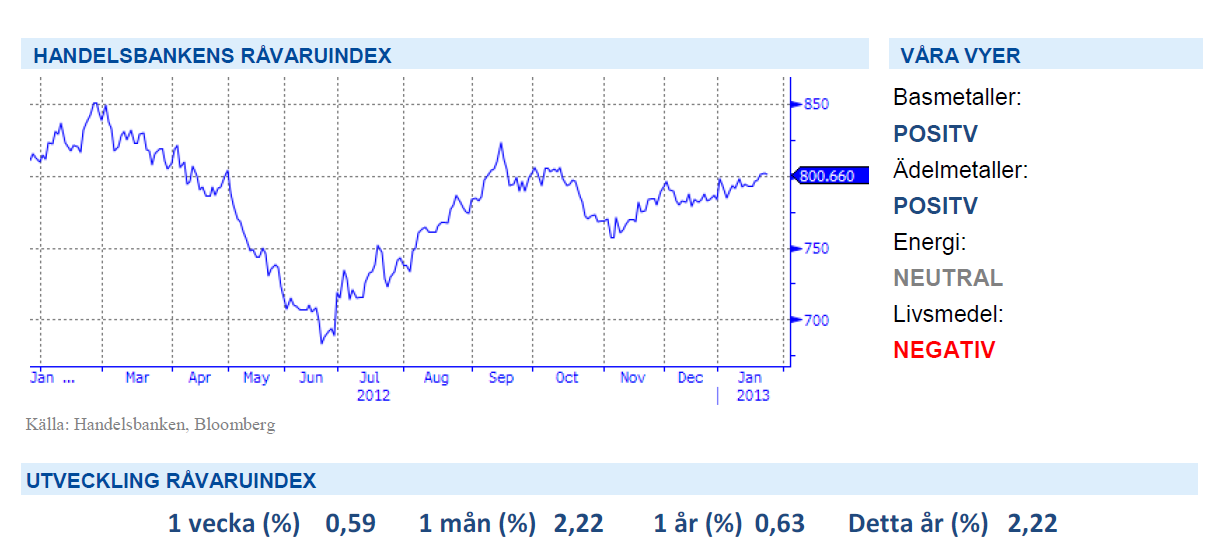
 Nyårsrallyt har planat ut
Senaste veckan har inte givit mycket nytt. Rallyt som inledde året har kommit av sig. Många råvaror har fastnat mellan en allt ljusare framtidsbild med starkare global konjunktur och en allt stabilare produktionssida. Det gäller såväl råolja som basmetaller. Valet i Israel gav inte ”Beni” Netanyahu den jordskredsseger han tänkt och nu behöver hans högerparti bilda koalitionsregering. Att israelisk politik kommer söka sig mot mitten är på marginalen negativt för brentpriset som har en riskpremie pga. Israels krigsvilja mot Iran som nu minskar något.
Under veckan kom storbanken HSBC:s preliminära inköpschefsindex för Kina in bättre än väntat på 24 månaders högsta, 51,9 upp från 51,5 i december. Den kinesiska återhämtningen fortsätter alltså och vi manar till is i magen för de som undrar varför inte basmetallerna följer med uppåt.
I USA har representanthuset röstat igenom en tillfällig höjning av skuldtaket fram till 19 maj, vilket ger något andrum i den politiska soppan. Därmed har politikerna köpt sig mer tid för att lösa budgetunderskotten, men tuffa förhandlingar kvarstår. Våren består av en hel del olika deadlines att förhålla sig till. Bland annat den 15 april; om beslut om ny budget saknas, står politikerna utan lön framtill 2014.
Basmetallerna
Basmetallerna stärks
Vårt basmetallindex steg med någon procent och det är främst aluminium och bly som varit i fokus. Blypriset är upp över 4 procent på förväntningar om en fortsatt robust efterfrågan från batteritillverkare framför allt i Kina (ca 85% av allt bly går till batterier och Kina står för 45% av global efterfrågan, den inhemska konsumtionen steg med 27% under 2012). Vikande lager på såväl aluminium som koppar ger stöd åt priserna.
Vi har i veckan träffat några Nordeuropeiska metallhandlare som vittnar om ökade orderingångar från tillväxtmarknaderna (främst Kina och Indien) vilket gör stöd åt vår tro på basmetallerna för det kommande kvartalet. I övrigt noterade World Steel Association färska produktionsdata för stålindustrin 2012 på 1.547miljarder ton (+1% YoY) vilket är rekord. Kina stod för 46.3% följt av Japan (7%), USA (5.7%).
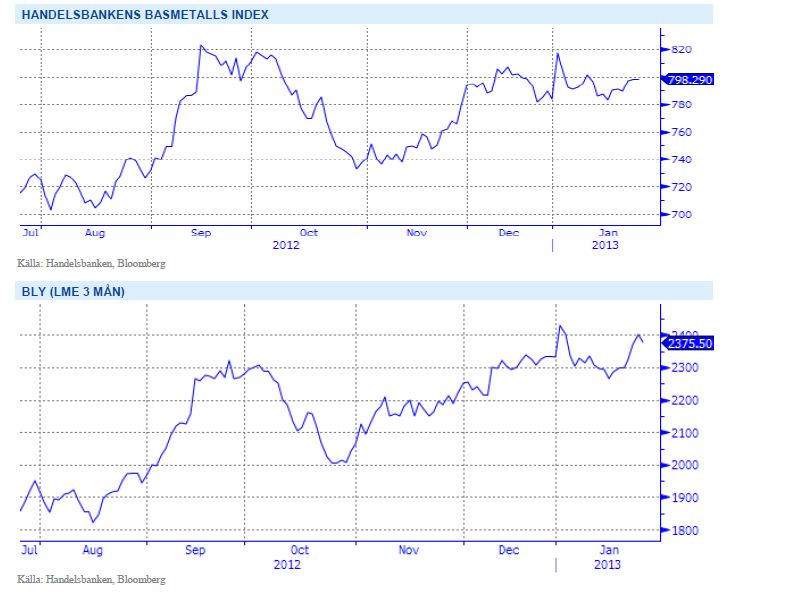
Med Kinas återhämtning i ryggen tror vi på stigande priser på basmetaller. Vi tror på: BASMET H
Ädelmetaller
Ökad riskaptit pressar ädelmetallerna
I och med att USA:s skuldtak lyfts tillfälligt har viss trygghet infunnits sig på marknaden och en ökad riskaptit pressar ädelmetallerna överlag. ETF-innehavet, som är en indikator på investerarflöden, på guld föll till den lägsta nivån på över 2-månader vilket fått guldet att backa med 25 dollar denna vecka trots att dollarn försvagats. Platinum och palladium håller dock emot bättre och stänger veckan på någon procent upp.
Vi förväntar oss dock ett fortsatt stöd för ädelmetallerna där låga räntor och stimulativa åtgärder spär på inflationsförväntningarna. Ett ökat intresse från tillväxtländernas centralbanker att hålla guld som säkerhet förväntas också ge stöd. Se nedan för guld/silver ration de senaste 5 åren.
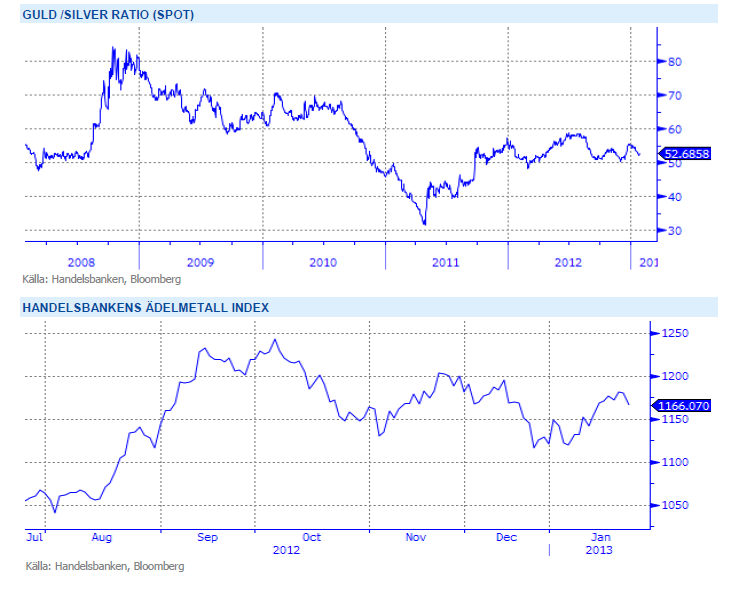
Inför 2013 är vi fortsatt positiva till ädelmetaller. Fortsatt mjuk penningpolitik, svag makroekonomi, starkare efterfrågan från Kina och Indien och att centralbanker i utvecklingsekonomier köper guld gör att vi tror på: ADELMET H
Energi
Välbalanserad fundamenta
Elmarknaden fortsätter ned och vi ändrar vår syn från sälj till neutral efter att Q2 13 försvagats mot en förväntad nivå strax över 35 euro (-5%, WoW) vilket är strax över brytpriset för kol. Utsläppsrätterna ned ytterligare 18.5 procent och förtroendet för marknaden raderas successivt ut. Inga större förändringar på kolmarknaden och energibalansen tappar någon TWh till -15 TWh. Ser vi till väderprognoserna ligger inga för marknaden dramatiska förväntningar för den kommande 10-dagarsperioden, normala temperaturer mot slutet och någon TWh nederbörd över normalt så räknar inte med några större rörelser de kommande dagarna.
Brent-oljan har stigit med 1,6 % under veckan och handlas nu på 113 USD/ton. Geopolitisk risk är återigen hög för oljemarknaden efter terrorattacken i Algeriet. Oron för angrepp på energianläggningar på andra platser har lett till ett kortsiktigt rally för oljepriset.
Vi närmar oss även februari där det normalt finns en stigande efterfråga jämfört med januari, då många fyllt på sina lager inför årsskiftet. Efterfrågan väntas stiga med 3 miljoner fat/dag från januari till februari.
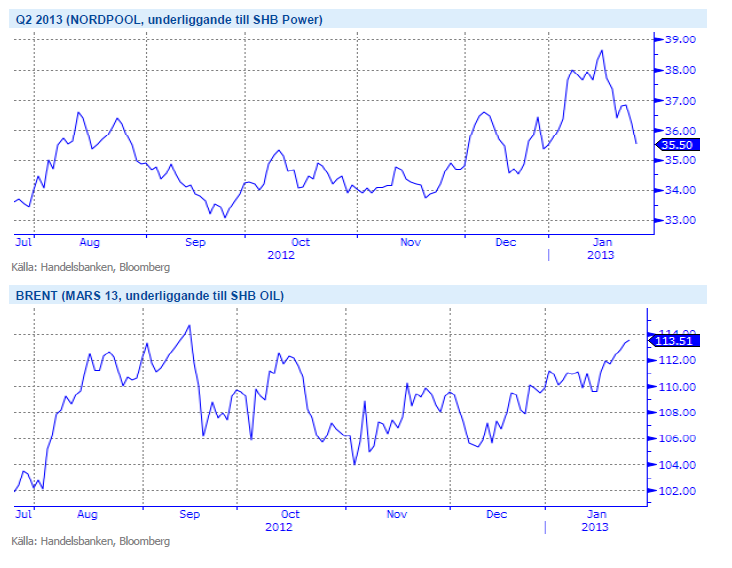
För både el- och oljemarknaden är underliggande fundamenta väl balanserad, därför håller vi en neutral syn på energisektorn.
Livsmedel
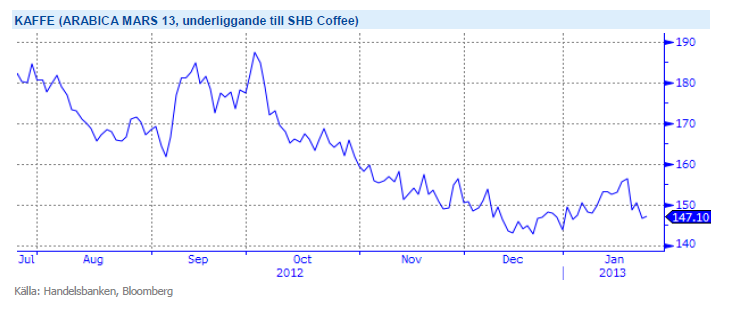
Fortsatt stora lager av kaffe pressar priset
Svampsjukdomen Roya fortsätter att spridas i de drabbade regionerna. 70 procent av Guatemalas 274 000 hektar av kaffeplantor är skadat och landet riskerar att förlora en tredje del av sin skörd. Förstörelserna ser ut att vara mer omfattande än man beräknat. Detta har varit orsaken till att kaffepriset stigit 8-9 procent under årets första veckor och backat 5-6 procent den senaste veckan efter rapporter om ökade lager av Robusta kaffe från Vietnam. Vi är positiva till SHB Coffee på kort sikt och tror att sämre skördar i Centralamerika, högre medeltemperatur och skyfall under normalen inte hunnit i kapp marknaden. Idag handlas terminen (frontkontraktet) under 1,50 dollar/Ib.
Terminspriserna på vete noteras ned något sedan förra veckan i både Chicago och Paris. En del regn har fallit på höstvetet i USA men mer behövs. Mer snö vore önskvärt i en del regioner men då temperaturen är klart över det normala för denna tid på året så är risken för utvintring liten, inga prognoser tyder för tillfället heller på kallare väder framöver. Klart är dock att det amerikanska höstvetet på flera håll ser ut att gå ur vintervilan i torr och varm väderlek, precis som vid ingången av vintern. I EU bedöms allt fortfarande vara helt ok, men i Australien är det väldigt varmt och torrt i stora områden, oron för detta är dock ganska begränsad då det är två månader kvar till sådd. Grödorna närmar sig ett känsligt utvecklingsstadium i flera viktiga spannmålsregioner och så länge risken för väderproblem inte känns mindre överhängande så bör en fortsatt prisnedgång bli ganska begränsad på kort sikt. Givet inga större väderproblem bör vi dock vänta oss fallande priser lite längre fram på året, veteproduktionen 2013 beräknas nå klart större volymer än 2012.
Vi ser fortfarande framför oss fallande priser på livsmedelsektor på lite längre sikt. Vi tror på: LIVSMEDEL S H
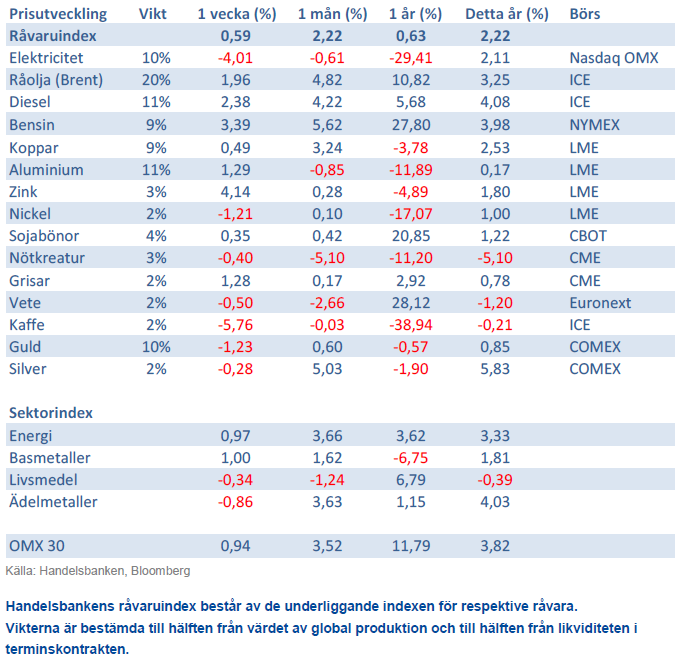
Handelsbankens Råvaruindex
[box]SHB Råvarubrevet är producerat av Handelsbanken och publiceras i samarbete och med tillstånd på Råvarumarknaden.se[/box]
Ansvarsbegränsning
Detta material är producerat av Svenska Handelsbanken AB (publ) i fortsättningen kallad Handelsbanken. De som arbetar med innehållet är inte analytiker och materialet är inte oberoende investeringsanalys. Innehållet är uteslutande avsett för kunder i Sverige. Syftet är att ge en allmän information till Handelsbankens kunder och utgör inte ett personligt investeringsråd eller en personlig rekommendation. Informationen ska inte ensamt utgöra underlag för investeringsbeslut. Kunder bör inhämta råd från sina rådgivare och basera sina investeringsbeslut utifrån egen erfarenhet.
Informationen i materialet kan ändras och också avvika från de åsikter som uttrycks i oberoende investeringsanalyser från Handelsbanken. Informationen grundar sig på allmänt tillgänglig information och är hämtad från källor som bedöms som tillförlitliga, men riktigheten kan inte garanteras och informationen kan vara ofullständig eller nedkortad. Ingen del av förslaget får reproduceras eller distribueras till någon annan person utan att Handelsbanken dessförinnan lämnat sitt skriftliga medgivande. Handelsbanken ansvarar inte för att materialet används på ett sätt som strider mot förbudet mot vidarebefordran eller offentliggörs i strid med bankens regler.


Market is starting to take US/Iran headlines with a pinch of salt. Brent crude rose $2.8/b yesterday to an official close of $112.1/b. But after that it traded as low as $108.05/b before ending late night at around $109.7/b. Through the day it traded in a range of $106.87 – 112.72/b amid a flurry of news or rumors from Iran and the US. ”US temporary sanctions during negotiations” (falls alarm). ”We will bomb Iran” (not anyhow),… etc. While the market is still fluctuating to this kind of news flow, it is starting to take such headlines with a pinch of salt.

We’ll see. Maybe, maybe not. The Brent M1 contract is trading at $110.2/b this morning which very close to the average ticks through yesterday of $110.4/b.
Trump with bearish, verbal intervention whenever Brent trades above $110/b it seems. What seems to be a pattern is that Trump states something like ”very good negotiations going on with Iran”, ”New leaders in Iran are great,..”, ”Great progress in negotiations,…”, ”Deal in sight,..” etc whenever the Brent M1 contract trades above $110/b. An effort to cool the market. These hot air verbal interventions from Trump used to have a heavy bearish impact on prices, but they now seems to have less and less effect unless they are backed by reality.
As far as we can see there has been no real progress in the negotiations between the US and Iran with both sides still standing by their previous demands.
Iran is getting stronger while the cease fire lasts making a return to war for Trump yet harder. Iran is naturally in constant preparation for a return to war given Trump’s steady threats of bombing Iran again. Iran is naturally doing what ever is possible to prepare for a return to war. And every day the cease fire lasts it is better prepared. This naturally makes it more and more difficult and dangerous for the US to return to warring activity versus Iran as the consequences for energy infrastructure in the Persian Gulf will be more and more severe the longer the cease fire lasts. Israel seems to see it this way as well. That the war is not won and that current frozen state of a cease fire gives Iran opportunity to rebuild military and politically.
Global inventories are drawing down day by day. How much? In the meantime the Strait of Hormuz stays closed. There is varying measures and estimates of how much global inventories are drawing down. Our rough estimate, back of the envelope, is that global inventories are drawing down by at least some 10 mb/d or about 300 mb/d in a balance between loss of supply versus demand destruction. Other estimates we see are a monthly draw of 250-270 mb/d. The IEA only ’measured’ a draw in global observable stocks of 117 mb in April with oil on water rising 53 mb while on shore stocks fell 170 mb. But global stocks are hard to measure with large invisible, unmeasured stocks. As such a back of the envelope approach may be better.
Oil products is what the world is consuming. Oil product prices likely to rise while product stocks fall. Strategic Petroleum Reserves (SPR) are predominantly crude oil. Discharging oil from OECD SPR stocks, a sharp reduction in Chinese crude imports and a reduction in global refinery throughput of 6-7 mb/d has helped to keep crude oil markets satisfactorily supplied. But global inventories are drawing down none the less. And oil products is really what the world is consuming. So if global refinery throughput stays subdued, then demand will eventually have to match the supply of oil products. The likely path forward this summer is a steady draw down in jet fuel, diesel and gasoline. Higher prices for these. Then, if possible, higher refinery throughput and higher usage of crude in response to very profitable refinery margins. And lastly sharper draw in crude stocks and higher prices for these. But some 6 mb/d of oil products used to be exported through the Strait of Hormuz. And it may not be so easy to ramp up refinery activity across the world to compensate. Especially as Ukraine continues to damage Russian refineries as well as Russian crude production and export facilities.
Watch oil product stocks and prices as well as Brent calendar 2027. What to watch for this summer is thus oil product inventories falling and oil product premiums to crude rising. Another measure to watch is the Brent crude 2027 contract as it rises steadily day by day as the Strait of Hormuz stays closed and global oil inventories decline. The latter is close to the highest level since the start of the war and keeps rising.
The Brent M1 contract and the Brent 2027 prices and current price of jet fuel in Europe (ARA). All in USD/b

Our back of the envelope calculation of the global shortage created by the closure of the Strait of Hormuz. Note that 3.5 mb/d of discharge from SPR is also a draw. Note also that ’Forced demand loss’ of 2.5 mb/d is probably temporary and will fall back towards zero as logistics are sorted out leaving ’Price demand loss’ to do the job of balancing the market. Thus a shortfall of at least 9 mb/d created by the closure. More if SPR discharge is included and more if Forced demand loss recedes.

Brent is climbing higher. Front-month is at USD 106.3/bl this morning, close to a weekly high and a USD 9/bl jump from Mondays open. This is the move we flagged as a risk earlier in the week: the market shifting from ”a deal is around the corner” to ”this is going to take longer than we thought”.

Analyst Commodities, SEB
During April, rest-of-year Brent remained remarkably stable around USD 90/bl. A stability which rested on one single assumption: the SoH reopens around 1 May. That assumption is now slowly falling apart.
As we highlighted yesterday: every week of delay beyond 1 May adds (theoretically) ish USD 5/bl to the rest-of-year average, as global inventories draw 100 million barrels per week. i.e., a mid-May reopening implies rest-of-year Brent closer to USD 100/bl, and anything pushing into June or July takes us meaningfully higher.
What’s changed in the last 48 hours:
#1: The US military has formally warned that clearing suspected sea mines from SoH could take up to six months. That is a completely different timescale from what the financial market is pricing. Even a political deal tomorrow does not immediately reopen the strait.
#2: Trump has shifted his tone from urgency to ”strategic patience”. In yesterday’s press conference: ”Don’t rush me… I want a great deal.” The market is reading this as a president no longer feeling pressured by timelines, with the naval blockade running in the background.
#3: So far, the military activity is escalating, not de-escalating. Axios reports Iran is laying more mines in SoH. The US 3rd carrier strike group (USS George H.W. Bush) is arriving with two countermine vessels. Trump yesterday ordered the US Navy to destroy any Iranian boats caught laying mines. While CNN reports that the Pentagon is actively drawing up plans to strike Iranian SoH capabilities and individual Iranian military leaders if the ceasefire collapses. i.e., NOT a attitude consistent with an imminent deal!
Spot crude and product prices eased off the early-April highs on a combination of system rerouting and deal optimism. Both now weakening. Goldman estimates April Gulf output is reduced by 14.5 mbl/d, or 57% of pre-war supply, a number that keeps getting worse the longer this drags on.
Demand-side adaptation is ongoing: S. Korea has cut its Middle East crude dependence from 69% to 56% by pulling more from the Americas and Africa, and Japan is kicking off a second round of SPR releases from 1 May. But SPRs are finite.
Ref. to the negotiations, we should not bet on speed. The current Iranian leadership is dominated by genuine hardliners willing to absorb economic pain and run the clock to extract concessions. That is not a setup for a rapid resolution. US/Israeli media briefings keep framing the delay as ”internal Iranian divisions”, the reality is more complicated and points toward weeks and months, not days.
Our point is that the complexity is large, and higher prices have only just started (given a scenario where the negotiations drag out in time). The market spent April leaning on the USD 90/bl rest-of-year assumption; that case is diminishing by the hour. If ”early May reopening” is replaced by ”June, July or later” over the next week or two, both crude and products have meaningful room to reprice higher from here. There is a high risk being short energy and betting on any immediate political resolution(!).
Down on Friday. Up on Monday. The Brent June crude oil contract traded down 5.1% last week to a close of $90.38/b. It reached a high of $103.87/b last Monday and a low of $86.09/b on Friday as Iran announced that the Strait of Hormuz was fully open for transit. That quickly changed over the weekend as the US upheld its blockade of Iranian oil exports while Iran naturally responded by closing the SoH again. The US blew a hole in the engine room of the Iranian ship TOUSKA and took custody of the ship on Sunday. Brent crude is up 5.6% this morning to $95.4/b.
The cease-fire is expiring tomorrow. The US has said it will send a delegation for a second round of negotiations in Islamabad in Pakistan. But Iran has for now rejected a second round of talks as it views US demands as unrealistic and excessive while the US is also blocking the Strait of Hormuz.
While Brent is up 5% this morning, the financial market is still very optimistic that progress will be made. That talks will continue and that the SoH will fully open by the start of May which is consistent with a rest-of-year average Brent crude oil price of around $90/b with the market now trading that balance at around $88/b.
Financial optimism vs. physical deterioration. We have a divergence where the financial market is trading negotiations, improvements and resolution while at the same time the physical market is deteriorating day by day. Physical oil flows remain constrained by disrupted flows, longer voyage times and elevated freight and insurance costs.
Financial markets are betting that a US/Iranian resolution will save us in time from violent shortages down the road. But every day that the SoH remains closed is bringing us closer to a potentially very painful point of shortages and much higher prices.
The US blockade is also a weapon of leverage against its European and Asian allies. When Iran closed the SoH it held the world economy as a hostage against the US. The US blockade of the SoH is of course blocking Iranian oil exports. But it is also an action of disruption directed towards Europe and Asia. The US has called for the rest of the world to engaged in the war with Iran: ”If you want oil from the Persian Gulf, then go and get it”. A risk is that the US plays brinkmanship with the global oil market directed towards its European and Asian allies and maybe even towards China to force them to engage and take part. Maybe unthinkable. But unthinkable has become the norm with Trump in the White House.


Sommarväder skapar prisrally på elbörsen
Oil product price pain is set to rise as the Strait of Hormuz stays closed into summer

Solkraften pressar elpriserna dagtid

Michel Gubel ger sin syn på oljemarknaden