

Analys
SHB Råvarubrevet 23 maj 2014

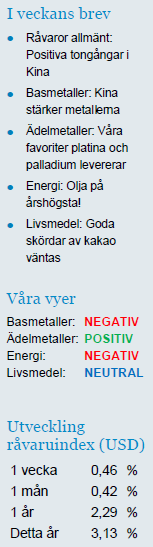 Råvaror allmänt: Positiva tongångar i Kina
Under veckan kom den preliminära inköpschefssiffran från Kina. En skräll där mer än halva fallet från senaste toppen under i Q4 2013 på 50,9 togs igen på bara en månad. Maj visade 49,7 mot 48,1 i april.
Marknaden hade väntat sig en liten ökning till 48,3. På marginalen minskar det rädslan för en hårdlandning i Kina för stunden. PMI siffran är dock endast en bland många indikatorer och den har rört sig i ett relativt snävt intervall under Kinas senaste inbromsning.
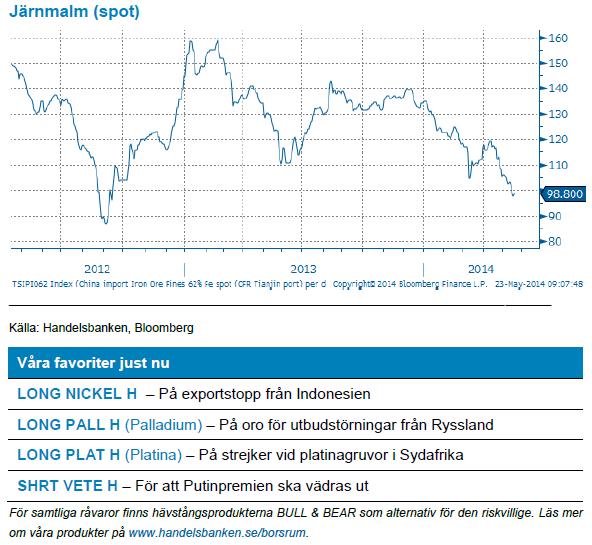
Järnmalm föll under det magiska 100 USD/ton strecket för första gången sedan september 2012, ett tecken på såväl Kinas inbromsning som den kommande strukturella prispressen från stigande produktion. Vi tror på ett järnmalmspris på 80 USD nästa år och dit har konsensus nu också kommit.
Basmetaller: Kina stärker metallerna
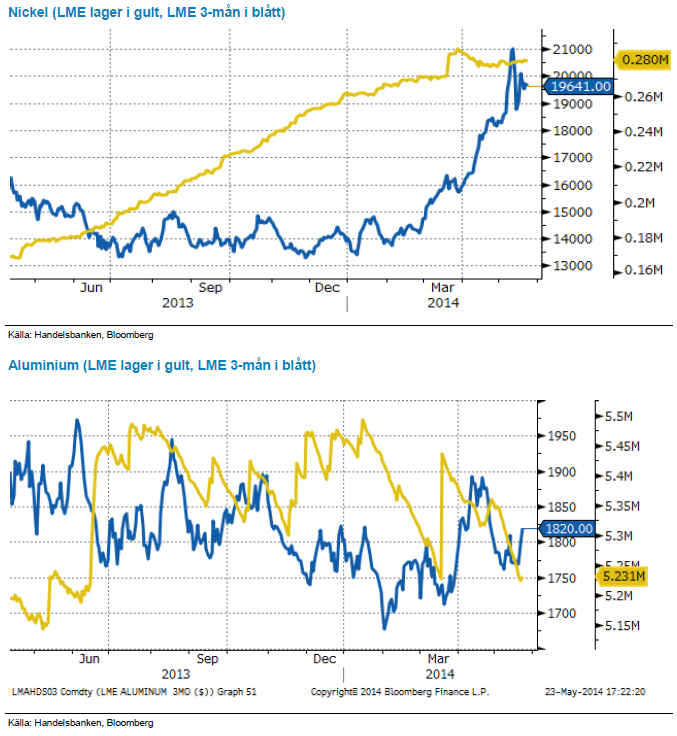
Veckans dragplåster från Kina vars preliminära PMI (inköpschefsindex) var överraskande positivt har gett stöd till samtliga basmetaller. Störst rörelser noterar vi återigen för nickel som steg 3,5% men även aluminium och koppar steg på Kina.
Aluminiumpriset har även fått stöd av fallande lager, LME:s lager av metallen har under veckan krympt med 14 % (20 % under maj). Nickel fortsätter handlas i tvära kast med stora rörelser varje dag. Trenden uppåt har dock klingat av och priset har stampat precis under 20 000 under några dagar. Vilda spekulationer och stora spekulativa positioner kring Indonesiens framtid som nickelproducent ligger bakom. Vi tror fortsatt att nickel har uppsida de kommande månaderna och tror att priset ”samlar kraft” efter tjurrusningen tidigare i maj.
Ädelmetaller: Våra favoriter platina och palladium levererar
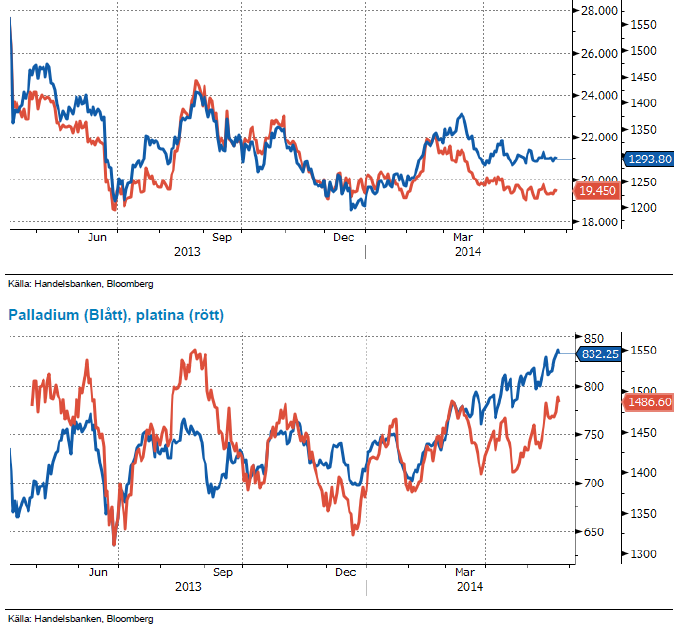
De två senaste veckorna har sett ädelmetallerna stiga i pris, framför allt våra favoriter platina och palladium, med 3,8 respektive 3,5 procent vardera. Guldet har stigit marginellt, men mot bakgrund av att dollarn stärkts under perioden måste vi tolka utvecklingen som ganska stark. Volatiliteten är däremot oerhört låg, och varken Fed-protokoll, ekonomisk statistik eller Ukraina-utvecklingen har kunnat skapa några större rörelser.
Vi är fortsatt positiva på ädelmetallerna, både baserat på att sektorn visat stark motståndskraft mot Feds tapering, och på utbudsrubbningar från Sydafrika. Det är värt att påpeka att marknadens konsensus* är negativt på guld, medan det är positivt för platina och palladium. Den som vill spela ”contrarian-spelet” foukserar därför främst på guldet, även om vi delar den mer positiva synen på de övriga två.
*enligt ENERGY & METALS CONSENSUS FORECASTS
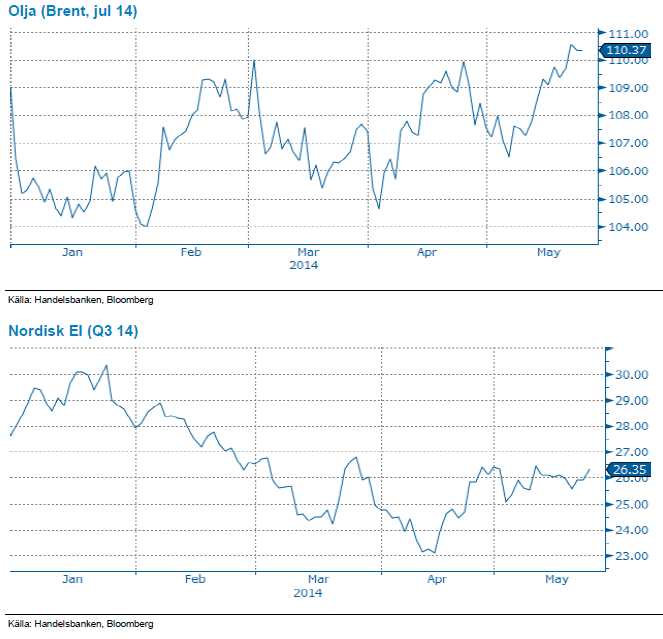
Energi: Olja på årshögsta!
Oljan har under veckan klättrat mot toppen av årets handelsrange och nådde årshögsta strax över 111 USD/ton. Geopolitisk oro är som vanligt den största drivkraften men även kraftigt fallande lager på råolja i USA har pressat upp priset. Spänningarna ökar inför presidentvalet i Ukraina på söndag. Putin försäkrar att Ryssland kommer respektera valutgången och stötta den valda presidenten, samtidigt fortsätter rapporterna om blodiga strider från området kring Donetsk. Fortsatt oroligt även i Libyen där parlamentsval väntas i juni. Vi ser att oljan nu handlas med en riskpremie som, när situationen förhoppningsvis stabiliseras, kommer pysa ut och med fallande oljepris som följd.
Elpriset, Q3-14, är relativt oförändrat över veckan. Det varma vädret har satt fart på snösmältningen men energibalansen visar ändå på underskott. Prognos för denna vecka på 5,4 TWh under normalen, detta att jämföras med förra veckans underskott på 7,6 TWh. Väderprognoserna visar på svalare temperaturer in till nästa vecka, tillbaka till mer normala grader för årstiden. Inga större mängder nederbörd väntas så något torrare än normalt är att vänta. Utsläppsrätterna som föll mot 4,60 nivån förra veckan har återhämtat sig och handlas återigen över 5,10 EUR/ton. Överskott från 2013 tynger något medan rykten om stabiliseringsmekanismen införs tidigare än väntat ger stöd. Vi håller en neutral vy för både utsläppsrätterna och elpriset och tror inte på några större rörelser för kommande vecka.
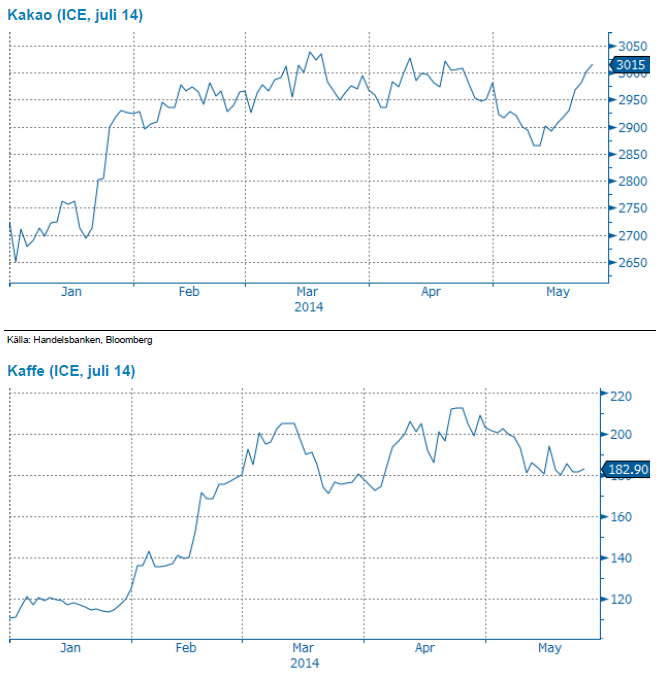
Livsmedel: Goda skördar av kakao väntas
Den senaste tidens rapporter om goda till mycket goda skördar av kakao i Västafrika har satt viss press ned på terminspriserna sedan i början av maj. Dock har nyheten om en redan översåld skörd (mid crop) gett stöd denna vecka.
Terminspriserna på kaffe har pendlat sidledes de senaste veckorna och skörden går framåt med viss fördröjning efter nederbörd över normalen i viktiga kafferegioner. Det råder inget tvivel om en nedjustering av årets skörd från Brasilien, men kaffebuskarna ser ut att vara i sämre skick än beräknat, varför ett ännu större bortfall för skörden 2015-2016 väntas.
Handelsbankens råvaruindex (USD)
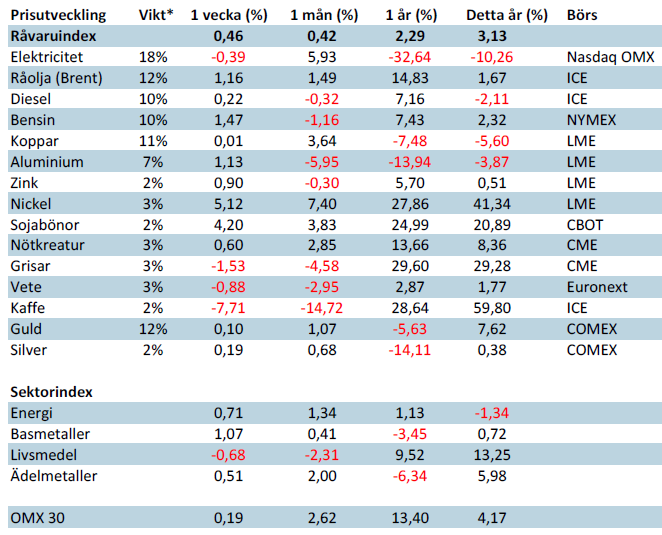
*Uppdaterade vikter från 29 november 2013
Handelsbankens råvaruindex består av de underliggande indexen för respektive råvara. Vikterna är bestämda till hälften från värdet av nordisk produktion (globala produktionen för sektorindex) och till hälften från likviditeten i terminskontrakten.
[box]SHB Råvarubrevet är producerat av Handelsbanken och publiceras i samarbete och med tillstånd på Råvarumarknaden.se[/box]
Ansvarsbegränsning
Detta material är producerat av Svenska Handelsbanken AB (publ) i fortsättningen kallad Handelsbanken. De som arbetar med innehållet är inte analytiker och materialet är inte oberoende investeringsanalys. Innehållet är uteslutande avsett för kunder i Sverige. Syftet är att ge en allmän information till Handelsbankens kunder och utgör inte ett personligt investeringsråd eller en personlig rekommendation. Informationen ska inte ensamt utgöra underlag för investeringsbeslut. Kunder bör inhämta råd från sina rådgivare och basera sina investeringsbeslut utifrån egen erfarenhet.
Informationen i materialet kan ändras och också avvika från de åsikter som uttrycks i oberoende investeringsanalyser från Handelsbanken. Informationen grundar sig på allmänt tillgänglig information och är hämtad från källor som bedöms som tillförlitliga, men riktigheten kan inte garanteras och informationen kan vara ofullständig eller nedkortad. Ingen del av förslaget får reproduceras eller distribueras till någon annan person utan att Handelsbanken dessförinnan lämnat sitt skriftliga medgivande. Handelsbanken ansvarar inte för att materialet används på ett sätt som strider mot förbudet mot vidarebefordran eller offentliggörs i strid med bankens regler.


The latest weekly report from the US DOE showed a substantial drawdown across key petroleum categories, adding more upside potential to the fundamental picture.

Commercial crude inventories (excl. SPR) fell by 5.8 million barrels, bringing total inventories down to 415.1 million barrels. Now sitting 11% below the five-year seasonal norm and placed in the lowest 2015-2022 range (see picture below).
Product inventories also tightened further last week. Gasoline inventories declined by 2.1 million barrels, with reductions seen in both finished gasoline and blending components. Current gasoline levels are about 3% below the five-year average for this time of year.
Among products, the most notable move came in diesel, where inventories dropped by almost 4.1 million barrels, deepening the deficit to around 20% below seasonal norms – continuing to underscore the persistent supply tightness in diesel markets.
The only area of inventory growth was in propane/propylene, which posted a significant 5.1-million-barrel build and now stands 9% above the five-year average.
Total commercial petroleum inventories (crude plus refined products) declined by 4.2 million barrels on the week, reinforcing the overall tightening of US crude and products.


A classic case of “buy the rumor, sell the news” played out in oil markets, as Brent crude has dropped sharply – down nearly USD 10 per barrel since yesterday evening – following Iran’s retaliatory strike on a U.S. air base in Qatar. The immediate reaction was: “That was it?” The strike followed a carefully calibrated, non-escalatory playbook, avoiding direct threats to energy infrastructure or disruption of shipping through the Strait of Hormuz – thus calming worst-case fears.
After Monday morning’s sharp spike to USD 81.4 per barrel, triggered by the U.S. bombing of Iranian nuclear facilities, oil prices drifted sideways in anticipation of a potential Iranian response. That response came with advance warning and caused limited physical damage. Early this morning, both the U.S. President and Iranian state media announced a ceasefire, effectively placing a lid on the immediate conflict risk – at least for now.
As a result, Brent crude has now fallen by a total of USD 12 from Monday’s peak, currently trading around USD 69 per barrel.
Looking beyond geopolitics, the market will now shift its focus to the upcoming OPEC+ meeting in early July. Saudi Arabia’s decision to increase output earlier this year – despite falling prices – has drawn renewed attention considering recent developments. Some suggest this was a response to U.S. pressure to offset potential Iranian supply losses.
However, consensus is that the move was driven more by internal OPEC+ dynamics. After years of curbing production to support prices, Riyadh had grown frustrated with quota-busting by several members (notably Kazakhstan). With Saudi Arabia cutting up to 2 million barrels per day – roughly 2% of global supply – returns were diminishing, and the risk of losing market share was rising. The production increase is widely seen as an effort to reassert leadership and restore discipline within the group.
That said, the FT recently stated that, the Saudis remain wary of past missteps. In 2018, Riyadh ramped up output at Trump’s request ahead of Iran sanctions, only to see prices collapse when the U.S. granted broad waivers – triggering oversupply. Officials have reportedly made it clear they don’t intend to repeat that mistake.
The recent visit by President Trump to Saudi Arabia, which included agreements on AI, defense, and nuclear cooperation, suggests a broader strategic alignment. This has fueled speculation about a quiet “pump-for-politics” deal behind recent production moves.
Looking ahead, oil prices have now retraced the entire rally sparked by the June 13 Israel–Iran escalation. This retreat provides more political and policy space for both the U.S. and Saudi Arabia. Specifically, it makes it easier for Riyadh to scale back its three recent production hikes of 411,000 barrels each, potentially returning to more moderate increases of 137,000 barrels for August and September.
In short: with no major loss of Iranian supply to the market, OPEC+ – led by Saudi Arabia – no longer needs to compensate for a disruption that hasn’t materialized, especially not to please the U.S. at the cost of its own market strategy. As the Saudis themselves have signaled, they are unlikely to repeat previous mistakes.
Conclusion: With Brent now in the high USD 60s, buying oil looks fundamentally justified. The geopolitical premium has deflated, but tensions between Israel and Iran remain unresolved – and the risk of missteps and renewed escalation still lingers. In fact, even this morning, reports have emerged of renewed missile fire despite the declared “truce.” The path forward may be calmer – but it is far from stable.
Analys
A muted price reaction. Market looks relaxed, but it is still on edge waiting for what Iran will do
Brent crossed the 80-line this morning but quickly fell back assigning limited probability for Iran choosing to close the Strait of Hormuz. Brent traded in a range of USD 70.56 – 79.04/b last week as the market fluctuated between ”Iran wants a deal” and ”US is about to attack Iran”. At the end of the week though, Donald Trump managed to convince markets (and probably also Iran) that he would make a decision within two weeks. I.e. no imminent attack. Previously when when he has talked about ”making a decision within two weeks” he has often ended up doing nothing in the end. The oil market relaxed as a result and the week ended at USD 77.01/b which is just USD 6/b above the year to date average of USD 71/b.

Brent jumped to USD 81.4/b this morning, the highest since mid-January, but then quickly fell back to a current price of USD 78.2/b which is only up 1.5% versus the close on Friday. As such the market is pricing a fairly low probability that Iran will actually close the Strait of Hormuz. Probably because it will hurt Iranian oil exports as well as the global oil market.
It was however all smoke and mirrors. Deception. The US attacked Iran on Saturday. The attack involved 125 warplanes, submarines and surface warships and 14 bunker buster bombs were dropped on Iranian nuclear sites including Fordow, Natanz and Isfahan. In response the Iranian Parliament voted in support of closing the Strait of Hormuz where some 17 mb of crude and products is transported to the global market every day plus significant volumes of LNG. This is however merely an advise to the Supreme leader Ayatollah Ali Khamenei and the Supreme National Security Council which sits with the final and actual decision.
No supply of oil is lost yet. It is about the risk of Iran closing the Strait of Hormuz or not. So far not a single drop of oil supply has been lost to the global market. The price at the moment is all about the assessed risk of loss of supply. Will Iran choose to choke of the Strait of Hormuz or not? That is the big question. It would be painful for US consumers, for Donald Trump’s voter base, for the global economy but also for Iran and its population which relies on oil exports and income from selling oil out of that Strait as well. As such it is not a no-brainer choice for Iran to close the Strait for oil exports. And looking at the il price this morning it is clear that the oil market doesn’t assign a very high probability of it happening. It is however probably well within the capability of Iran to close the Strait off with rockets, mines, air-drones and possibly sea-drones. Just look at how Ukraine has been able to control and damage the Russian Black Sea fleet.
What to do about the highly enriched uranium which has gone missing? While the US and Israel can celebrate their destruction of Iranian nuclear facilities they are also scratching their heads over what to do with the lost Iranian nuclear material. Iran had 408 kg of highly enriched uranium (IAEA). Almost weapons grade. Enough for some 10 nuclear warheads. It seems to have been transported out of Fordow before the attack this weekend.
The market is still on edge. USD 80-something/b seems sensible while we wait. The oil market reaction to this weekend’s events is very muted so far. The market is still on edge awaiting what Iran will do. Because Iran will do something. But what and when? An oil price of 80-something seems like a sensible level until something do happen.


USA ska införa 50 procent tull på koppar

Ryska staten siktar på att konfiskera en av landets största guldproducenter

Hur säkrar vi Sveriges tillgång till kritiska metaller och mineral i en ny geopolitisk verklighet?

Lundin Mining ska bli en av de tio största kopparproducenterna i världen

Sommarvädret styr elpriset i Sverige

Uppgången i oljepriset planade ut under helgen

Mahvie Minerals växlar spår – satsar fullt ut på guld

Låga elpriser i sommar – men mellersta Sverige får en ökning

Oljan, guldet och marknadens oroande tystnad
Very relaxed at USD 75/b. Risk barometer will likely fluctuate to higher levels with Brent into the 80ies or higher coming 2-3 weeks
-
 Nyheter4 veckor sedan
Uppgången i oljepriset planade ut under helgen
-
 Nyheter3 veckor sedan
Mahvie Minerals växlar spår – satsar fullt ut på guld
-
 Nyheter4 veckor sedan
Låga elpriser i sommar – men mellersta Sverige får en ökning
-
 Nyheter2 veckor sedan
Oljan, guldet och marknadens oroande tystnad
-
Analys4 veckor sedan
Very relaxed at USD 75/b. Risk barometer will likely fluctuate to higher levels with Brent into the 80ies or higher coming 2-3 weeks
-

 Nyheter2 veckor sedan
Jonas Lindvall är tillbaka med ett nytt oljebolag, Perthro, som ska börsnoteras
-
Analys3 veckor sedan
A muted price reaction. Market looks relaxed, but it is still on edge waiting for what Iran will do
-

 Nyheter2 veckor sedan
Domstolen ger klartecken till Lappland Guldprospektering