

Analys
SEB – Råvarukommentarer, 26 maj 2014

Rekommendationer
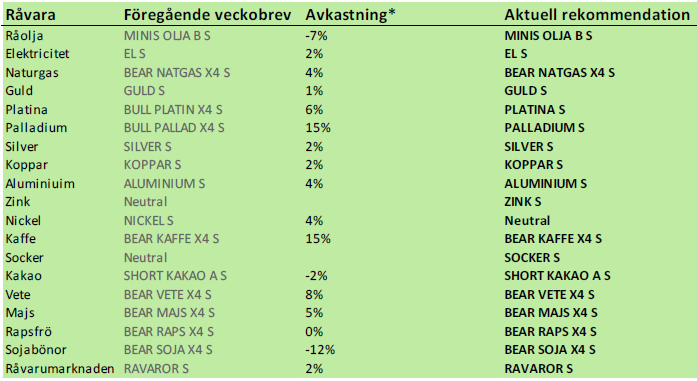
Kort sammanfattning
Fredagens stängde med oro inför vad som kan hända i Ukraina under helgen, där det är presidentval. I EU är det val till Europaparlamentet, med vad som ser ut att kunna bli ett något annorlunda sammansatt parlament. I USA och Storbritannien är marknaderna stängda måndagen den 26 maj, så att det är en långhelg innebär också att viljan att ha riskpositioner över helgen är mindre än normalt.
Efter ett par veckors fokus på den ovanliga volatiliteten i nickelmarknaden, har blickarna vänts mot andra metaller, som kanske håller på att vakna till liv. Kopparmarknaden går allt mer in i brist, vilket återspeglas både av fortsatt sjunkande lager och mer backwardation i terminskurvan (terminspriser lägre än spotpriset). Aluminiumpriset steg under fast handel i veckan, med stöd från stängning av korta positioner. På en del håll argumenteras att aluminium är nästa metall att drivas av utbudsfaktorer, efter nickel och PGM-metallerna. Zink har en intressant teknisk bild, som talar för högre priser. Frågan är om det är motiverat av fundamenta i dagens marknad.
På makrofronten kom de viktigaste siffrorna från Markits – de preliminära inköpschefsindexen. För Kina steg PMI oväntat från 48.1 till 49.7. Ett PMI under 50 innebär visserligen att tillverkningsindustrin krymper, men förbättringen av PMI var överraskande stor. I Europa var PMI lite sämre, men indikerar fortfarande expansion vid 52.5. I USA steg PMI oväntat från 55.5 förra månaden till 56.2.
Odlingsvädret fortsätter att vara mycket bra runtom i världen. Nu får även den torkdrabbade veteodlingen i USA nederbörd. Detta fick vete- och majsterminerna att falla med 2% i veckan som gick. Förvånande positivt inköpschefsindex för Kina publicerades också i veckan, som nämnt ovan. Eftersom mer pengar i Kina innebär mer protein i maten, steg sojabönorna med 5% i Chicago under ledning av sojamjölet. Haussen i sojabönorna påverkade rapsfrömarknaden under en dag. Sedan föll priset på raps tillbaka. Raps ser väldigt svagt ut och när rekylen kommer i sojan, kan rapsen falla ner mot 350 euro, en nivå som marknaden uppfattar som den absoluta botten för rapsen.
Sådden av majs går framåt i USA och är nu nästan färdig. Ukrainas produktion av majs ser ut att bli ungefär lika stor som förra året enligt de uppgifter som publicerats i veckan. Prisuppgången på spannmål tidigare i år motiverades av oro för Ukrainas produktion, där gissningarna låg på 20 – 25 mt. Nu ser produktionen ut att hamna kring 30 mt, exkl Krim, alltså i nivå med förra året. I skrivande stund har det inte kommit några alarmerande uppgifter om våldsamheter från presidentvalets Ukraina idag.
Marknaderna i USA och i England är som sagt stängda på måndag, så det blir en lugn start på en kort vecka, beroende förstås på det riktiga utfallet av valen i EU och Ukraina.
Råolja – Brent
Oljehandlare tyckte att de överlag bättre PMI-siffrorna motiverade ett högre oljepris. Samtidigt har förhoppningarna om att Libyen ska komma tillbaka som oljeexportör grusats. Väpnad konflikt med flera döda mellan rebellstyrkor och regeringssoldater har återupptagits. Det har också varslats om strejk på Nordsjön. Minskningen av oljelagren i USA i onsdagens DOE-statistik var också större än väntat.
Tekniskt är priset uppe vid den nivå där uppgångar slutat de senaste åren. De historiska oddsen är goda för att även den här uppgången ska sluta ungefär vid dagen nivå på oljepriset.
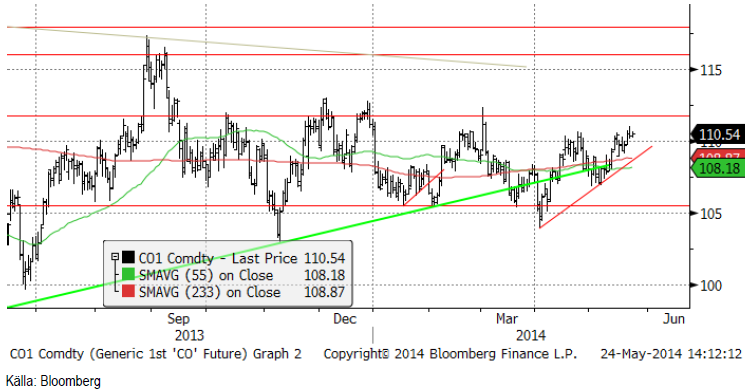
Råoljelagren minskade som nämnt ovan, med drygt 7 miljoner fat, vilket var oväntat mycket och gav marknaden stöd. Till viss del förklaras lagerminskningen av att importen för veckan låg på den lägsta nivån sedan 1996.
Vi rekommenderar en kort position i olja, t ex med MINIS OLJA B S eller MINIS OLJA A S.
Elektricitet
Hydrologisk balans är något under det normala och 60% av kärnkraften är ur drift pga planerat underhåll. Nederbördsprognosen har svängt om till torrare än normalt för de kommande 14 dagarna. Under lång tid har Norden fått väsentligt mycket mer nederbörd än normalt, samtidigt som det varit mycket varmare än normalt.
Det är möjligt att marknaden tar fasta på detta och handlar upp priset. Tekniskt ser marknaden ut att bilda en så kallad ”huvudskuldra” formation med nacklinje ungefär vid 27 euro. Om den nivån bryts, signaleras en trendvändning uppåt.
Vi behåller köprekommendationen. Stöd finns på 24 euro och motstånd på 27.
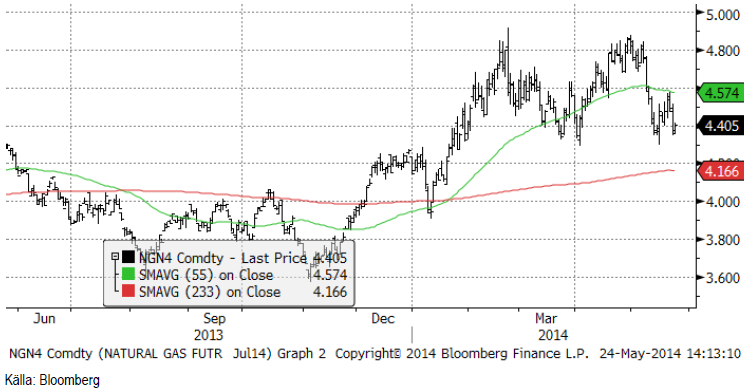
Naturgas
Priset på naturgas befinner sig i en fallande trend. Prisfallet gick återigen ner till stödet vid 4.40 dollar per MMBtu. Rent tekniskt ”borde” den nivån brytas. Under 4.40 finns stöd först vid 4.20 och sedan vid 4 dollar.
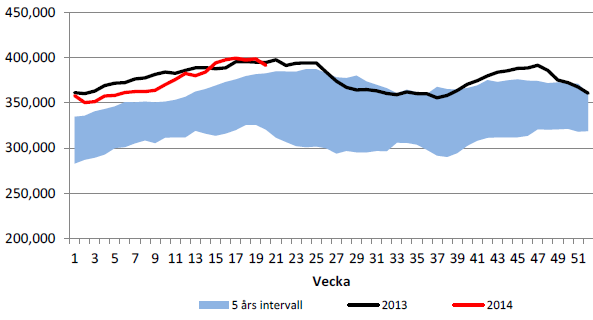
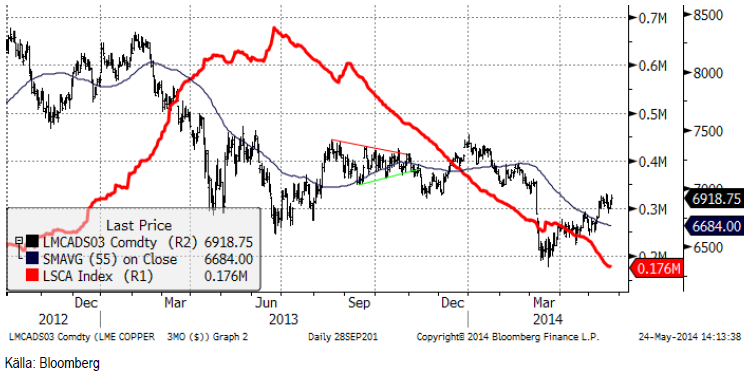
Koppar
Tremånadersterminen har strävat på uppåt hela veckan, men utan några fyrverkerier. Intresset har huvudsakligen handlat om kurvan, särskilt den korta sidan. Cash mot 3-månaders terminspris handlades i fredags på runt 90 dollar per ton i backwardation. Vi har inte sett den spreaden sedan maj 2012. Bristen i marknaden har (inte förvånande) hand i hand med det fallande LME-lagret, som för närvarande sjunkit till 175,000 ton. Så låg nivå har inte setts sedan sommaren 2008, på toppen av konjunkturen. Lägger vi till Comex och Shanghai är det totala lagret runt 350 kt. Det är fortfarande lite i förhållande till marknaden för koppar som omsluter 20 miljoner ton per år. Det här är naturligtvis inte hela sanningen. Som vi har nämnt förut, anser de flesta marknadsbedömare att det finns stora mängder metall i lagerhus i Kina. Det senaste estimatet är 800-900 kt. De totala lagren uppgår enligt Metal Bulletin till 1.2 miljoner ton, vilket utgör 2.9 veckors konsumtion. Även detta innebär att det råder brist på koppar. Det innebär att den senaste förändringen i terminskurvan förmodligen är motiverad. Marknaden fokuserar emellertid på hoten: alla nya projekt i pipelinen (ungefär 5 miljoner ton i årlig produktion fram till 2020), kombinerat med oro för den kinesiska efterfrågan, kopplat till riskerna i fastighetssektorn. Sammanfattningen enligt vår åsikt är högre volatilitet i terminspriserna framöver och särskilt på uppsidan. Pga de låga lagren, får förändringar i utbud och efterfrågan mer omedelbar effekt på priserna, uppåt eller nedåt.
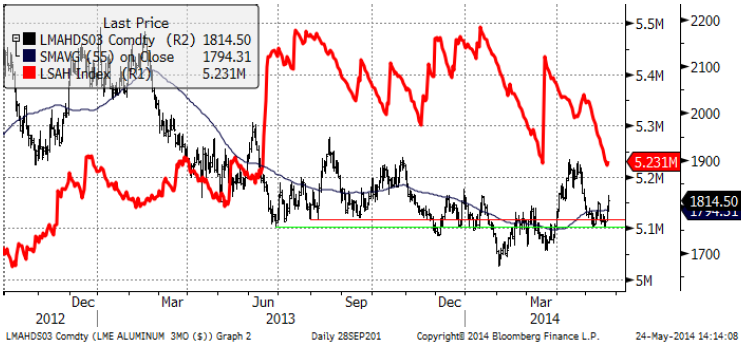
Aluminium
Nickel utvecklades mycket positivt i veckan, endast slagen av nickel. Givet det negativa sentimentet i början av veckan, när priset höll på att gå genom stödet på 1750 dollar, kom haussen som en överraskning för somliga. Vi har varit långsiktigt positiva till marknaden, med anledning av den gradvisa förbättringen av den fundamentala balansen, så i det avseendet var vi inte förvånade. Takten i uppgången var dock förvånande. En artikel i Financial Times i veckan handlar om att aluminium kan vara nästa metall att rusa i kölvattnet av det indonesiska exportförbudet. Rusal kommenterade att marknaden kommer att vara 1.3 mt i underskott i år och det gav uppgången extra bränsle. Vi har diskuterat effekterna av det indonesiska exportförbudet tidigare här, och kommit fram till att volymen som sådan är stor, men det finns goda alternativ för Kina (som är den största importören). Alternativen kan innebära högre kostnader, estimerade av flera olika analytiker till 30 – 50 dollar per ton för kinesiska smältverk. Så den indonesiska effekten borde vara liten.
Den starka efterfrågesituationen med minskande produktion borde i sig självt kunna leda till en gradvis återhämtning i priset. En annan positiv faktor är marknaden för fysiska premier. Den här veckan steg premien för metall i Europa med 10 dollar till runt 400 dollar.
Vi fortsätter alltså med köprekommendation på ALUMINIUM S.
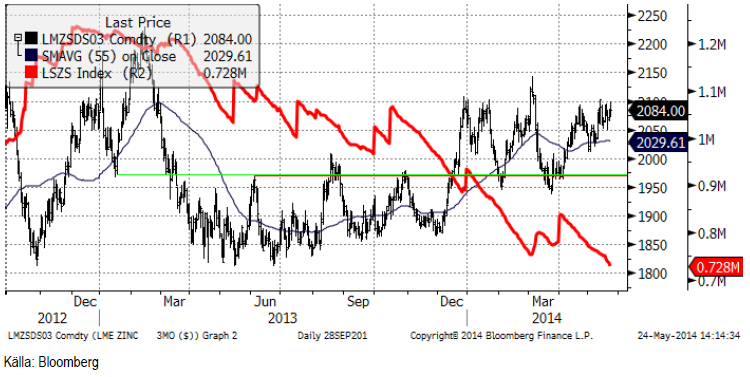
Zink
Zinkpriset har potential att nå 2200 dollar per ton från dagens nivå på 2084 dollar. Den enda nyheten från zinkmarknaden i veckan att notera är mars-statistiken från ILZSG, som visade ett underskott på 17 kt i marknaden. Det bekräftar den positiva pristrenden i marknaden. Lagren är fortfarande höga, och räcker till 8 veckors konsumtion enligt Metal Bulletin (jämför med koppar ovan). I det avseendet liknar zink situationen i aluminium – allt bättre fundamenta – men en bit kvar att gå. Om vi tittar på den tekniska bilden, tycker vi att det börjar se mer intressant ut. Priset har flera gånger försökt att gå genom motståndet på 2100 dollar. Ett brott kommer förmodligen att ge uppgången en del momentum, med potential att nå 2200 dollar per ton.
Vi återgår till köprekommendation på ZINK S.
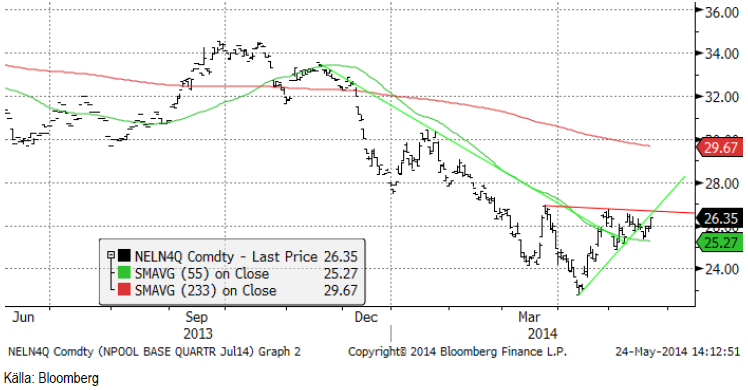
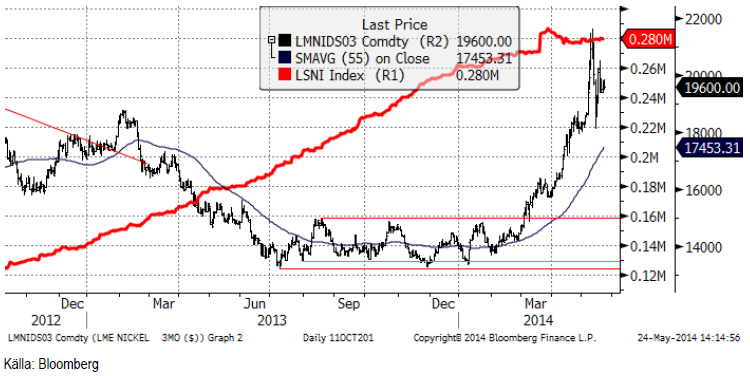
Nickel
Intradagrörelserna i priset på nickel har återvänt till nästan normala nivåer. Prisrörelserna bildar en triangel, en känd teknisk formation, som förebådar en ny stor rörelse uppåt eller nedåt, kanske i veckan som kommer. Vi lutar mot att det blir nedåt, till de nivåer vi såg som hastigast förrförra veckan runt 18500 dollar. Presidentkandidater i Indonesien säger enligt lokala tidningar att de planerar att behålla exportförbudet. Det är vad marknaden förväntar sig. Kommentarer om att de masugnar som talats om kommer att vara färdiga snart eller senare, debatteras. De flesta observatörer tycks vara överens om att några förmodligen kommer att var klara senare i år. Men det förhindrar inte att nickelmarknaden kommer att vara i underskott de kommande åren.
Vi fick den prisrörelse vi väntade oss förra veckan, från stödet vid runt 18,500 dollar. Haussen fick priset att nå 20,495 vid mitten av veckan. Om marknaden skulle rekylera nedåt, håller vi fast vid vår åsikt att ett pris på mellan 18,000 och 19,000 dollar per ton förmodligen är bra att köpa till. Just nu tycker vi att man inte ska ha någon position.
Guld
Guldmarknaden fortsatte att hålla sig lugn i veckan. World Gold Council publicerade sin kvartalsvisa Gold Demand Trends, som visade på stark efterfrågan på smycken i Kina och att ETF-utflödet avstannat under det första kvartalet. Efterfrågan globalt på fysiskt investeringsguld har dock minskat. Vad vi hör om detta i Sverige, så verkar det inte gälla här.
Eftersom inget har hänt på marknaden är situationen densamma som för en vecka sedan. Vi är fortfarande svagt positiva till guld.
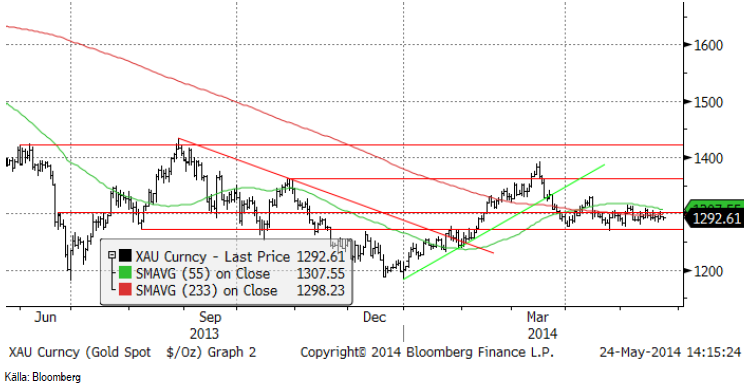
Vi rekommenderar köp av GULD S.
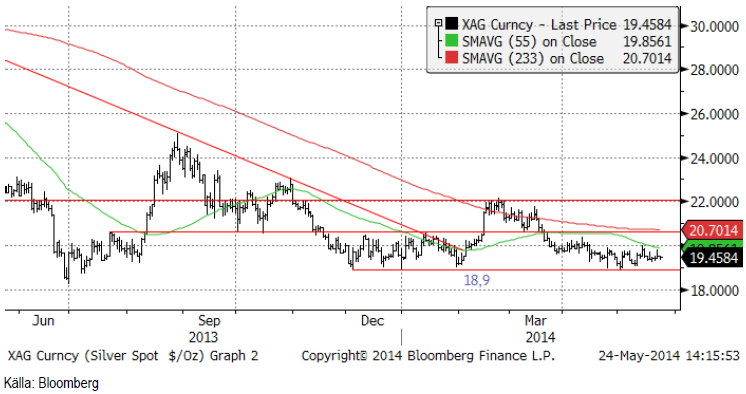
Silver
Silverpriset har inte heller uppvisat någon annan tendens än att vara stabilt.
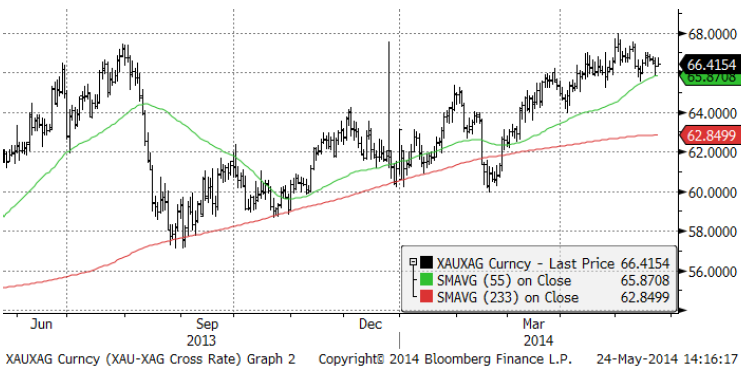
Nedan ser vi ett diagram över priset på guld uttryckt i silver.
Vi anser att silver är mer köpvärt än guld och skulle vilja köpa på de här nivåerna. Vi rekommenderar köp av SILVER S.
Platina & Palladium
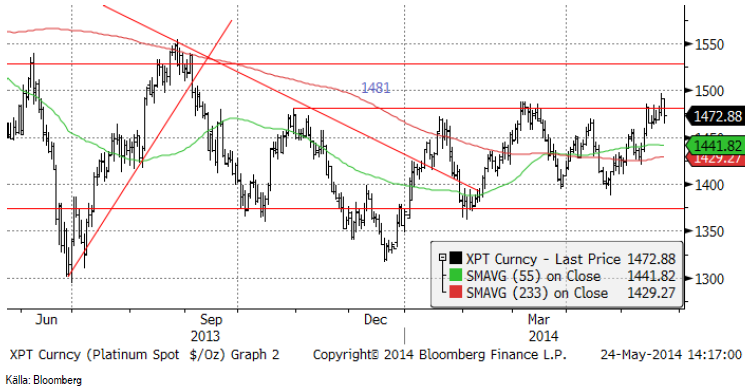
Platina steg över motståndet på 1481 i veckan men vid 1500 dollar fanns uppenbarligen säljare i väntan och kontakten med dessa fick marknaden att falla tvärt in i stängning på fredagen. Strejkerna pågår fortfarande i Sydafrika och den ryska situationen är inte förändrad heller. När marknaden har testat att handla upp platina och även palladium har det alltid funnits säljare på högre nivåer. Detta innebär att aktörer är väldigt försiktiga när priset verkar stöta på motstånd.
Prisdiagrammet på palladium ser vi nedan. Sedan förra veckan har terminen stigit från 815 dollar till 831 dollar. Frågan är om marknaden orkar ta priset upp till 850 dollar utan en rekyl. Risken för en rekyl är påtaglig.
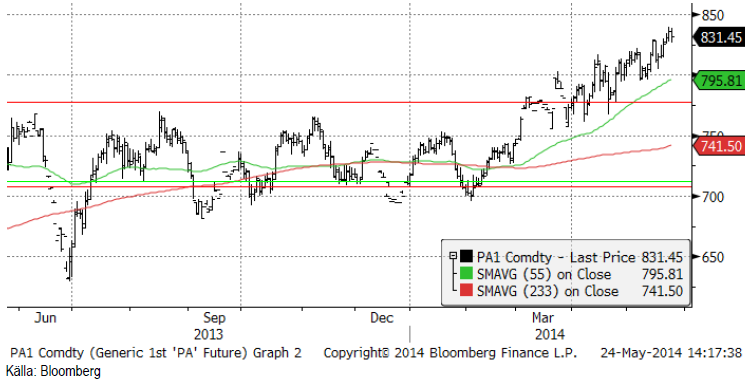
Vi rekommenderar att man minskar på hävstången och kanske behåller 1:1-certikaten PLATINA S och PALLADIUM S.
Kaffe
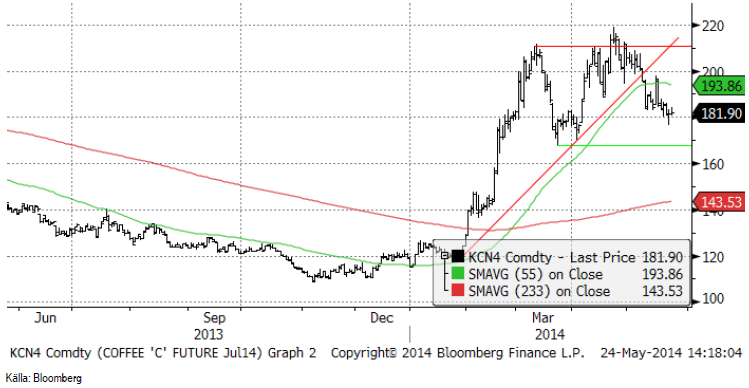
Kaffemarknaden har successivt rört sig nedåt. Stöd finns vid 170-centsnivån och motstånd på ca 200 cent i första hand. Tekniskt ser det överlag negativt ut, varför behåller en försiktig position i BEAR KAFFE X4 S.
Kakao
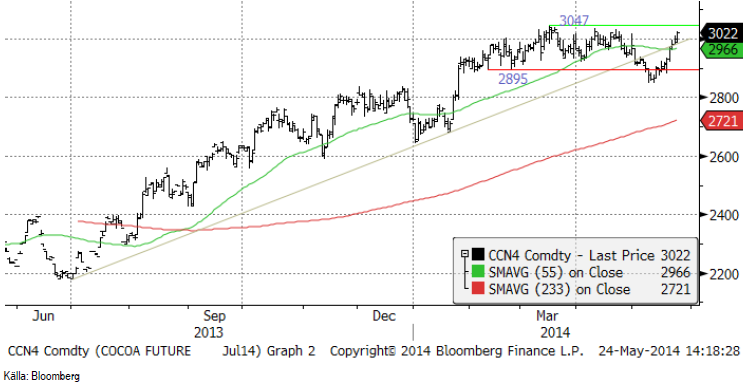
Priset på kakao rekylerade uppåt efter att priset för drygt två veckor sedan föll under det tekniska stödet vid 2895 dollar per ton. Vi tolkar uppgången som ett tillfälle att sälja på.
Vi rekommenderar köp av SHORT KAKAO A S, som har en hävstång strax under -1.
[box]SEB Veckobrev Veckans råvarukommentar är producerat av SEB Merchant Banking och publiceras i samarbete och med tillstånd på Råvarumarknaden.se[/box]
Disclaimer
The information in this document has been compiled by SEB Merchant Banking, a division within Skandinaviska Enskilda Banken AB (publ) (“SEB”).
Opinions contained in this report represent the bank’s present opinion only and are subject to change without notice. All information contained in this report has been compiled in good faith from sources believed to be reliable. However, no representation or warranty, expressed or implied, is made with respect to the completeness or accuracy of its contents and the information is not to be relied upon as authoritative. Anyone considering taking actions based upon the content of this document is urged to base his or her investment decisions upon such investigations as he or she deems necessary. This document is being provided as information only, and no specific actions are being solicited as a result of it; to the extent permitted by law, no liability whatsoever is accepted for any direct or consequential loss arising from use of this document or its contents.
About SEB
SEB is a public company incorporated in Stockholm, Sweden, with limited liability. It is a participant at major Nordic and other European Regulated Markets and Multilateral Trading Facilities (as well as some non-European equivalent markets) for trading in financial instruments, such as markets operated by NASDAQ OMX, NYSE Euronext, London Stock Exchange, Deutsche Börse, Swiss Exchanges, Turquoise and Chi-X. SEB is authorized and regulated by Finansinspektionen in Sweden; it is authorized and subject to limited regulation by the Financial Services Authority for the conduct of designated investment business in the UK, and is subject to the provisions of relevant regulators in all other jurisdictions where SEB conducts operations. SEB Merchant Banking. All rights reserved.

Market is starting to take US/Iran headlines with a pinch of salt. Brent crude rose $2.8/b yesterday to an official close of $112.1/b. But after that it traded as low as $108.05/b before ending late night at around $109.7/b. Through the day it traded in a range of $106.87 – 112.72/b amid a flurry of news or rumors from Iran and the US. ”US temporary sanctions during negotiations” (falls alarm). ”We will bomb Iran” (not anyhow),… etc. While the market is still fluctuating to this kind of news flow, it is starting to take such headlines with a pinch of salt.

We’ll see. Maybe, maybe not. The Brent M1 contract is trading at $110.2/b this morning which very close to the average ticks through yesterday of $110.4/b.
Trump with bearish, verbal intervention whenever Brent trades above $110/b it seems. What seems to be a pattern is that Trump states something like ”very good negotiations going on with Iran”, ”New leaders in Iran are great,..”, ”Great progress in negotiations,…”, ”Deal in sight,..” etc whenever the Brent M1 contract trades above $110/b. An effort to cool the market. These hot air verbal interventions from Trump used to have a heavy bearish impact on prices, but they now seems to have less and less effect unless they are backed by reality.
As far as we can see there has been no real progress in the negotiations between the US and Iran with both sides still standing by their previous demands.
Iran is getting stronger while the cease fire lasts making a return to war for Trump yet harder. Iran is naturally in constant preparation for a return to war given Trump’s steady threats of bombing Iran again. Iran is naturally doing what ever is possible to prepare for a return to war. And every day the cease fire lasts it is better prepared. This naturally makes it more and more difficult and dangerous for the US to return to warring activity versus Iran as the consequences for energy infrastructure in the Persian Gulf will be more and more severe the longer the cease fire lasts. Israel seems to see it this way as well. That the war is not won and that current frozen state of a cease fire gives Iran opportunity to rebuild military and politically.
Global inventories are drawing down day by day. How much? In the meantime the Strait of Hormuz stays closed. There is varying measures and estimates of how much global inventories are drawing down. Our rough estimate, back of the envelope, is that global inventories are drawing down by at least some 10 mb/d or about 300 mb/d in a balance between loss of supply versus demand destruction. Other estimates we see are a monthly draw of 250-270 mb/d. The IEA only ’measured’ a draw in global observable stocks of 117 mb in April with oil on water rising 53 mb while on shore stocks fell 170 mb. But global stocks are hard to measure with large invisible, unmeasured stocks. As such a back of the envelope approach may be better.
Oil products is what the world is consuming. Oil product prices likely to rise while product stocks fall. Strategic Petroleum Reserves (SPR) are predominantly crude oil. Discharging oil from OECD SPR stocks, a sharp reduction in Chinese crude imports and a reduction in global refinery throughput of 6-7 mb/d has helped to keep crude oil markets satisfactorily supplied. But global inventories are drawing down none the less. And oil products is really what the world is consuming. So if global refinery throughput stays subdued, then demand will eventually have to match the supply of oil products. The likely path forward this summer is a steady draw down in jet fuel, diesel and gasoline. Higher prices for these. Then, if possible, higher refinery throughput and higher usage of crude in response to very profitable refinery margins. And lastly sharper draw in crude stocks and higher prices for these. But some 6 mb/d of oil products used to be exported through the Strait of Hormuz. And it may not be so easy to ramp up refinery activity across the world to compensate. Especially as Ukraine continues to damage Russian refineries as well as Russian crude production and export facilities.
Watch oil product stocks and prices as well as Brent calendar 2027. What to watch for this summer is thus oil product inventories falling and oil product premiums to crude rising. Another measure to watch is the Brent crude 2027 contract as it rises steadily day by day as the Strait of Hormuz stays closed and global oil inventories decline. The latter is close to the highest level since the start of the war and keeps rising.
The Brent M1 contract and the Brent 2027 prices and current price of jet fuel in Europe (ARA). All in USD/b

Our back of the envelope calculation of the global shortage created by the closure of the Strait of Hormuz. Note that 3.5 mb/d of discharge from SPR is also a draw. Note also that ’Forced demand loss’ of 2.5 mb/d is probably temporary and will fall back towards zero as logistics are sorted out leaving ’Price demand loss’ to do the job of balancing the market. Thus a shortfall of at least 9 mb/d created by the closure. More if SPR discharge is included and more if Forced demand loss recedes.

Brent is climbing higher. Front-month is at USD 106.3/bl this morning, close to a weekly high and a USD 9/bl jump from Mondays open. This is the move we flagged as a risk earlier in the week: the market shifting from ”a deal is around the corner” to ”this is going to take longer than we thought”.

Analyst Commodities, SEB
During April, rest-of-year Brent remained remarkably stable around USD 90/bl. A stability which rested on one single assumption: the SoH reopens around 1 May. That assumption is now slowly falling apart.
As we highlighted yesterday: every week of delay beyond 1 May adds (theoretically) ish USD 5/bl to the rest-of-year average, as global inventories draw 100 million barrels per week. i.e., a mid-May reopening implies rest-of-year Brent closer to USD 100/bl, and anything pushing into June or July takes us meaningfully higher.
What’s changed in the last 48 hours:
#1: The US military has formally warned that clearing suspected sea mines from SoH could take up to six months. That is a completely different timescale from what the financial market is pricing. Even a political deal tomorrow does not immediately reopen the strait.
#2: Trump has shifted his tone from urgency to ”strategic patience”. In yesterday’s press conference: ”Don’t rush me… I want a great deal.” The market is reading this as a president no longer feeling pressured by timelines, with the naval blockade running in the background.
#3: So far, the military activity is escalating, not de-escalating. Axios reports Iran is laying more mines in SoH. The US 3rd carrier strike group (USS George H.W. Bush) is arriving with two countermine vessels. Trump yesterday ordered the US Navy to destroy any Iranian boats caught laying mines. While CNN reports that the Pentagon is actively drawing up plans to strike Iranian SoH capabilities and individual Iranian military leaders if the ceasefire collapses. i.e., NOT a attitude consistent with an imminent deal!
Spot crude and product prices eased off the early-April highs on a combination of system rerouting and deal optimism. Both now weakening. Goldman estimates April Gulf output is reduced by 14.5 mbl/d, or 57% of pre-war supply, a number that keeps getting worse the longer this drags on.
Demand-side adaptation is ongoing: S. Korea has cut its Middle East crude dependence from 69% to 56% by pulling more from the Americas and Africa, and Japan is kicking off a second round of SPR releases from 1 May. But SPRs are finite.
Ref. to the negotiations, we should not bet on speed. The current Iranian leadership is dominated by genuine hardliners willing to absorb economic pain and run the clock to extract concessions. That is not a setup for a rapid resolution. US/Israeli media briefings keep framing the delay as ”internal Iranian divisions”, the reality is more complicated and points toward weeks and months, not days.
Our point is that the complexity is large, and higher prices have only just started (given a scenario where the negotiations drag out in time). The market spent April leaning on the USD 90/bl rest-of-year assumption; that case is diminishing by the hour. If ”early May reopening” is replaced by ”June, July or later” over the next week or two, both crude and products have meaningful room to reprice higher from here. There is a high risk being short energy and betting on any immediate political resolution(!).
Down on Friday. Up on Monday. The Brent June crude oil contract traded down 5.1% last week to a close of $90.38/b. It reached a high of $103.87/b last Monday and a low of $86.09/b on Friday as Iran announced that the Strait of Hormuz was fully open for transit. That quickly changed over the weekend as the US upheld its blockade of Iranian oil exports while Iran naturally responded by closing the SoH again. The US blew a hole in the engine room of the Iranian ship TOUSKA and took custody of the ship on Sunday. Brent crude is up 5.6% this morning to $95.4/b.
The cease-fire is expiring tomorrow. The US has said it will send a delegation for a second round of negotiations in Islamabad in Pakistan. But Iran has for now rejected a second round of talks as it views US demands as unrealistic and excessive while the US is also blocking the Strait of Hormuz.
While Brent is up 5% this morning, the financial market is still very optimistic that progress will be made. That talks will continue and that the SoH will fully open by the start of May which is consistent with a rest-of-year average Brent crude oil price of around $90/b with the market now trading that balance at around $88/b.
Financial optimism vs. physical deterioration. We have a divergence where the financial market is trading negotiations, improvements and resolution while at the same time the physical market is deteriorating day by day. Physical oil flows remain constrained by disrupted flows, longer voyage times and elevated freight and insurance costs.
Financial markets are betting that a US/Iranian resolution will save us in time from violent shortages down the road. But every day that the SoH remains closed is bringing us closer to a potentially very painful point of shortages and much higher prices.
The US blockade is also a weapon of leverage against its European and Asian allies. When Iran closed the SoH it held the world economy as a hostage against the US. The US blockade of the SoH is of course blocking Iranian oil exports. But it is also an action of disruption directed towards Europe and Asia. The US has called for the rest of the world to engaged in the war with Iran: ”If you want oil from the Persian Gulf, then go and get it”. A risk is that the US plays brinkmanship with the global oil market directed towards its European and Asian allies and maybe even towards China to force them to engage and take part. Maybe unthinkable. But unthinkable has become the norm with Trump in the White House.


Oil product price pain is set to rise as the Strait of Hormuz stays closed into summer

Solkraften pressar elpriserna dagtid

Michel Gubel ger sin syn på oljemarknaden


