

Analys
SHB Råvarubrevet 23 augusti 2013

 Råvaror allmänt
Har katalysatorn kommit?
Ekonomisk data har förbättrats i de tre stora regionerna USA, Europa och Kina samtidigt som dollarn har försvagats och geopolitisk oro råder (i Egypten, Irak och Iran), det är en perfekt cocktail för stigande råvarupriser. (En cocktail ska som bekant bestå av tre ingredienser varav en skall vara starkare).
Vi har favoriserat kinaexponerade råvaror under hela året utan stor framgång. Vi har väntat på en katalysator som skulle driva på marknaden som stirrat sig blind på Kinas fallande BNP. Nu har juli månads data från Kina varit bra och följts upp av ett preliminärt starkare inköpschefsindex för augusti (50.1 mot juli 47.7). Kanske är detta de första tecknen på att Kinas ekonomi stabiliseras och kommer fortsätta starkare snarare än svagare under resten av året. I så fall har basmetallerna en given uppsida där nickel har potential att stiga med 10-15%.
Basmetaller
Kina i fokus
Veckans preliminära PMI (inköpschefsindex) från Kina överraskade marknaden och vände en fallande trend. Trots det stannar metallerna på minus denna vecka där nickel har haft det tuffast med – 4%, följt av aluminium på -3,5%. Vi ser dock ljust på framtiden där ett starkare Kina ger stöd åt basmetallerna. Det kommer klara signaler från kinesiska ledare där de kommer försvara den lägsta tillåtna tillväxten plus att de tycks oroade att inbromsningen gått för långt och för snabbt.
Troligt nu är att ledarna kommer att finjustera ekonomin så att den uppvisar stabilisering eller uppgång under Q3. Den sena uppgången i PMI förklarar vi med att det råder en stor pessimism i systemet kring Kina och det tar tid att mentalt svänga om till mer positiv anda. Denna effekt kan man utnyttja och handla basmetaller på.
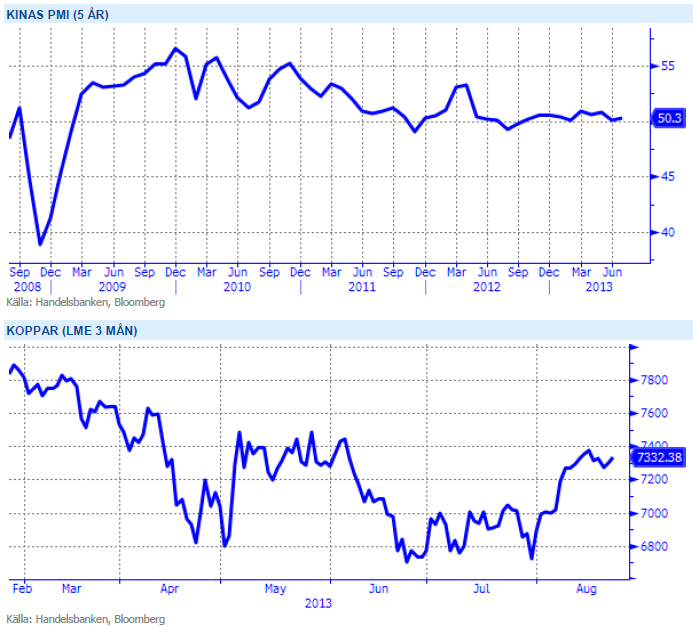
Nickel är den basmetall som gått ner mest under året och med många gruvor som går med förlust på dagens prisnivåer tror vi på stigande priser. Vi tror på: LONG NICKEL H
Ädelmetaller
Guld, alltjämt konstruktiv prisutveckling!
Förra veckan knöt vi an till vårt köpcase för guld, som går emot vår mer basala långsiktiga vy, och som innebär att vi tror att 1450 dollar per uns är en rimlig nivå. Denna veckan har guldet spenderat i ett tight och händelselöst prisintervall mellan 1355 och 1375, men nu på eftermiddagen tog det ny fart uppåt. I skrivande stund ligger vi strax under 1400 dollar, och vi ser ingen anledning till att revidera vare sig vår kortsiktiga vy (minst 1450 dollar), eller vår mer lånsiktiga skepsis. Men för tillfället handlar vi i en bekväm upptrend, och varken Feds protokoll tidigare i veckan, eller inkommande makrodata har gjort något för att ändra denna trenden.
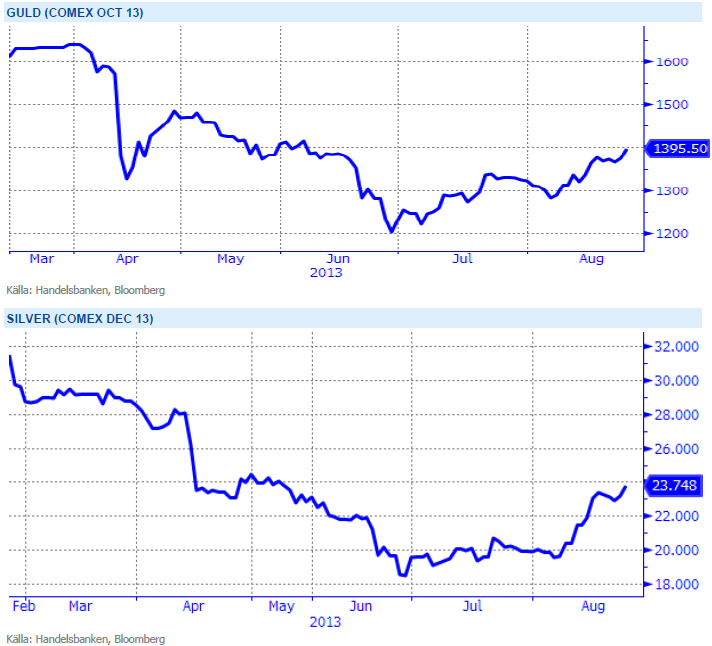
I ett läge där råvaror generellt har viktats ned av institutionella placerare kan guld och silver få en ”omotiverad” uppgång när dessa indexköpare återvänder till råvaror drivit av bättre utsikter för Kina och USA. Vi tror på: LONG GULD H och LONG SILVER H
Energi
Osäkerhet kring energibalansen
SHB Power stiger med 1.5% under veckan på osäkerhet kring energibalansen då låga nederbördsmängder riskerar att försämra energibalansen med 5-6 TWh till ett underskott om -11 TWh. Såväl kol som utsläppsrätter handlas oförändrat men potentialen bör finnas på uppsidan med nuvarande väderprognos. Under årets energidagar i Oslo verkade de flesta överens om att det låga priset på el kommer att bestå fram till 2020. Förnyelsebara investeringar i kombination med ny finsk kärnkraft skapar överskott vilket till viss del balanseras av kolpriskurvan men lägre risk för elprischocker. Skärpta utsläppskrav efter 2020 och utfasning av svenska kärnkraftsverk är en stor osäkerhet men de långa prognoserna har justerats ned till ca 34-35 öre per kWh.
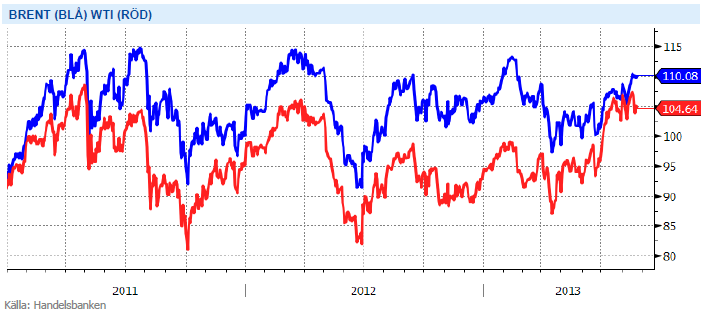
Oljan handlas oförändrat under veckan men geopolitisk risk, starkare ledande indikatorer för OECD och låg reservkapacitet inom OPEC talar för ett fortsatt starkt oljepris. Orkansäsong i USA och säsongsmässigt högre efterfrågan på oljeprodukter i OECD gynnar också bilden för olja. Intressant att se hur snabbt gapet mellan Brent och WTI minskat under sommaren. Från att ha varit närmare 0 i mitten av juli handlas spreaden nu på strax över 5 dollar att jämföra med förra årets snitt om 19 dollar och hela 27.88 dollar som lägst i november 2011. Anledningen till varför vi haft en så stor prisskillnad under 2011 och 2012 är transportbegränsningar i USA som försvårat möjligheten att få ut WTI oljan. En ökad skifferproduktion i kombination med ett lägre kapacitetsutnyttjande hos raffinaderierna har då skapat ett lokalt överskott och pressat WTI marknaden till skillnad från Nordsjöoljan Brent som är en fraktad olja och bättre kan täppa till eventuella arbitragefönster. Detta innebär exempelvis att Brent reagerar mer vid politisk oro och produktionsstörningar. Flera amerikanska infrastrukturella projekt har kommit på plats under 2013 såsom pipelines och förbättrade järnvägslänkar vid terminalerna samtidigt som lokala raffinaderier ökat körningen till nivåer vi inte sett sedan 2007. En förbättrad infrastruktur har också givit lokala raffinaderier tillgång till inhemsk olja av Brent kvalité (dvs light) vilken då ersatt behovet av Brent.
Utsikterna framöver pekar på ett torrare scenario mot normalt vilket i kombination med något starkare kontinentala marknader bör ge fortsatt stöd. Vi tror på: LONG EL
Livsmedel
Volatil jordbruksmarknad
Terminspriserna på vete har gått ned något under veckan i både Chicago och Paris. Skörden av höstvete i USA är nu i princip helt klar och vårveteskörden går raskt framåt med bara några få småskurar i vissa områden. Avkastningen på vårvetet uppges vara något över förväntan. Statistics Canada uppskattar landets totala veteskörd till den största veteskörden i Kanada sedan 1991. Australien har bra väderförhållanden för vetet i de södra och sydvästra delarna av landet. Även i Argentina önskas mer regn på redan sådd gröda. I Ukraina är veteskörden i stort sett klar. Den ryska skörden går framåt och både kvalitet och avkastning uppges ha förbättrats under den senaste tiden. Även i EU går skörden framåt i bra fart, i Storbritannien uppges dock (som vanligt) småskurar fördröja skörden. Både avkastning och kvalitet uppges vara hög. Vetepriserna kommer fortsätta att påverkas främst av utvecklingen för majsen i USA.
Priserna på majs i Chicago har handlats upp under den gångna veckan. Torrt väder i en del regioner skapar viss oro över de amerikanska grödorna och priserna går upp och ned utifrån varierande väderprognoser. Än verkar de flesta överens om att det blir en riktigt stor majsskörd i år, frågan är bara hur stor? Den närmsta tiden kommer nog bli fortsatt ganska volatil men vi tror det blir svårt att hålla majsen kvar på nuvarande nivåer när skörden kommer igång på allvar – flera s.k. ”crop tours” pekar även på en i många regioner klart högre avkastning än vad USDA spår.
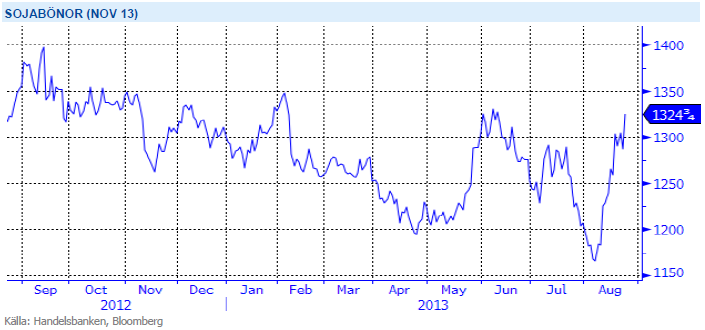
Priserna på sojabönor i Chicago noteras upp sedan förra veckan, precis som för majsen påverkat av torrt väder i en del områden i USA. En del regn har stabiliserat situationen i vissa områden men på andra håll önskas klart mycket mer. Man ska dock ej glömma att torrt väder samtidigt minskar tidigare oro för eventuell frost senare i september – vid torrt väder mognar den annars ovanligt sent utvecklade grödan klart snabbare. Nästa vecka ser ut att bli ganska torr och varm, varför vi nog kan vänta oss fortsatt oro ett tag till. Om/när regn kommer lär dock nedsidan vara ganska stor för sojabönorna, inte minst efter den senaste tidens snabba och ganska stora uppgång.
Vi håller en fortsatt neutral vy för vårt livmedelsindex.
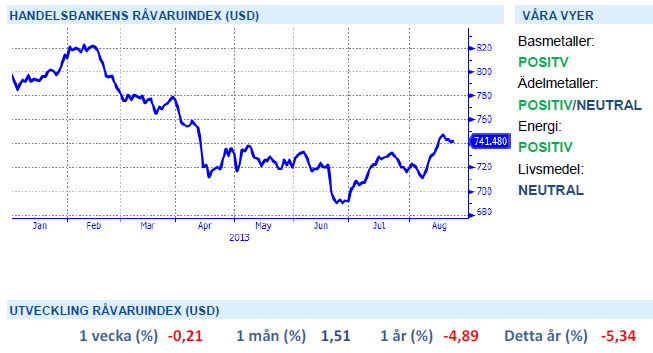
Handelsbankens Råvaruindex
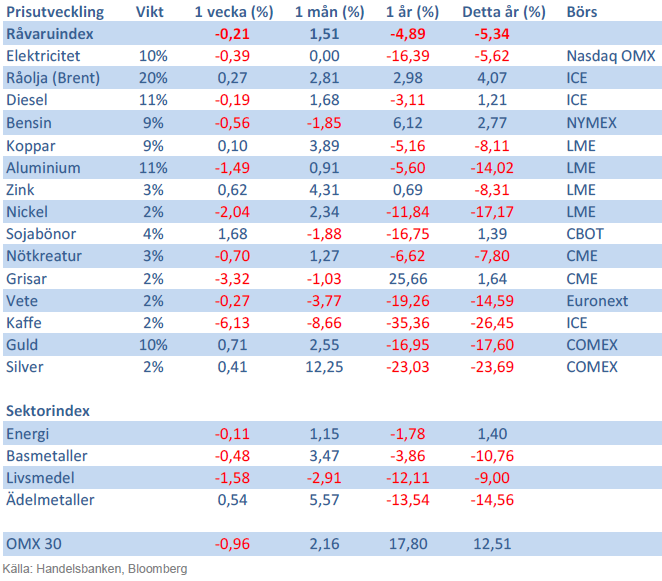
Handelsbankens råvaruindex består av de underliggande indexen för respektive råvara. Vikterna är bestämda till hälften från värdet av nordisk produktion (globala produktionen för sektorindex) och till hälften från likviditeten i terminskontrakten.
[box]SHB Råvarubrevet är producerat av Handelsbanken och publiceras i samarbete och med tillstånd på Råvarumarknaden.se[/box]
Ansvarsbegränsning
Detta material är producerat av Svenska Handelsbanken AB (publ) i fortsättningen kallad Handelsbanken. De som arbetar med innehållet är inte analytiker och materialet är inte oberoende investeringsanalys. Innehållet är uteslutande avsett för kunder i Sverige. Syftet är att ge en allmän information till Handelsbankens kunder och utgör inte ett personligt investeringsråd eller en personlig rekommendation. Informationen ska inte ensamt utgöra underlag för investeringsbeslut. Kunder bör inhämta råd från sina rådgivare och basera sina investeringsbeslut utifrån egen erfarenhet.
Informationen i materialet kan ändras och också avvika från de åsikter som uttrycks i oberoende investeringsanalyser från Handelsbanken. Informationen grundar sig på allmänt tillgänglig information och är hämtad från källor som bedöms som tillförlitliga, men riktigheten kan inte garanteras och informationen kan vara ofullständig eller nedkortad. Ingen del av förslaget får reproduceras eller distribueras till någon annan person utan att Handelsbanken dessförinnan lämnat sitt skriftliga medgivande. Handelsbanken ansvarar inte för att materialet används på ett sätt som strider mot förbudet mot vidarebefordran eller offentliggörs i strid med bankens regler.


Market is starting to take US/Iran headlines with a pinch of salt. Brent crude rose $2.8/b yesterday to an official close of $112.1/b. But after that it traded as low as $108.05/b before ending late night at around $109.7/b. Through the day it traded in a range of $106.87 – 112.72/b amid a flurry of news or rumors from Iran and the US. ”US temporary sanctions during negotiations” (falls alarm). ”We will bomb Iran” (not anyhow),… etc. While the market is still fluctuating to this kind of news flow, it is starting to take such headlines with a pinch of salt.

We’ll see. Maybe, maybe not. The Brent M1 contract is trading at $110.2/b this morning which very close to the average ticks through yesterday of $110.4/b.
Trump with bearish, verbal intervention whenever Brent trades above $110/b it seems. What seems to be a pattern is that Trump states something like ”very good negotiations going on with Iran”, ”New leaders in Iran are great,..”, ”Great progress in negotiations,…”, ”Deal in sight,..” etc whenever the Brent M1 contract trades above $110/b. An effort to cool the market. These hot air verbal interventions from Trump used to have a heavy bearish impact on prices, but they now seems to have less and less effect unless they are backed by reality.
As far as we can see there has been no real progress in the negotiations between the US and Iran with both sides still standing by their previous demands.
Iran is getting stronger while the cease fire lasts making a return to war for Trump yet harder. Iran is naturally in constant preparation for a return to war given Trump’s steady threats of bombing Iran again. Iran is naturally doing what ever is possible to prepare for a return to war. And every day the cease fire lasts it is better prepared. This naturally makes it more and more difficult and dangerous for the US to return to warring activity versus Iran as the consequences for energy infrastructure in the Persian Gulf will be more and more severe the longer the cease fire lasts. Israel seems to see it this way as well. That the war is not won and that current frozen state of a cease fire gives Iran opportunity to rebuild military and politically.
Global inventories are drawing down day by day. How much? In the meantime the Strait of Hormuz stays closed. There is varying measures and estimates of how much global inventories are drawing down. Our rough estimate, back of the envelope, is that global inventories are drawing down by at least some 10 mb/d or about 300 mb/d in a balance between loss of supply versus demand destruction. Other estimates we see are a monthly draw of 250-270 mb/d. The IEA only ’measured’ a draw in global observable stocks of 117 mb in April with oil on water rising 53 mb while on shore stocks fell 170 mb. But global stocks are hard to measure with large invisible, unmeasured stocks. As such a back of the envelope approach may be better.
Oil products is what the world is consuming. Oil product prices likely to rise while product stocks fall. Strategic Petroleum Reserves (SPR) are predominantly crude oil. Discharging oil from OECD SPR stocks, a sharp reduction in Chinese crude imports and a reduction in global refinery throughput of 6-7 mb/d has helped to keep crude oil markets satisfactorily supplied. But global inventories are drawing down none the less. And oil products is really what the world is consuming. So if global refinery throughput stays subdued, then demand will eventually have to match the supply of oil products. The likely path forward this summer is a steady draw down in jet fuel, diesel and gasoline. Higher prices for these. Then, if possible, higher refinery throughput and higher usage of crude in response to very profitable refinery margins. And lastly sharper draw in crude stocks and higher prices for these. But some 6 mb/d of oil products used to be exported through the Strait of Hormuz. And it may not be so easy to ramp up refinery activity across the world to compensate. Especially as Ukraine continues to damage Russian refineries as well as Russian crude production and export facilities.
Watch oil product stocks and prices as well as Brent calendar 2027. What to watch for this summer is thus oil product inventories falling and oil product premiums to crude rising. Another measure to watch is the Brent crude 2027 contract as it rises steadily day by day as the Strait of Hormuz stays closed and global oil inventories decline. The latter is close to the highest level since the start of the war and keeps rising.
The Brent M1 contract and the Brent 2027 prices and current price of jet fuel in Europe (ARA). All in USD/b

Our back of the envelope calculation of the global shortage created by the closure of the Strait of Hormuz. Note that 3.5 mb/d of discharge from SPR is also a draw. Note also that ’Forced demand loss’ of 2.5 mb/d is probably temporary and will fall back towards zero as logistics are sorted out leaving ’Price demand loss’ to do the job of balancing the market. Thus a shortfall of at least 9 mb/d created by the closure. More if SPR discharge is included and more if Forced demand loss recedes.

Brent is climbing higher. Front-month is at USD 106.3/bl this morning, close to a weekly high and a USD 9/bl jump from Mondays open. This is the move we flagged as a risk earlier in the week: the market shifting from ”a deal is around the corner” to ”this is going to take longer than we thought”.

Analyst Commodities, SEB
During April, rest-of-year Brent remained remarkably stable around USD 90/bl. A stability which rested on one single assumption: the SoH reopens around 1 May. That assumption is now slowly falling apart.
As we highlighted yesterday: every week of delay beyond 1 May adds (theoretically) ish USD 5/bl to the rest-of-year average, as global inventories draw 100 million barrels per week. i.e., a mid-May reopening implies rest-of-year Brent closer to USD 100/bl, and anything pushing into June or July takes us meaningfully higher.
What’s changed in the last 48 hours:
#1: The US military has formally warned that clearing suspected sea mines from SoH could take up to six months. That is a completely different timescale from what the financial market is pricing. Even a political deal tomorrow does not immediately reopen the strait.
#2: Trump has shifted his tone from urgency to ”strategic patience”. In yesterday’s press conference: ”Don’t rush me… I want a great deal.” The market is reading this as a president no longer feeling pressured by timelines, with the naval blockade running in the background.
#3: So far, the military activity is escalating, not de-escalating. Axios reports Iran is laying more mines in SoH. The US 3rd carrier strike group (USS George H.W. Bush) is arriving with two countermine vessels. Trump yesterday ordered the US Navy to destroy any Iranian boats caught laying mines. While CNN reports that the Pentagon is actively drawing up plans to strike Iranian SoH capabilities and individual Iranian military leaders if the ceasefire collapses. i.e., NOT a attitude consistent with an imminent deal!
Spot crude and product prices eased off the early-April highs on a combination of system rerouting and deal optimism. Both now weakening. Goldman estimates April Gulf output is reduced by 14.5 mbl/d, or 57% of pre-war supply, a number that keeps getting worse the longer this drags on.
Demand-side adaptation is ongoing: S. Korea has cut its Middle East crude dependence from 69% to 56% by pulling more from the Americas and Africa, and Japan is kicking off a second round of SPR releases from 1 May. But SPRs are finite.
Ref. to the negotiations, we should not bet on speed. The current Iranian leadership is dominated by genuine hardliners willing to absorb economic pain and run the clock to extract concessions. That is not a setup for a rapid resolution. US/Israeli media briefings keep framing the delay as ”internal Iranian divisions”, the reality is more complicated and points toward weeks and months, not days.
Our point is that the complexity is large, and higher prices have only just started (given a scenario where the negotiations drag out in time). The market spent April leaning on the USD 90/bl rest-of-year assumption; that case is diminishing by the hour. If ”early May reopening” is replaced by ”June, July or later” over the next week or two, both crude and products have meaningful room to reprice higher from here. There is a high risk being short energy and betting on any immediate political resolution(!).
Down on Friday. Up on Monday. The Brent June crude oil contract traded down 5.1% last week to a close of $90.38/b. It reached a high of $103.87/b last Monday and a low of $86.09/b on Friday as Iran announced that the Strait of Hormuz was fully open for transit. That quickly changed over the weekend as the US upheld its blockade of Iranian oil exports while Iran naturally responded by closing the SoH again. The US blew a hole in the engine room of the Iranian ship TOUSKA and took custody of the ship on Sunday. Brent crude is up 5.6% this morning to $95.4/b.
The cease-fire is expiring tomorrow. The US has said it will send a delegation for a second round of negotiations in Islamabad in Pakistan. But Iran has for now rejected a second round of talks as it views US demands as unrealistic and excessive while the US is also blocking the Strait of Hormuz.
While Brent is up 5% this morning, the financial market is still very optimistic that progress will be made. That talks will continue and that the SoH will fully open by the start of May which is consistent with a rest-of-year average Brent crude oil price of around $90/b with the market now trading that balance at around $88/b.
Financial optimism vs. physical deterioration. We have a divergence where the financial market is trading negotiations, improvements and resolution while at the same time the physical market is deteriorating day by day. Physical oil flows remain constrained by disrupted flows, longer voyage times and elevated freight and insurance costs.
Financial markets are betting that a US/Iranian resolution will save us in time from violent shortages down the road. But every day that the SoH remains closed is bringing us closer to a potentially very painful point of shortages and much higher prices.
The US blockade is also a weapon of leverage against its European and Asian allies. When Iran closed the SoH it held the world economy as a hostage against the US. The US blockade of the SoH is of course blocking Iranian oil exports. But it is also an action of disruption directed towards Europe and Asia. The US has called for the rest of the world to engaged in the war with Iran: ”If you want oil from the Persian Gulf, then go and get it”. A risk is that the US plays brinkmanship with the global oil market directed towards its European and Asian allies and maybe even towards China to force them to engage and take part. Maybe unthinkable. But unthinkable has become the norm with Trump in the White House.


Sommarväder skapar prisrally på elbörsen
Oil product price pain is set to rise as the Strait of Hormuz stays closed into summer

Solkraften pressar elpriserna dagtid

Michel Gubel ger sin syn på oljemarknaden