

Analys
SEB Jordbruksprodukter, 26 augusti 2013

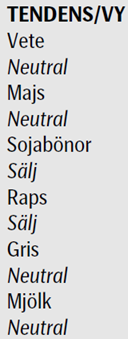
 I detta första veckobrev efter sommaruppehållet går vi över till neutral på vete och majs, men behåller sälj på soja och raps. Raps har rekylerat upp och vi tycker man ska sälja terminer omedelbart. Vetemarknaden lider av nyhetstorka. Skörden av höstvete är klar på hela norra halvklotet och den har varit bra. Det finns inget mer ”ont” som kan hända skörden och inget extra gott heller. Då det inte finns några nyheter som kan ändra bilden, finns heller inte något som kan driva priset uppåt eller nedåt. Från Ryssland, varifrån information bitvis kan vara svårtolkad, kom dock information i veckan som gick. Den 14 augusti justerade den ryske jordbruksministern Nikolaj Fedorov ner produktionsestimatet för spannmål från 95 mt till 90 mt. Han anser att exportpotentialen är 18 – 20 mt. Hittills har 4 mt exporterats, jämfört med 3 mt samma tid förra året. Upp till 80% av den här spannmålsexporten utgörs av vete.
 I övrigt är det från den amerikanska majs- och sojaskörden som informationen kommer. Den informationen påverkar marknaderna för raps och vete via den substitution som finns.
Pro Farmers crop tour avlöpte i veckan som gick. I tisdags var den i Indiana och den var åt det positiva hållet. Delstatens majs och sojabönor såg bra ut. Den estimerade avkastningen för majsen var 167.36 bu/acre, baserat på 180 stickprov. Förra året estimerade touren avkastningen till 113.25 bu/acre. Det treåriga genomsnittet är 141.14 bu/acre.
Soybean pod count, beräknad inom en 3 x 3 fots kvadrat, var 1,185.14, baserat på 175 stickprov. Förra årets tour uppmätte 1,033 pods och det treåriga genomsnittet är 1,136. I Iowa var det sämre ställt med sojabönorna. Typiskt sett var det bara 3 – 4 bönor per balja, mot normala 6 – 7. Illinois var också en negativ upplevelse. Marknaden tar säkert fasta på detta i det korta perspektivet.
Odlingsväder
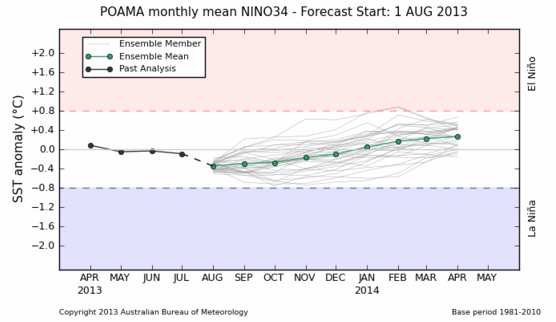
Det blev ingen La Niña i sommar, inte ens lite grand. Ensembleprognosen visar att det inte blir någon under sommaren på södra halvklotet heller.
Nedan ser vi andelen av USA som är drabbat av torka. Den övre kurvan visar andelen som är drabbat av någon form av torka och den nedre visar den andel som är drabbat av de två värsta formerna av torka, ”extrem” och ”exceptionell”.
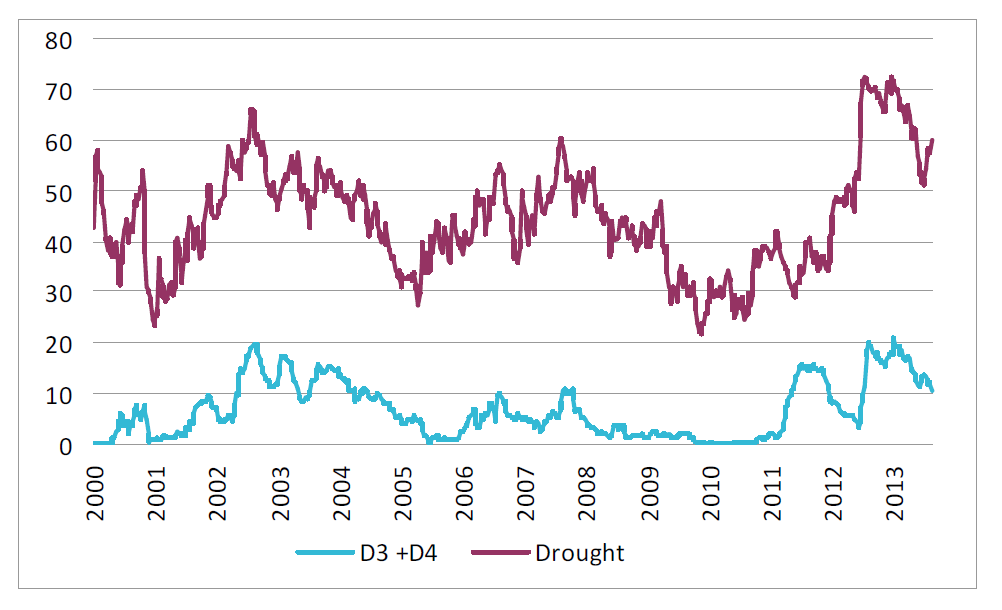
Som vi ser har torkan ökat från slutet av juli i USA, men inte den extrema varianten.
Nedan ser vi 15 dagars prognos för avvikelsen i nederbörd mot det normala i Nordamerika, enligt GFSmodellen.
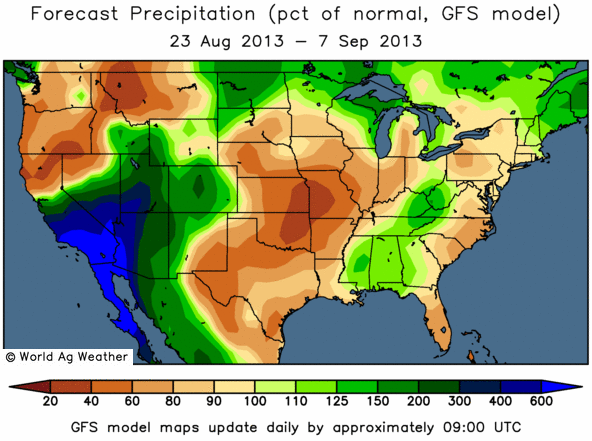
Vi ser att det kommer att vara torrare än normalt i präriedelen av Mellanvästern och i South West. Det kommer också att vara varmare än normalt. Man kanske instinktivt tänker att detta inte är bra (priser upp). Men värme gör att sent sådd majs och soja mognar snabbare och detta är positivt. En omogen och sen skörd är inte bra för avkastningen heller.
Vete
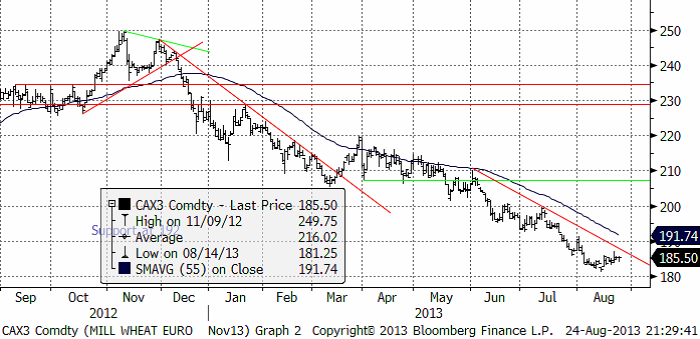
November vetet på Matif har funnit tekniskt stöd vid 180 euro per ton. Om man frågar vem som helst i branschen vid vilket pris vetet bör ligga (som lägst) är svaret ”180 euro per ton”. Det amerikanska vetet handlas dock lägre än så, som man kan se nedan, om man räknar om priset till euro per ton. Kanske är ”180 euro per ton” bara något som bara finns i folks medvetande.
Regn i Tyskland har gjort att organisationen DBV varnat för proteinnivåerna i veteskörden, men stöder annars DRV:s estimat på veteskörden om 23.9 mt.
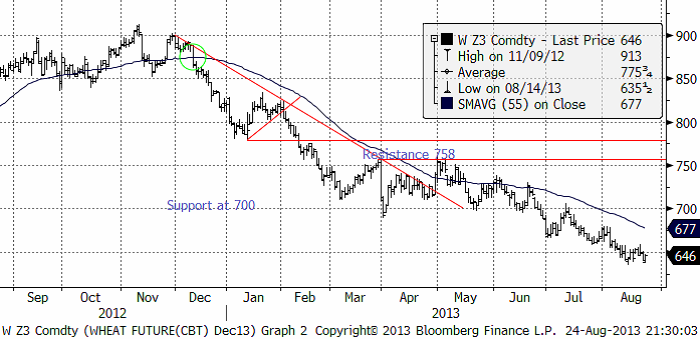
Decemberkontraktet på CBOT stängde i fredags på 646 cent per bushel. Det motsvarar 1500 kr per ton, eller ca 165 euro per ton.
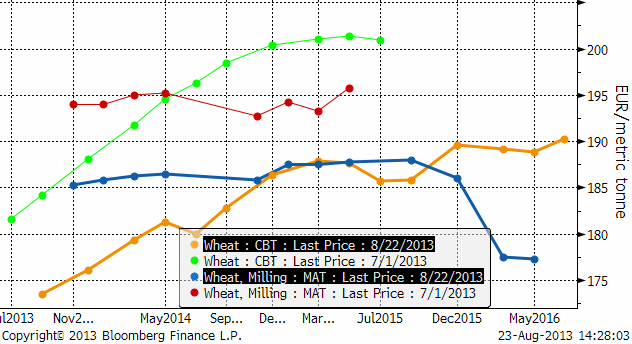
Nedan ser vi terminskurvorna för Chicagovete och Matif-vete per den 1 juli och nu, omräknat till priser i euro per ton. Notera att det inte riktigt finns något contango (terminspåslag över spot) i Matifmarknaden. Notera också det mycket lägre priset för ny skörd 2014/15 på Matif! Det här är orsakat av fel i data. Det finns ännu ingen handel på den löptiden.
Vi tror att det finns ytterligare nedåtpotential i Matifvetet, men eftersom det inte finns något nyhetsflöde, kan denna justering bli trög, eller helt utebli. Vi går därför över till neutral rekommendation.
Det finns de som nu tänker lagra sin spannmål och som jag visade i boken ”Bättre betalt för skörden -riskhantering för lantbrukare”, finns ett contango i Chicago-marknaden som kan ge en lönsamhet. Historiskt har det ingen bra idé att lagra spannmål utan prissäkring, ens om den är ”billigare” än den varit tidigare.
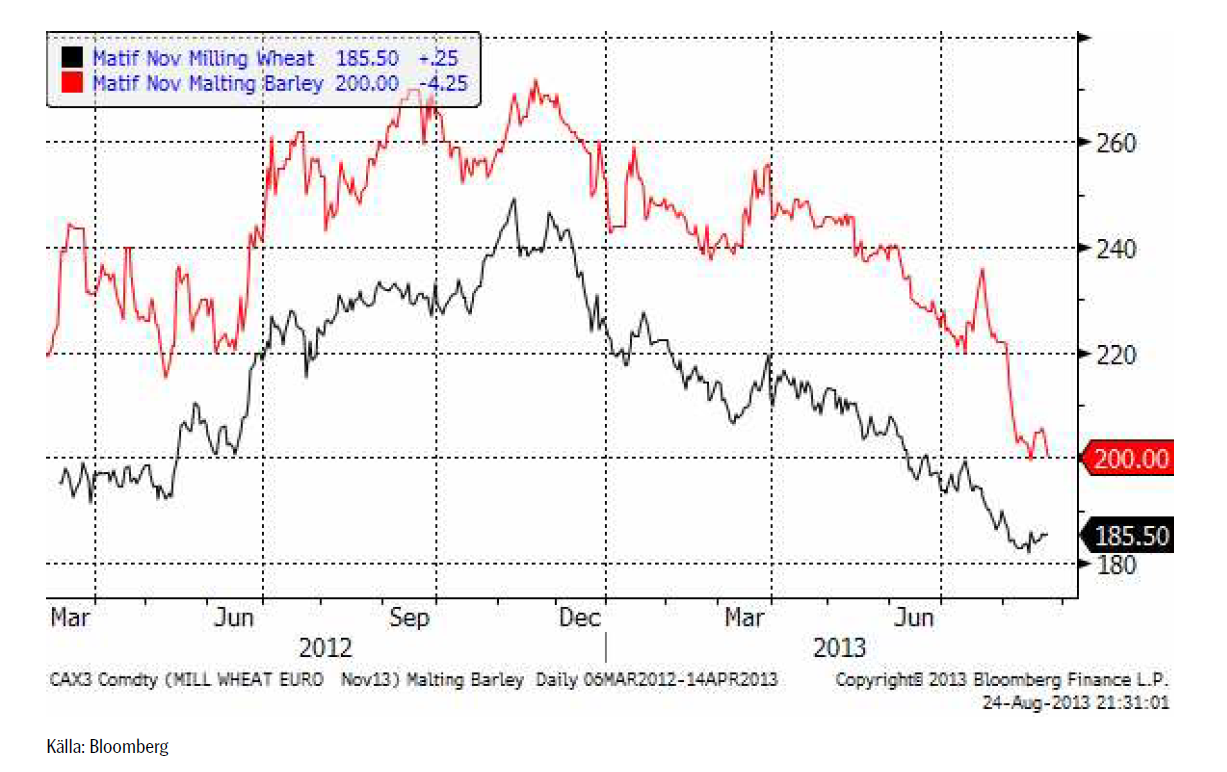
Maltkorn
Maltkornet har fallit rejält – även i förhållande till vetet. För ölälskaren finns dock smolk. Tysklands skörd av humle är 40% mindre än normalt, rapporterade DBV förra veckan.
Majs
Majspriset (december 2013) steg initialt förra veckan på den allmänna rekyl uppåt som noterats i flera råvarumarknader som t ex guld, basmetaller och råolja, men föll sedan tillbaka. Det tekniska motståndet (inritat som röd horisontell linje i diagrammet nedan) höll. Idag, måndag gör marknaden ett nytt test av nivån. Ett brott uppåt skulle kunna ta priset till ca 500 – 516 cent per bushel.
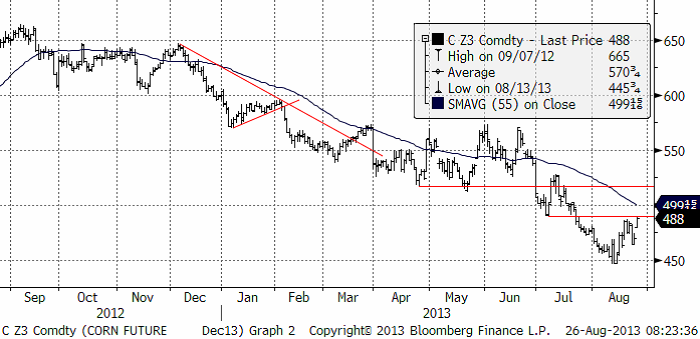
Den observante läsaren minns kanske analysen i det här veckobrevet av WASDE-rapporten i maj. Där skrev vi att majspriset troligtvis skulle gå till 400 cent / bushel mot bakgrund av att lagren väntades öka till en nivå där 400 cent / bushel historiskt sett varit det normala. 450 cent är ur en risktagares perspektiv ”nära nog”. Den som är girig och vill hämta hem den allra sista pengen, kan gå miste om allt, så vi lämnar vår säljrekommendation och går över till neutral rekommendation.
Väderleksprognoserna visar fortsatt varmt väder i USA, vilket spontant kan tolkas som negativt. Efter ProFarmer crop tour, som påminde om att sådden skedde sent, kan värme dock tolkas som positivt, eftersom det gynnar tillväxten och skyndar på växten och minskar tiden till mognad och skörd.
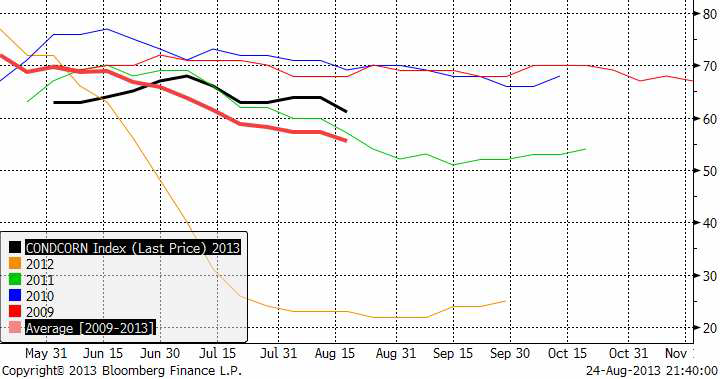
61% av majsskörden är i ”good” eller ”excellent condition”, vilket är lite lägre än veckan innan.
Som nämnt ovan går vi alltså över till neutral rekommendation.
Sojabönor
Sojan har handlats upp rejält och bröt idag måndag det tekniska motståndet. Mycket av rörelsen är redan avklarad. 1400 cent per bushel är ett starkt motstånd och den ”flagga” av sidledes konsolidering som skedde kring 1300 cent, som brukar uppträda halvvägs i en rörelse, visar att prisuppgången nu praktiskt taget är klar. Det är ungefär lika långt från början av rörelsen (1200) upp till flaggan (vid 1300) som det är mellan 1300 och där priset är nu (nästan 1400).
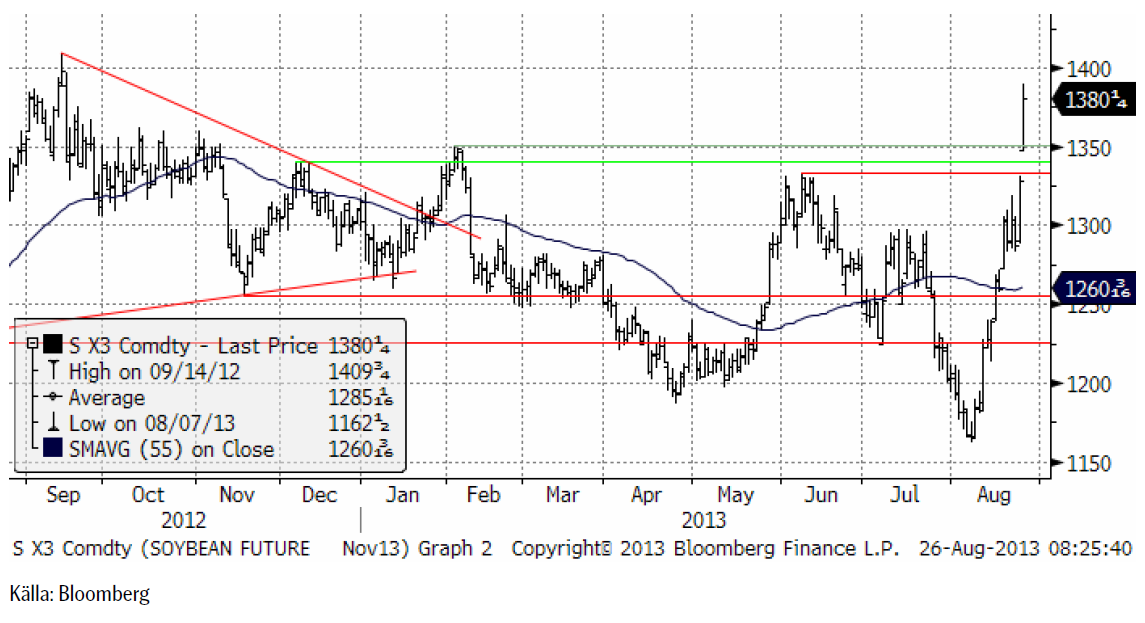
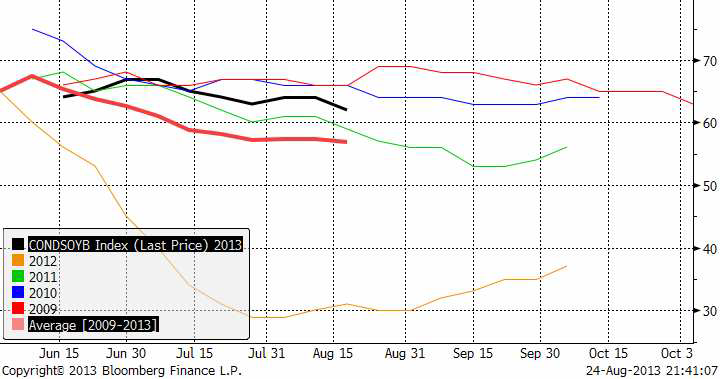
62% av sojaskörden i USA är i ”good” eller ”excellent condition”, vilket är lite lägre än veckan innan, men väsentligt högre än genomsnittet för åren 2009 – 2013. Det ser ut att kunna bli en bra skörd. Däremot kommer säkerligen den förnyade torkan att ytterligare sänka crop rating i kvällens rapport. Kanske ner mot 61% eller 60%.
Slutsatsen, då uppgången troligtvis är avklarad till stor del, är att vi väljer en säljrekommendation, snarare än en neutral-rekommendation.
Raps
Rapspriset lär öppna upp idag på Matif. Rapspriset (November 2013) har rekylerat uppåt mot 380 euro per ton. 55-dagars glidande medelvärde, som många tittar på ligger strax ovanför. Sammantaget ger detta bilden av en marknad som har sträckt sig så långt uppåt som den kan just nu. Den huvudsakliga trenden är nedåtriktad och vi har sett EN rekyl uppåt, den som pågått sedan början av augusti. Det handlar med största sannolikhet om en rekyl och när den är färdig, bär det av nedåt igen. Det är ett säljläge just nu!
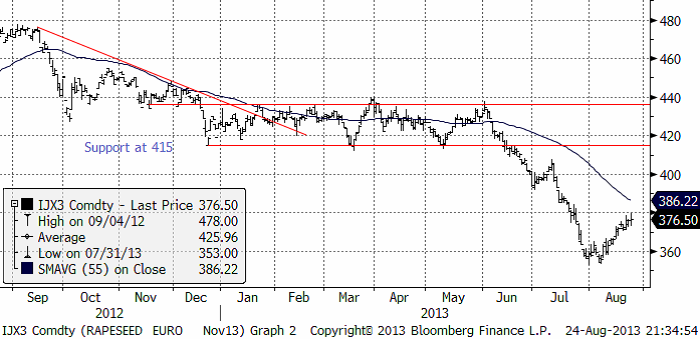
Stats Canada rapporterade i förra veckan en estimerad produktion på 14.7 mt. Det är 22% större än förra årets skörd.
Säljrekommendation på raps just nu alltså – köp av BEAR RAPS X4 S
Potatis
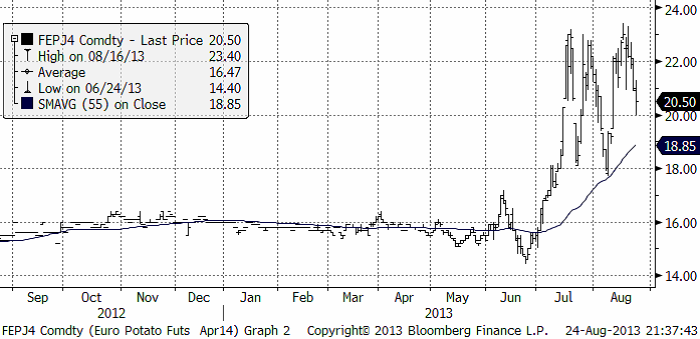
Jag brukar inte skriva om potatis, eftersom det aldrig varit någon som intresserat sig för prissäkring av potatis. Potatismarknaden är igång en kort period varje år, mellan oktober och april, ungefär. Korrelationen mellan det tyska kontraktet nedan och svensk matpotatis är mycket hög, ungefär 0.8 på årsbasis, mellan år.
Prisförändringar sker under sommaren. Så har skett även i sommar. Eftersom det varit perfekt semesterväder, har det inte varit bra för potatisen, vare sig i Tyskland eller Sverige (hög korrelation på semesterväder i Tyskland och Sverige). Det har fått priset att gå upp från 16 euro per deciton till 20 – 22 euro per ton för leverans i april nästa år, dvs för årets skörd. Kul för de producenter som aldrig brytt sig om att prissäkra. Mindre trevligt för köpare. Nästa år kan det gå åt andra hållet.
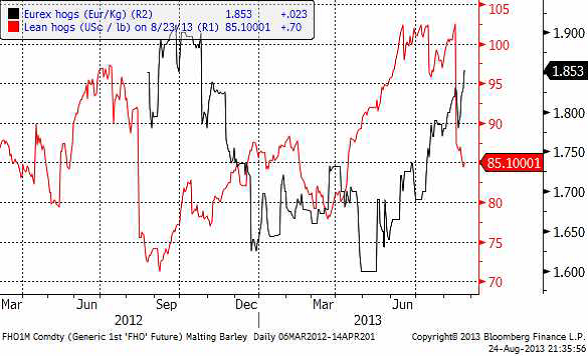
Gris
Lean hog, som tycks vara lite av en ledande indikator för de tyska grispriserna, har rasat med 15% i augusti. Eurexpriserna har däremot fortsatt upp och ligger nu på 1.85 euro per kilo för ”spotleverans”.
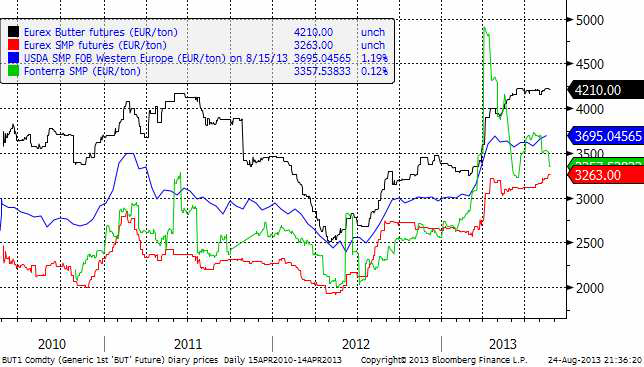
Mjölk
Botulism-bakterier har påträffats i Nya Zeelands mjölkindustri, vilket antagligen beror på otur i en mycket omfattande näringsverksamhet. Detta medför dock att ”spreaden” mellan Fonterrapriser och Eurexpriser går ihop. Det har påverkat Eurex SMP positivt. Det är allmänt positivt för svensk mjölk.
Foderpriserna har fortsatt att falla under sommaren, som vi sett ovan. I våras var bilden klar att de kommande åren kommer att innebära goda priser på mjölk och i synnerhet väsentligt lägre priser på proteinfoder och spannmål. Den här bilden har fortsatt att stärkas.
Socker
International Sugar Organization, baserad i London, publicerade sin senaste kvartalsrapport i torsdags (22 augusti). Enligt den kommer marknadsföringsåret 2013/14 (som löper från oktober till september) att bli det fjärde året med högre produktion än konsumtion på global basis. Sockerproduktionen väntas överstiga konsumtionen med 4.5 mt under 2013/14. Det är 1 mt högre än förra månaden, när organisationens estimat på överskottet var 4.5 mt. Innevarande år, 2012/13, är överskottet estimerat till 10.3 mt. ISO sade att ”It seems that a lower global surplus per se cannot be treated as a price supportive factor and the market may record further losses during the 2013/14 season”. ISO estimerar att global produktion faller med 1.2% till 180.8 mt. Det är den första minskningen sedan 2008/09. Efterfrågan ökar samtidigt med 2.1% till 176.3 mt. Detta innebär att globala lager ökar med 0.5% till 74.4 mt vid utgången av 2013/14 (sista september nästa år), men lager i förhållande till konsumtion minskar faktiskt från 42.9% till 42.2%, enligt ISO.
De låga priserna har alltså haft en effekt på produktionen, huvudsakligen där betor odlas, eftersom detta till skillnad från sockerrör är en ettårig växt. Ukrainas produktion väntas av ISO minska med 21% till 1.9 mt.
Indiens produktion väntas också minska, men i Brasilien väntas produktionen faktiskt öka med 2% till 41.1 mt. Både Indien och Brasilien bedriver ekonomisk politik som är oekonomisk med fallande valuta som följd. Produktion och export av jordbruksprodukter blir då en uppenbar källa till inkomster för Brasilien. Indien har däremot ett ineffektivt regelverk, som inte stimulerar på samma sätt.
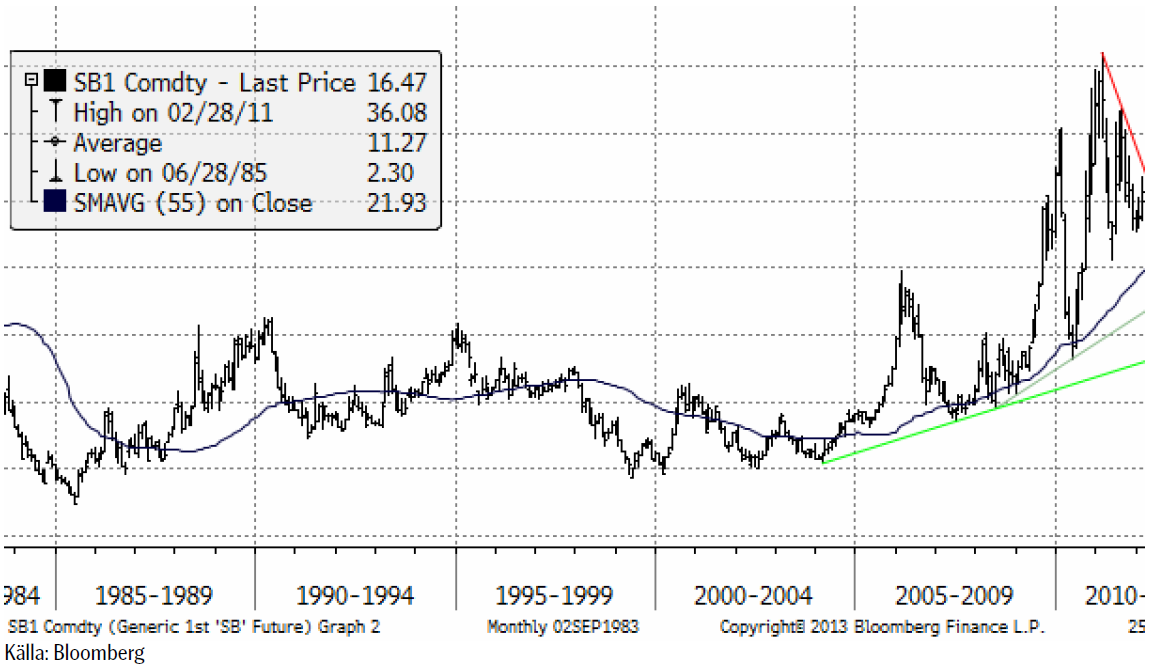
Råvarugurun Jim Rogers nämnde socker som en intressant råvara att investera i, i en intervju i Economic Times förra veckan. Nedan ser vi prisutvecklingen på socker (cent per pund) de senaste 30 åren. Vi ser att prisnivån 15 cent tycks vara en nivå som ömsom varit ett motstånd och ömsom en stödnivå.
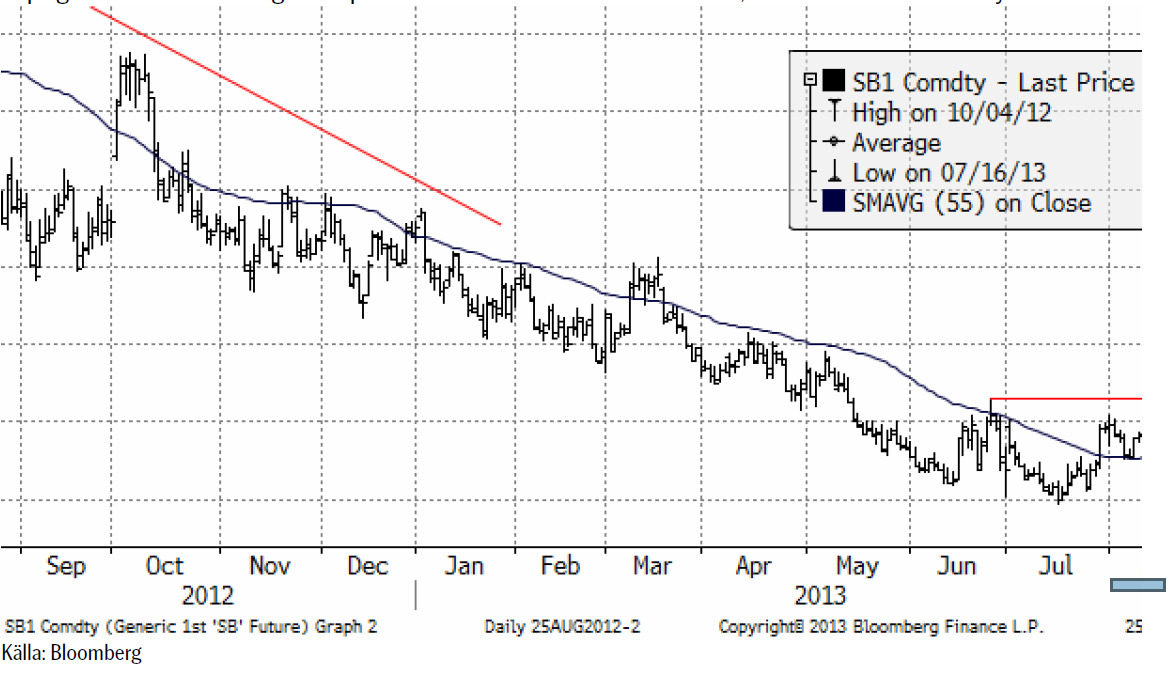
Det senaste årets kursutveckling för spotkontraktet ser vi nedan. Marknaden gjorde ett test av en motståndsnivå i mitten av augusti, men rekylerade tillbaka. Ett brott av den motståndsnivån skulle ge oss en köpsignal och en anledning att köpa BULL SOCKER X4 S eller SOCKER S, om man inte vill ta så mycket risk.
Vi fortsätter med neutral rekommendation.
Gödsel
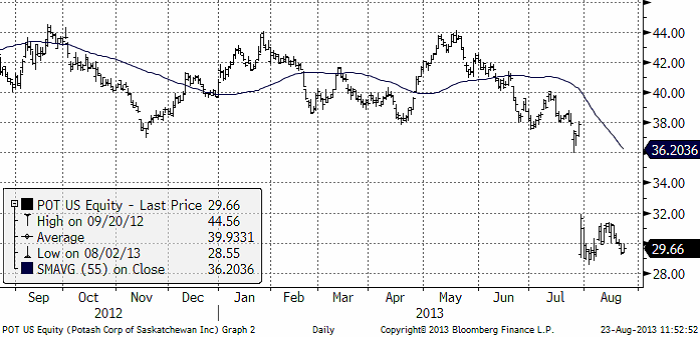
Den internationella potash-kartellen (kalium) föll samman i slutet av juli. Den direkta konsekvensen tycks mest ha påverkat producentbolagens aktiekurser. ”POT” föll från 38 dollar till 30 på ett par dagar. Vi ser kursdiagrammet nedan:
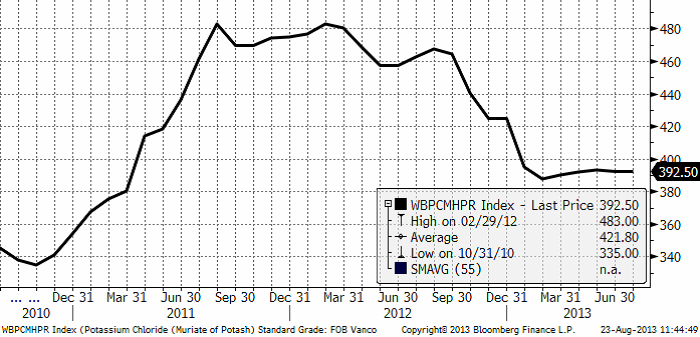
För Yara, som är ett bolag som köper kalium för gödselblandningar hade detta ingen effekt – om någon, något positiv (aktien gick upp lite, efter några dagar). Däremot tycks inte priset på kalium ha påverkats – än – som vi ser i prisdiagrammet på kaliumklorid nedan (standard grade, fob Vancouver, spot price) i USD/ton.
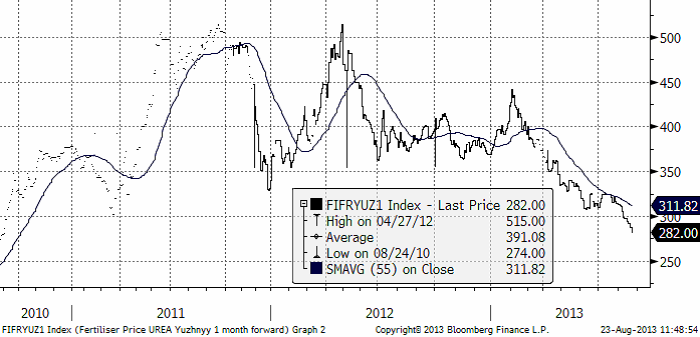
Med fallande priser på spannmål har priset på urea fortsatt att falla. Nedan ser vi priset på urea FOB Yuzhnyy, 1 månads termin, i dollar / ton.
[box]SEB Veckobrev Jordbruksprodukter är producerat av SEB Merchant Banking och publiceras i samarbete och med tillstånd på Råvarumarknaden.se[/box]
Disclaimer
The information in this document has been compiled by SEB Merchant Banking, a division within Skandinaviska Enskilda Banken AB (publ) (“SEB”).
Opinions contained in this report represent the bank’s present opinion only and are subject to change without notice. All information contained in this report has been compiled in good faith from sources believed to be reliable. However, no representation or warranty, expressed or implied, is made with respect to the completeness or accuracy of its contents and the information is not to be relied upon as authoritative. Anyone considering taking actions based upon the content of this document is urged to base his or her investment decisions upon such investigations as he or she deems necessary. This document is being provided as information only, and no specific actions are being solicited as a result of it; to the extent permitted by law, no liability whatsoever is accepted for any direct or consequential loss arising from use of this document or its contents.
About SEB
SEB is a public company incorporated in Stockholm, Sweden, with limited liability. It is a participant at major Nordic and other European Regulated Markets and Multilateral Trading Facilities (as well as some non-European equivalent markets) for trading in financial instruments, such as markets operated by NASDAQ OMX, NYSE Euronext, London Stock Exchange, Deutsche Börse, Swiss Exchanges, Turquoise and Chi-X. SEB is authorized and regulated by Finansinspektionen in Sweden; it is authorized and subject to limited regulation by the Financial Services Authority for the conduct of designated investment business in the UK, and is subject to the provisions of relevant regulators in all other jurisdictions where SEB conducts operations. SEB Merchant Banking. All rights reserved.

Brent is climbing higher. Front-month is at USD 106.3/bl this morning, close to a weekly high and a USD 9/bl jump from Mondays open. This is the move we flagged as a risk earlier in the week: the market shifting from ”a deal is around the corner” to ”this is going to take longer than we thought”.

Analyst Commodities, SEB
During April, rest-of-year Brent remained remarkably stable around USD 90/bl. A stability which rested on one single assumption: the SoH reopens around 1 May. That assumption is now slowly falling apart.
As we highlighted yesterday: every week of delay beyond 1 May adds (theoretically) ish USD 5/bl to the rest-of-year average, as global inventories draw 100 million barrels per week. i.e., a mid-May reopening implies rest-of-year Brent closer to USD 100/bl, and anything pushing into June or July takes us meaningfully higher.
What’s changed in the last 48 hours:
#1: The US military has formally warned that clearing suspected sea mines from SoH could take up to six months. That is a completely different timescale from what the financial market is pricing. Even a political deal tomorrow does not immediately reopen the strait.
#2: Trump has shifted his tone from urgency to ”strategic patience”. In yesterday’s press conference: ”Don’t rush me… I want a great deal.” The market is reading this as a president no longer feeling pressured by timelines, with the naval blockade running in the background.
#3: So far, the military activity is escalating, not de-escalating. Axios reports Iran is laying more mines in SoH. The US 3rd carrier strike group (USS George H.W. Bush) is arriving with two countermine vessels. Trump yesterday ordered the US Navy to destroy any Iranian boats caught laying mines. While CNN reports that the Pentagon is actively drawing up plans to strike Iranian SoH capabilities and individual Iranian military leaders if the ceasefire collapses. i.e., NOT a attitude consistent with an imminent deal!
Spot crude and product prices eased off the early-April highs on a combination of system rerouting and deal optimism. Both now weakening. Goldman estimates April Gulf output is reduced by 14.5 mbl/d, or 57% of pre-war supply, a number that keeps getting worse the longer this drags on.
Demand-side adaptation is ongoing: S. Korea has cut its Middle East crude dependence from 69% to 56% by pulling more from the Americas and Africa, and Japan is kicking off a second round of SPR releases from 1 May. But SPRs are finite.
Ref. to the negotiations, we should not bet on speed. The current Iranian leadership is dominated by genuine hardliners willing to absorb economic pain and run the clock to extract concessions. That is not a setup for a rapid resolution. US/Israeli media briefings keep framing the delay as ”internal Iranian divisions”, the reality is more complicated and points toward weeks and months, not days.
Our point is that the complexity is large, and higher prices have only just started (given a scenario where the negotiations drag out in time). The market spent April leaning on the USD 90/bl rest-of-year assumption; that case is diminishing by the hour. If ”early May reopening” is replaced by ”June, July or later” over the next week or two, both crude and products have meaningful room to reprice higher from here. There is a high risk being short energy and betting on any immediate political resolution(!).
Down on Friday. Up on Monday. The Brent June crude oil contract traded down 5.1% last week to a close of $90.38/b. It reached a high of $103.87/b last Monday and a low of $86.09/b on Friday as Iran announced that the Strait of Hormuz was fully open for transit. That quickly changed over the weekend as the US upheld its blockade of Iranian oil exports while Iran naturally responded by closing the SoH again. The US blew a hole in the engine room of the Iranian ship TOUSKA and took custody of the ship on Sunday. Brent crude is up 5.6% this morning to $95.4/b.

The cease-fire is expiring tomorrow. The US has said it will send a delegation for a second round of negotiations in Islamabad in Pakistan. But Iran has for now rejected a second round of talks as it views US demands as unrealistic and excessive while the US is also blocking the Strait of Hormuz.
While Brent is up 5% this morning, the financial market is still very optimistic that progress will be made. That talks will continue and that the SoH will fully open by the start of May which is consistent with a rest-of-year average Brent crude oil price of around $90/b with the market now trading that balance at around $88/b.
Financial optimism vs. physical deterioration. We have a divergence where the financial market is trading negotiations, improvements and resolution while at the same time the physical market is deteriorating day by day. Physical oil flows remain constrained by disrupted flows, longer voyage times and elevated freight and insurance costs.
Financial markets are betting that a US/Iranian resolution will save us in time from violent shortages down the road. But every day that the SoH remains closed is bringing us closer to a potentially very painful point of shortages and much higher prices.
The US blockade is also a weapon of leverage against its European and Asian allies. When Iran closed the SoH it held the world economy as a hostage against the US. The US blockade of the SoH is of course blocking Iranian oil exports. But it is also an action of disruption directed towards Europe and Asia. The US has called for the rest of the world to engaged in the war with Iran: ”If you want oil from the Persian Gulf, then go and get it”. A risk is that the US plays brinkmanship with the global oil market directed towards its European and Asian allies and maybe even towards China to force them to engage and take part. Maybe unthinkable. But unthinkable has become the norm with Trump in the White House.
Wild moves yesterday. Brent crude traded to a high of $114.43/b and a low of $96.0/b and closed at $99.94/b yesterday.
US – Iran negotiations ongoing or not? What a day. Donald Trump announced that good talks were ongoing between Iran and the US and that the 48 hour deadline before bombing Iranian power plants and energy infrastructure was postponed by five days subject to success of ongoing meetings. Iranian media meanwhile stated that no meetings were ongoing at all.
Today we are scratching our heads trying to figure out what yesterday was all about.
Friends and family playing the market? Was it just Trump and his friends and family who were playing with oil and equity markets with $580m and $1.46bn in bets being placed by someone in oil and equity markets just 15 minutes before Trump’s announcement?
Was Trump pulling a TACO as he reached his political and economic pain point: Brent at $112/b, US Gas at $4/gal, SPX below 200dma and US 10yr above 4.4%?
Different Iranian factions with Trump talking with one of them? Are there real negotiations going on but with the US talking to one faction in Iran while another, the hardliners, are not involved and are denying any such negotiations going on?
Extending the ultimatum to attack and invade Kharg island next weekend? Or, is the five day delay of the deadline a tactical decision to allow US amphibious assault ships and marines to arrive in the Gulf in the upcoming weekend while US and Israeli continues to degrade Iranian military targets till then. And then next weekend a move by the US/Israel to attack and conquer for example the Kharg island?
We do not really know which it is or maybe a combination of these.
We did get some kind of TACO ydy. But markets have been waiting for some kind of TACO to happen and yesterday we got some kind of TACO. And Brent crude is now trading at $101.5/b as a result rather than at $112-114/b as it did no the high yesterday.
But what really matters in our view is the political situation on the ground in Iran. Will hardliners continue to hold power or will a more pragmatic faction gain power?
If the hardliners remain in power then oil pain should extend all the way to US midterm elections. The hardliners were apparently still in charge as of last week. Iran immediately retaliated and damaged LNG infrastructure in Qatar after Israel hit Iranian South Pars. The SoH was still closed and all messages coming out of Iran indicated defiance. Hardliners continues in power has a huge consequence for oil prices going forward. The regime has played its ’oil-weapon’ (closing or chocking the Strait of Hormuz). It is using it to achieve political goals. Deterrence: it needs to be so politically and economically expensive to attack Iran that it won’t happen again in the future. Or at least that the US/Israel thinks 10-times over before they attack again. The highest Brent crude oil closing price since the start of the war is $112.19/b last Friday. In comparison the 20-year inflation adjusted Brent price is $103/b. So Brent crude last Friday at $112.19/b isn’t a shockingly high price. And it is still far below the nominal high of $148/b from 2008 which is $220/b if inflation adjusted. So once in a lifetime Iran activates its most powerful weapon. The oil weapon. It needs to show the power of this weapon and it needs to reap political gains. Getting Brent to $112/b and intraday high of $119.5/b (9 March) isn’t a display of the power of that weapon. And it is not a deterrence against future attacks.
So if the hardliners remain in power in Iran, then the SoH will likely remain chocked all the way to US midterm elections and Brent crude will at a minimum go above the historical nominal high of $148/b from 2008.
Thus the outlook for the oil price for the rest of the year doesn’t depend all that much of whether Trump pulls a TACO or not. Stops bombing or not. It depends more on who is in charge in Iran. If it is the hardliners, then deterrence against future attacks via chocking of the SoH and high oil prices is the likely line of action. It is impacting the world but the Iranian ’oil-weapon’ is directed towards the US president and the the US midterm elections.
If a pragmatic faction gets to power in Iran, then a very prosperous future is possible. However, if power is shifting towards a more pragmatic faction in Iran then a completely different direction could evolve. Such a faction could possibly be open for cooperation with the US and the GCC and possibly put its issues versus Israel aside. Then the prosperity we have seen evolving in Dubai could be a possible future also for Iran.
So far it looks like the hardliners are fully in charge. As far as we can see, the hardliners are still fully in control in Iran. That points towards continued chocking of the SoH and oil prices ticking higher as global inventories (the oil market buffers) are drawn lower. And not just for a few more weeks, but possibly all the way to the US midterm elections.


Brent crude up USD 9/bl on the week… ”deal around the corner” narrative fades
Market Still Betting on Timely Resolution, But Each Day Raises Shortage Risk

Christian Kopfer om läget för oljan

Marknaden måste börja betrakta de höga kopparpriserna som det nya normala

Det fysiska spotpriset på brentolja har slagit nytt rekord

40 minuter med Javier Blas om hur världen verkligen påverkas av energikrisen
Det fysiska spotpriset på brentolja har slagit nytt rekord
Marknaden måste börja betrakta de höga kopparpriserna som det nya normala
Christian Kopfer om läget för oljan

Efter tillväxten: Guldbrev satsar på expansion i Europa
-
 Nyheter3 veckor sedan
40 minuter med Javier Blas om hur världen verkligen påverkas av energikrisen
-
 Nyheter3 veckor sedan
Det fysiska spotpriset på brentolja har slagit nytt rekord
-
 Nyheter3 veckor sedan
Marknaden måste börja betrakta de höga kopparpriserna som det nya normala
-
 Nyheter2 veckor sedan
Christian Kopfer om läget för oljan
-
 Nyheter3 veckor sedan
Efter tillväxten: Guldbrev satsar på expansion i Europa
-
Analys6 dagar sedan
Market Still Betting on Timely Resolution, But Each Day Raises Shortage Risk
-
Analys2 dagar sedan
Brent crude up USD 9/bl on the week… ”deal around the corner” narrative fades