

Analys
SHB Råvarubrevet 23 augusti 2013

 Råvaror allmänt
Har katalysatorn kommit?
Ekonomisk data har förbättrats i de tre stora regionerna USA, Europa och Kina samtidigt som dollarn har försvagats och geopolitisk oro råder (i Egypten, Irak och Iran), det är en perfekt cocktail för stigande råvarupriser. (En cocktail ska som bekant bestå av tre ingredienser varav en skall vara starkare).
Vi har favoriserat kinaexponerade råvaror under hela året utan stor framgång. Vi har väntat på en katalysator som skulle driva på marknaden som stirrat sig blind på Kinas fallande BNP. Nu har juli månads data från Kina varit bra och följts upp av ett preliminärt starkare inköpschefsindex för augusti (50.1 mot juli 47.7). Kanske är detta de första tecknen på att Kinas ekonomi stabiliseras och kommer fortsätta starkare snarare än svagare under resten av året. I så fall har basmetallerna en given uppsida där nickel har potential att stiga med 10-15%.
Basmetaller
Kina i fokus
Veckans preliminära PMI (inköpschefsindex) från Kina överraskade marknaden och vände en fallande trend. Trots det stannar metallerna på minus denna vecka där nickel har haft det tuffast med – 4%, följt av aluminium på -3,5%. Vi ser dock ljust på framtiden där ett starkare Kina ger stöd åt basmetallerna. Det kommer klara signaler från kinesiska ledare där de kommer försvara den lägsta tillåtna tillväxten plus att de tycks oroade att inbromsningen gått för långt och för snabbt.
Troligt nu är att ledarna kommer att finjustera ekonomin så att den uppvisar stabilisering eller uppgång under Q3. Den sena uppgången i PMI förklarar vi med att det råder en stor pessimism i systemet kring Kina och det tar tid att mentalt svänga om till mer positiv anda. Denna effekt kan man utnyttja och handla basmetaller på.
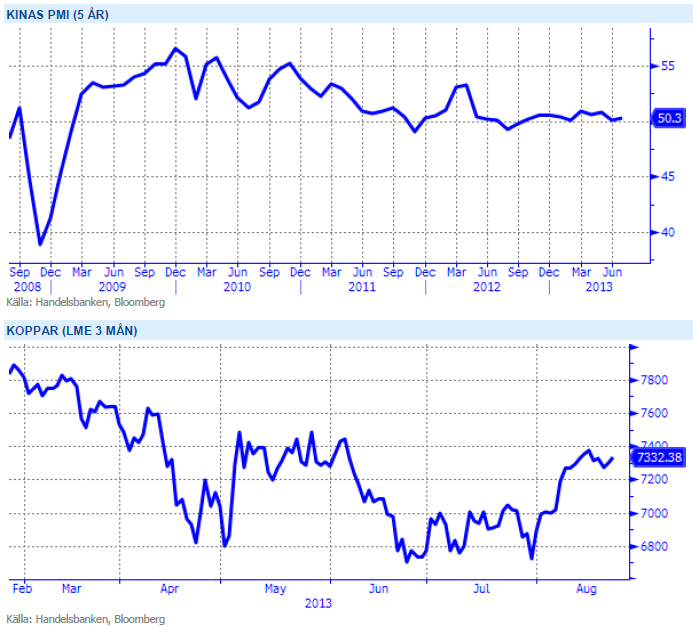
Nickel är den basmetall som gått ner mest under året och med många gruvor som går med förlust på dagens prisnivåer tror vi på stigande priser. Vi tror på: LONG NICKEL H
Ädelmetaller
Guld, alltjämt konstruktiv prisutveckling!
Förra veckan knöt vi an till vårt köpcase för guld, som går emot vår mer basala långsiktiga vy, och som innebär att vi tror att 1450 dollar per uns är en rimlig nivå. Denna veckan har guldet spenderat i ett tight och händelselöst prisintervall mellan 1355 och 1375, men nu på eftermiddagen tog det ny fart uppåt. I skrivande stund ligger vi strax under 1400 dollar, och vi ser ingen anledning till att revidera vare sig vår kortsiktiga vy (minst 1450 dollar), eller vår mer lånsiktiga skepsis. Men för tillfället handlar vi i en bekväm upptrend, och varken Feds protokoll tidigare i veckan, eller inkommande makrodata har gjort något för att ändra denna trenden.
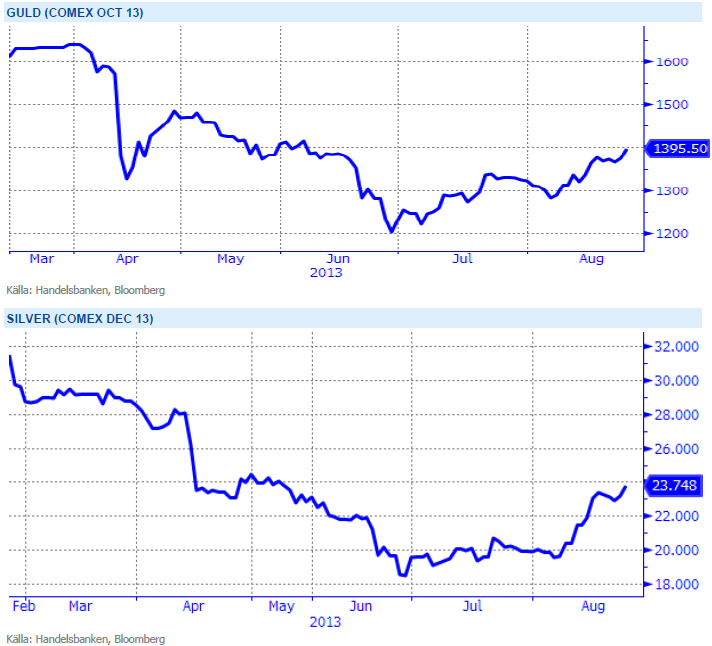
I ett läge där råvaror generellt har viktats ned av institutionella placerare kan guld och silver få en ”omotiverad” uppgång när dessa indexköpare återvänder till råvaror drivit av bättre utsikter för Kina och USA. Vi tror på: LONG GULD H och LONG SILVER H
Energi
Osäkerhet kring energibalansen
SHB Power stiger med 1.5% under veckan på osäkerhet kring energibalansen då låga nederbördsmängder riskerar att försämra energibalansen med 5-6 TWh till ett underskott om -11 TWh. Såväl kol som utsläppsrätter handlas oförändrat men potentialen bör finnas på uppsidan med nuvarande väderprognos. Under årets energidagar i Oslo verkade de flesta överens om att det låga priset på el kommer att bestå fram till 2020. Förnyelsebara investeringar i kombination med ny finsk kärnkraft skapar överskott vilket till viss del balanseras av kolpriskurvan men lägre risk för elprischocker. Skärpta utsläppskrav efter 2020 och utfasning av svenska kärnkraftsverk är en stor osäkerhet men de långa prognoserna har justerats ned till ca 34-35 öre per kWh.
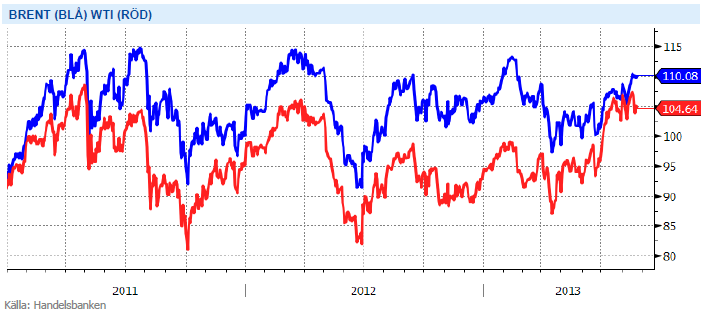
Oljan handlas oförändrat under veckan men geopolitisk risk, starkare ledande indikatorer för OECD och låg reservkapacitet inom OPEC talar för ett fortsatt starkt oljepris. Orkansäsong i USA och säsongsmässigt högre efterfrågan på oljeprodukter i OECD gynnar också bilden för olja. Intressant att se hur snabbt gapet mellan Brent och WTI minskat under sommaren. Från att ha varit närmare 0 i mitten av juli handlas spreaden nu på strax över 5 dollar att jämföra med förra årets snitt om 19 dollar och hela 27.88 dollar som lägst i november 2011. Anledningen till varför vi haft en så stor prisskillnad under 2011 och 2012 är transportbegränsningar i USA som försvårat möjligheten att få ut WTI oljan. En ökad skifferproduktion i kombination med ett lägre kapacitetsutnyttjande hos raffinaderierna har då skapat ett lokalt överskott och pressat WTI marknaden till skillnad från Nordsjöoljan Brent som är en fraktad olja och bättre kan täppa till eventuella arbitragefönster. Detta innebär exempelvis att Brent reagerar mer vid politisk oro och produktionsstörningar. Flera amerikanska infrastrukturella projekt har kommit på plats under 2013 såsom pipelines och förbättrade järnvägslänkar vid terminalerna samtidigt som lokala raffinaderier ökat körningen till nivåer vi inte sett sedan 2007. En förbättrad infrastruktur har också givit lokala raffinaderier tillgång till inhemsk olja av Brent kvalité (dvs light) vilken då ersatt behovet av Brent.
Utsikterna framöver pekar på ett torrare scenario mot normalt vilket i kombination med något starkare kontinentala marknader bör ge fortsatt stöd. Vi tror på: LONG EL
Livsmedel
Volatil jordbruksmarknad
Terminspriserna på vete har gått ned något under veckan i både Chicago och Paris. Skörden av höstvete i USA är nu i princip helt klar och vårveteskörden går raskt framåt med bara några få småskurar i vissa områden. Avkastningen på vårvetet uppges vara något över förväntan. Statistics Canada uppskattar landets totala veteskörd till den största veteskörden i Kanada sedan 1991. Australien har bra väderförhållanden för vetet i de södra och sydvästra delarna av landet. Även i Argentina önskas mer regn på redan sådd gröda. I Ukraina är veteskörden i stort sett klar. Den ryska skörden går framåt och både kvalitet och avkastning uppges ha förbättrats under den senaste tiden. Även i EU går skörden framåt i bra fart, i Storbritannien uppges dock (som vanligt) småskurar fördröja skörden. Både avkastning och kvalitet uppges vara hög. Vetepriserna kommer fortsätta att påverkas främst av utvecklingen för majsen i USA.
Priserna på majs i Chicago har handlats upp under den gångna veckan. Torrt väder i en del regioner skapar viss oro över de amerikanska grödorna och priserna går upp och ned utifrån varierande väderprognoser. Än verkar de flesta överens om att det blir en riktigt stor majsskörd i år, frågan är bara hur stor? Den närmsta tiden kommer nog bli fortsatt ganska volatil men vi tror det blir svårt att hålla majsen kvar på nuvarande nivåer när skörden kommer igång på allvar – flera s.k. ”crop tours” pekar även på en i många regioner klart högre avkastning än vad USDA spår.
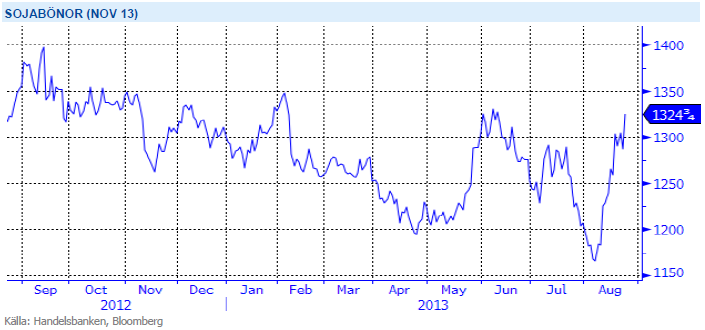
Priserna på sojabönor i Chicago noteras upp sedan förra veckan, precis som för majsen påverkat av torrt väder i en del områden i USA. En del regn har stabiliserat situationen i vissa områden men på andra håll önskas klart mycket mer. Man ska dock ej glömma att torrt väder samtidigt minskar tidigare oro för eventuell frost senare i september – vid torrt väder mognar den annars ovanligt sent utvecklade grödan klart snabbare. Nästa vecka ser ut att bli ganska torr och varm, varför vi nog kan vänta oss fortsatt oro ett tag till. Om/när regn kommer lär dock nedsidan vara ganska stor för sojabönorna, inte minst efter den senaste tidens snabba och ganska stora uppgång.
Vi håller en fortsatt neutral vy för vårt livmedelsindex.
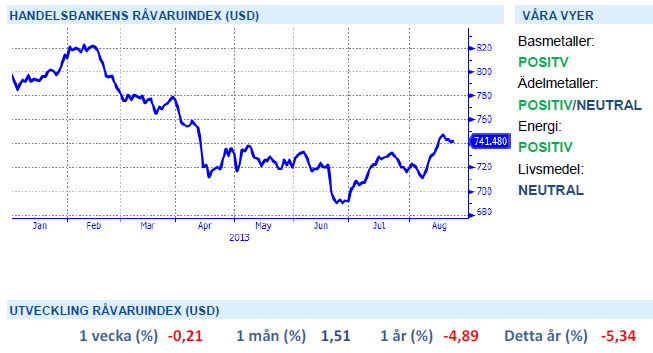
Handelsbankens Råvaruindex
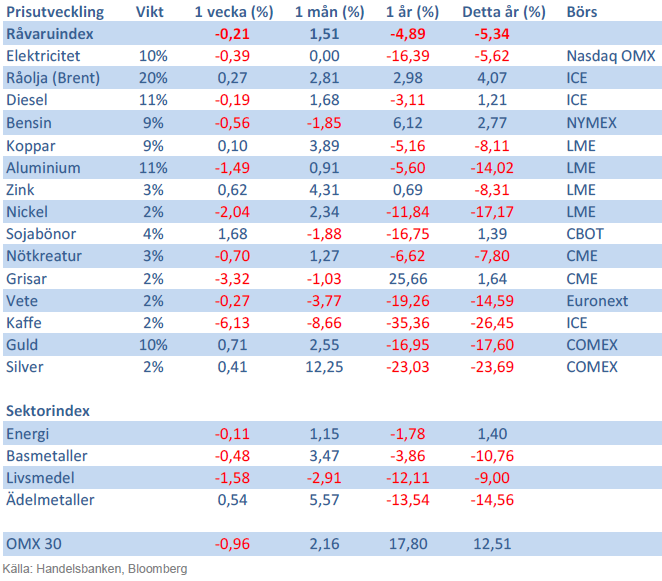
Handelsbankens råvaruindex består av de underliggande indexen för respektive råvara. Vikterna är bestämda till hälften från värdet av nordisk produktion (globala produktionen för sektorindex) och till hälften från likviditeten i terminskontrakten.
[box]SHB Råvarubrevet är producerat av Handelsbanken och publiceras i samarbete och med tillstånd på Råvarumarknaden.se[/box]
Ansvarsbegränsning
Detta material är producerat av Svenska Handelsbanken AB (publ) i fortsättningen kallad Handelsbanken. De som arbetar med innehållet är inte analytiker och materialet är inte oberoende investeringsanalys. Innehållet är uteslutande avsett för kunder i Sverige. Syftet är att ge en allmän information till Handelsbankens kunder och utgör inte ett personligt investeringsråd eller en personlig rekommendation. Informationen ska inte ensamt utgöra underlag för investeringsbeslut. Kunder bör inhämta råd från sina rådgivare och basera sina investeringsbeslut utifrån egen erfarenhet.
Informationen i materialet kan ändras och också avvika från de åsikter som uttrycks i oberoende investeringsanalyser från Handelsbanken. Informationen grundar sig på allmänt tillgänglig information och är hämtad från källor som bedöms som tillförlitliga, men riktigheten kan inte garanteras och informationen kan vara ofullständig eller nedkortad. Ingen del av förslaget får reproduceras eller distribueras till någon annan person utan att Handelsbanken dessförinnan lämnat sitt skriftliga medgivande. Handelsbanken ansvarar inte för att materialet används på ett sätt som strider mot förbudet mot vidarebefordran eller offentliggörs i strid med bankens regler.


Some rebound but not much. Brent crude rebounded 1.5% yesterday to $65.47/b. This morning it is inching 0.2% up to $65.6/b. The lowest close last week was on Thursday at $64.11/b.

The curve structure is almost as week as it was before the weekend. The rebound we now have gotten post the message from OPEC+ over the weekend is to a large degree a rebound along the curve rather than much strengthening at the front-end of the curve. That part of the curve structure is almost as weak as it was last Thursday.
We are still on a weakening path. The message from OPEC+ over the weekend was we are still on a weakening path with rising supply from the group. It is just not as rapidly weakening as was feared ahead of the weekend when a quota hike of 500 kb/d/mth for November was discussed.
The Brent curve is on its way to full contango with Brent dipping into the $50ies/b. Thus the ongoing weakening we have had in the crude curve since the start of the year, and especially since early June, will continue until the Brent crude oil forward curve is in full contango along with visibly rising US and OECD oil inventories. The front-month Brent contract will then flip down towards the $60/b-line and below into the $50ies/b.
At what point will OPEC+ turn to cuts? The big question then becomes: When will OPEC+ turn around to make some cuts? At what (price) point will they choose to stabilize the market? Because for sure they will. Higher oil inventories, some more shedding of drilling rigs in US shale and Brent into the 50ies somewhere is probably where the group will step in.
There is nothing we have seen from the group so far which indicates that they will close their eyes, let the world drown in oil and the oil price crash to $40/b or below.
The message from OPEC+ is also about balance and stability. The world won’t drown in oil in 2026. The message from the group as far as we manage to interpret it is twofold: 1) Taking back market share which requires a lower price for non-OPEC+ to back off a bit, and 2) Oil market stability and balance. It is not just about 1. Thus fretting about how we are all going to drown in oil in 2026 is totally off the mark by just focusing on point 1.
When to buy cal 2026? Before Christmas when Brent hits $55/b and before OPEC+ holds its last meeting of the year which is likely to be in early December.
Brent crude oil prices have rebounded a bit along the forward curve. Not much strengthening in the structure of the curve. The front-end backwardation is not much stronger today than on its weakest level so far this year which was on Thursday last week.

The front-end backwardation fell to its weakest level so far this year on Thursday last week. A slight pickup yesterday and today, but still very close to the weakest year to date. More oil from OPEC+ in the coming months and softer demand and rising inventories. We are heading for yet softer levels.

Down to the lowest since early May. Brent crude has fallen sharply the latest four days. It closed at USD 64.11/b yesterday which is the lowest since early May. It is staging a 1.3% rebound this morning along with gains in both equities and industrial metals with an added touch of support from a softer USD on top.
What stands out the most to us this week is the collapse in the Dubai one to three months time-spread.
Dubai is medium sour crude. OPEC+ is in general medium sour crude production. Asian refineries are predominantly designed to process medium sour crude. So Dubai is the real measure of the balance between OPEC+ holding back or not versus Asian oil demand for consumption and stock building.
A sharp weakening of the front-end of the Dubai curve. The front-end of the Dubai crude curve has been holding out very solidly throughout this summer while the front-end of the Brent and WTI curves have been steadily softening. But the strength in the Dubai curve in our view was carrying the crude oil market in general. A source of strength in the crude oil market. The core of the strength.
The now finally sharp decline of the front-end of the Dubai crude curve is thus a strong shift. Weakness in the Dubai crude marker is weakness in the core of the oil market. The core which has helped to hold the oil market elevated.
Facts supports the weakening. Add in facts of Iraq lifting production from Kurdistan through Turkey. Saudi Arabia lifting production to 10 mb/d in September (normal production level) and lifting exports as well as domestic demand for oil for power for air con is fading along with summer heat. Add also in counter seasonal rise in US crude and product stocks last week. US oil stocks usually decline by 1.3 mb/week this time of year. Last week they instead rose 6.4 mb/week (+7.2 mb if including SPR). Total US commercial oil stocks are now only 2.1 mb below the 2015-19 seasonal average. US oil stocks normally decline from now to Christmas. If they instead continue to rise, then it will be strongly counter seasonal rise and will create a very strong bearish pressure on oil prices.
Will OPEC+ lift its voluntary quotas by zero, 137 kb/d, 500 kb/d or 1.5 mb/d? On Sunday of course OPEC+ will decide on how much to unwind of the remaining 1.5 mb/d of voluntary quotas for November. Will it be 137 kb/d yet again as for October? Will it be 500 kb/d as was talked about earlier this week? Or will it be a full unwind in one go of 1.5 mb/d? We think most likely now it will be at least 500 kb/d and possibly a full unwind. We discussed this in a not earlier this week: ”500 kb/d of voluntary quotas in October. But a full unwind of 1.5 mb/d”
The strength in the front-end of the Dubai curve held out through summer while Brent and WTI curve structures weakened steadily. That core strength helped to keep flat crude oil prices elevated close to the 70-line. Now also the Dubai curve has given in.

Brent crude oil forward curves

Total US commercial stocks now close to normal. Counter seasonal rise last week. Rest of year?

Total US crude and product stocks on a steady trend higher.

Analys
OPEC+ will likely unwind 500 kb/d of voluntary quotas in October. But a full unwind of 1.5 mb/d in one go could be in the cards
Down to mid-60ies as Iraq lifts production while Saudi may be tired of voluntary cut frugality. The Brent December contract dropped 1.6% yesterday to USD 66.03/b. This morning it is down another 0.3% to USD 65.8/b. The drop in the price came on the back of the combined news that Iraq has resumed 190 kb/d of production in Kurdistan with exports through Turkey while OPEC+ delegates send signals that the group will unwind the remaining 1.65 mb/d (less the 137 kb/d in October) of voluntary cuts at a pace of 500 kb/d per month pace.
Signals of accelerated unwind and Iraqi increase may be connected. Russia, Kazakhstan and Iraq were main offenders versus the voluntary quotas they had agreed to follow. Russia had a production ’debt’ (cumulative overproduction versus quota) of close to 90 mb in March this year while Kazakhstan had a ’debt’ of about 60 mb and the same for Iraq. This apparently made Saudi Arabia angry this spring. Why should Saudi Arabia hold back if the other voluntary cutters were just freeriding? Thus the sudden rapid unwinding of voluntary cuts. That is at least one angle of explanations for the accelerated unwinding.
If the offenders with production debts then refrained from lifting production as the voluntary cuts were rapidly unwinded, then they could ’pay back’ their ’debts’ as they would under-produce versus the new and steadily higher quotas.
Forget about Kazakhstan. Its production was just too far above the quotas with no hope that the country would hold back production due to cross-ownership of oil assets by international oil companies. But Russia and Iraq should be able to do it.
Iraqi cumulative overproduction versus quotas could reach 85-90 mb in October. Iraq has however steadily continued to overproduce by 3-5 mb per month. In July its new and gradually higher quota came close to equal with a cumulative overproduction of only 0.6 mb that month. In August again however its production had an overshoot of 100 kb/d or 3.1 mb for the month. Its cumulative production debt had then risen to close to 80 mb. We don’t know for September yet. But looking at October we now know that its production will likely average close to 4.5 mb/d due to the revival of 190 kb/d of production in Kurdistan. Its quota however will only be 4.24 mb/d. Its overproduction in October will thus likely be around 250 kb/d above its quota with its production debt rising another 7-8 mb to a total of close to 90 mb.
Again, why should Saudi Arabia be frugal while Iraq is freeriding. Better to get rid of the voluntary quotas as quickly as possible and then start all over with clean sheets.
Unwinding the remaining 1.513 mb/d in one go in October? If OPEC+ unwinds the remaining 1.513 mb/d of voluntary cuts in one big go in October, then Iraq’s quota will be around 4.4 mb/d for October versus its likely production of close to 4.5 mb/d for the coming month..
OPEC+ should thus unwind the remaining 1.513 mb/d (1.65 – 0.137 mb/d) in one go for October in order for the quota of Iraq to be able to keep track with Iraq’s actual production increase.
October 5 will show how it plays out. But a quota unwind of at least 500 kb/d for Oct seems likely. An overall increase of at least 500 kb/d in the voluntary quota for October looks likely. But it could be the whole 1.513 mb/d in one go. If the increase in the quota is ’only’ 500 kb/d then Iraqi cumulative production will still rise by 5.7 mb to a total of 85 mb in October.
Iraqi production debt versus quotas will likely rise by 5.7 mb in October if OPEC+ only lifts the overall quota by 500 kb/d in October. Here assuming historical production debt did not rise in September. That Iraq lifts its production by 190 kb/d in October to 4.47 mb/d (August level + 190 kb/d) and that OPEC+ unwinds 500 kb/d of the remining quotas in October when they decide on this on 5 October.


Silver spränger den magiska gränsen, kostar nu över 50 USD per uns

Blykalla, Evroc och Studsvik vill bygga kärnkraftsdrivna datacenter i Sverige

Toppmöte om framtidens kärnkraft runt Östersjön hölls idag

Nytt prisrekord, guld stiger över 4000 USD

Goldman Sachs höjer prognosen för guld, tror priset når 4900 USD

Mahvie Minerals i en guldtrend
Volatile but going nowhere. Brent crude circles USD 66 as market weighs surplus vs risk

Aktier i guldbolag laggar priset på guld

Kinas elproduktion slog nytt rekord i augusti, vilket även kolkraft gjorde

Tyskland har så höga elpriser att företag inte har råd att använda elektricitet
-
 Nyheter4 veckor sedan
Mahvie Minerals i en guldtrend
-
Analys4 veckor sedan
Volatile but going nowhere. Brent crude circles USD 66 as market weighs surplus vs risk
-
 Nyheter4 veckor sedan
Aktier i guldbolag laggar priset på guld
-
 Nyheter3 veckor sedan
Kinas elproduktion slog nytt rekord i augusti, vilket även kolkraft gjorde
-
Nyheter3 veckor sedan
Tyskland har så höga elpriser att företag inte har råd att använda elektricitet
-

 Nyheter4 veckor sedan
Guld når sin högsta nivå någonsin, nu även justerat för inflation
-

 Nyheter4 veckor sedan
Det stigande guldpriset en utmaning för smyckesköpare
-
Analys4 veckor sedan
Waiting for the surplus while we worry about Israel and Qatar