

Analys
SHB Råvarubrevet 22 augusti 2014

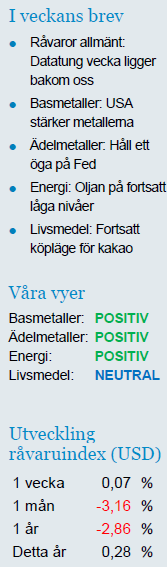
Råvaror allmänt: Datatung vecka ligger bakom oss
 Veckan bjöd på både protokollet från Fed:s senaste möte, preliminära inköpschefsindex och fastighetspriser från Kina. Överlag var dataskörden negativ för konjunkturhandlade råvarupriser.
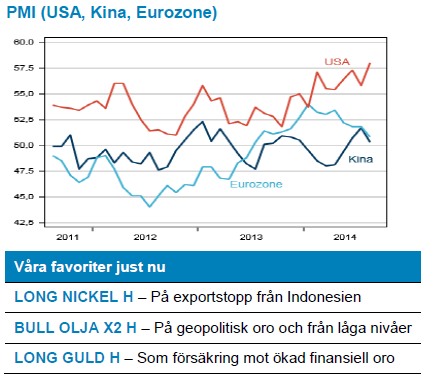
Augusti månads fall i Eurozonens PMI var den fjärde på sex månader och ökar risken att regionens sköra återhämning redan är över. Det kinesiska PMI föll till 50,3 från 51,7 i juli och är sannolikt en effekt av att ledarnas ministimulanser under våren har slutat verka och att nedgången i fastighetspriserna nu börjar få spridningseffekter i ekonomin. Måndagens fastighetspriser från Kina visade just att prisnedgången fortsätter och har dessutom accelererat under våren och sommaren. Initialt påverkades enbart företag som producerade direkt mot fastighetssektorn men nu börjar effekterna alltså sprida sig. Nya stimulanser kan vara på gång efter att både investeringar och krediter minskat i juli. Basmetallerna är särskilt känsliga för en sådan datamix. Lite hjälp fick dock basmetallerna från bra husdata i USA och ett, i princip oförändrat, bra inköpschefsindex från dragloket väster om Atlanten under torsdagen.
Protokollet från Feds senaste möte var överlag mer hökigt (ökad risk för ränta upp) men visade också på stor splittring i direktionen. En tydligare guide för räntehöjningar kommer att publiceras senare i år. Guld och silver föll på det hökiga protokollet. Vi har tidigare påtalat risken för Fed:s kommande vändning i guldpriset.
Basmetaller: USA stärker metallerna
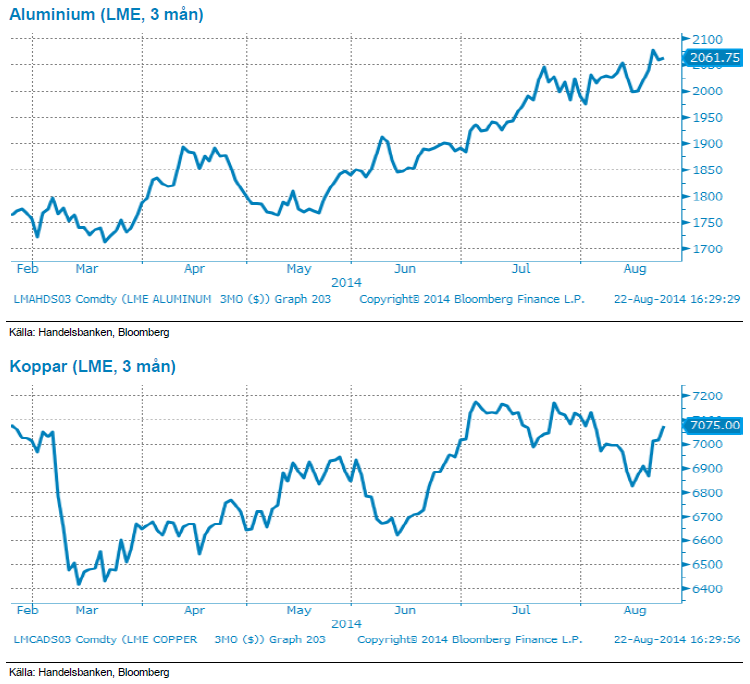
Samtliga basmetaller, med undantag av tenn, har stigit under veckan med stöd av positiv data från USA samt en något tightare utbudsbalans. Aluminium har gått starkt under sommaren, upp 13% sedan juni, och har under veckan passerat 2080 USD/ton, vilket är 18-månaders högsta. Efterfrågan på metallen är stark då ökade miljökrav leder till efterfrågan på lättare metaller.
Vi är nu uppe på nivåer där kapacitet som tidigare tagit ur bruk på grund av dålig lönsamhet normalt tas i bruk igen men vi räknar med att detta dröjer något varför aluminium kan komma att stiga något till, kanske uppemot 2100 dollar, innan den faller tillbaka till det intervall om 1800-2000 USD/ton som är mer rimlig för det längre perspektivet.
Kopparpriset har visserligen stigit under veckan, till följd av positiv husdata från USA, men i övrigt är det inte mycket som talar för vidare prisuppgångar. Gruvproduktion väntas öka under andra halvåret och ser inte ut att mötas upp av ökad efterfrågan. I Kina faller antalet nybyggnationer vilket kommer slå hårt på kopparpriset. Koppar används i slutskedet av byggandet (tex i kylskåp etc) så resultatet dröjer något. Positiva vindar från USA kan dock komma att ge stöd då koppar är konjunkturkänslig.
Vi ser positivt på basmetaller i sin helhet, där aluminium, zink och nickel sticker ut som lite favoriter.
Ädelmetaller: Håll ett öga på Fed
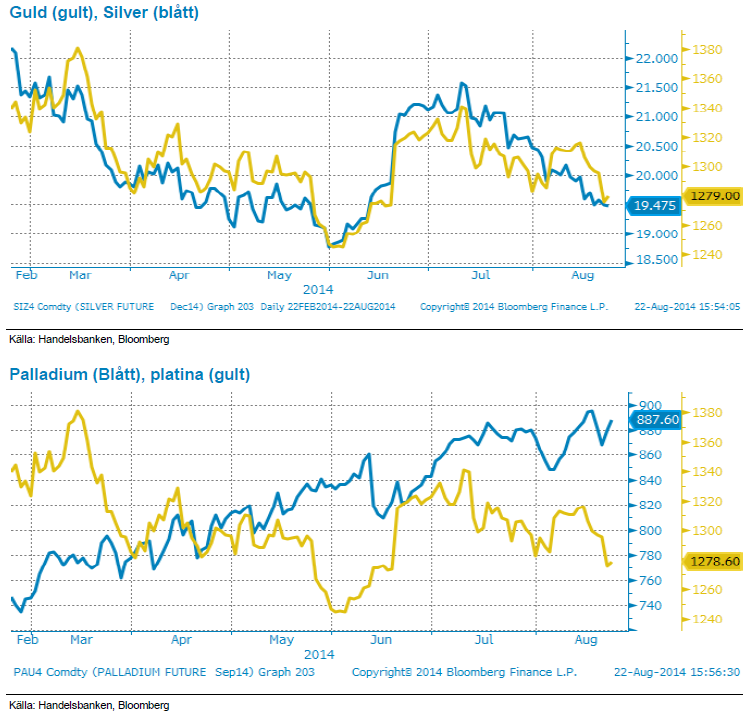
Den gångna veckan har präglats av små rörelser på ädelmetallmarknaderna. Vi har fått se marginella prisfall på guld, platina och palladium medan silvret står kvar på samma nivå som förra fredagen. Små ränterörelser, något stigande aktiemarknader och en stärkt dollar har dominerat övriga finansmarknader och tillsammans har detta satt en lätt press på ädelmetallerna, och prisfallen ligger i paritet med dollarförstärkningen.
Vi är fortsatt positiva till sektorn men påminner om att Federal Reserve kommer att kunna påverka detta om den amerikanska arbetsmarknaden fortsätter stärkas i den takt vi sett på sistone, och Fed därför börjar signalera en tidigare åtstramning. De geopolitiska spänningarna ligger alltjämt som ett orosmoln över alla marknader, men vi är tillbaks i en miljö som liknar den vi såg under våren, där avsaknad av ”ännu värre” nyheter – än vad som redan kablas ut dagligen – leder till att investerare söker sig till riskfyllda tillgångar. I denna miljö – där världens centralbanker ”tvingar” investerare in i mer riskfyllda tillgångar för att få någon avkastning alls – ser vi en lång position i guld som en bra försäkring mot stigande finansiell oro. Även om vi inte vågar gissa vad som skulle kunna orsaka oro i nuläget.
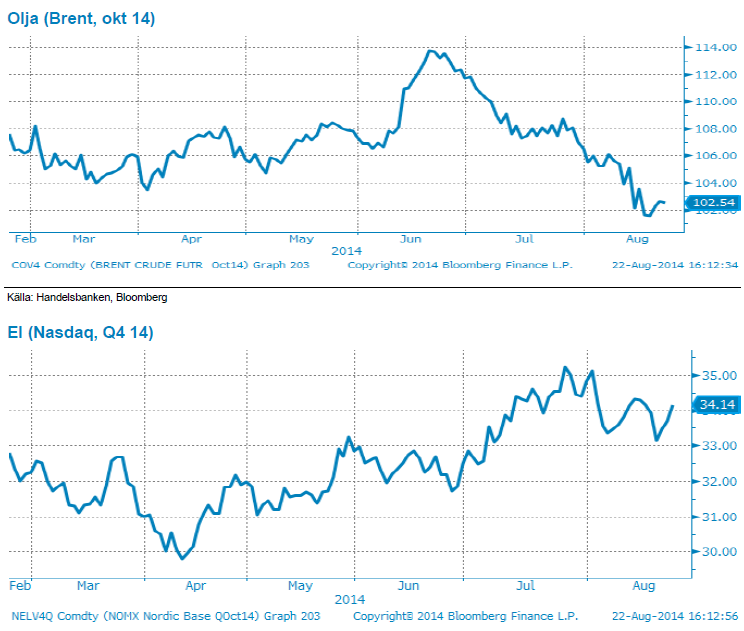
Energi: Oljan på fortsatt låga nivåer
Oljepriset har stabiliserat sig under veckan efter det kraftiga fallet under augusti, handlas i skrivande stund på 102,5 USD/fat. Situationen kring Irak har på inget vis förbättrats, snarare tvärtom, men marknaden verkar tolka krisen där utan större risk för oljeleveranser.
Generellt tror vi att det fallande oljepriset bäst förklaras av att marknaden tröttnat på riskpremietemat. Med den stigande produktionen i USA, som detta år slagit alla rekord, så förbättras hela tiden fundamenta. Någon gång ska det slå igenom i priset och det har nu börjat ske. Vi tror dock att oljan vänder upp på grund av oroligheterna i världen före den åter pressas av växande produktion på ett års sikt. Ett så här kraftigt ras brukar följas av en rekyl, så vi tycker oljan är köpvärd på denna nivå.
För elen inleddes veckan med ett fallande pris efter att väderprognoserna visat på extremt mycket nederbörd den kommande 10-dagars perioden samtidigt som bränslepriserna också kom under press då riskpremien kring Irak fortsatt pyser ut. Kol och gaspriserna återhämtade sig dock något mot slutet av veckan så inga större förändringar vad gäller brytpris, värt att notera att utsläppsrätterna fortsätter att trenda uppåt i kanalen. Fokus är ändå på vädret och vi ser stöd för en mer högtrycksbetonad utveckling från början av nästa vecka till nästa helg vilket skulle innebära nederbördsvolymer under det normala. En del osäkerhet i prognoserna men det skulle i så fall innebära att vi rör oss mot ett underskott om ca 6 TWh och att dessa prognoser, om de håller i sig över helgen, fortsatt talar för köp el även efter helgen.
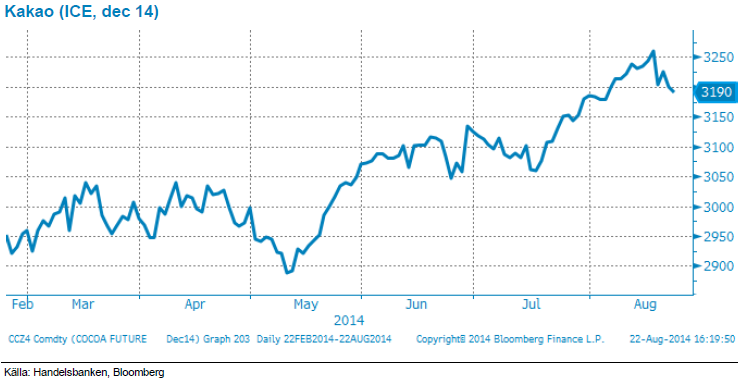
Livsmedel: Fortsatt köpläge för kakao
Ökad konsumtion av chokladprodukter och stigande priser på kakaosmör har fått kakaopriset att stiga 18 procent sedan årsskiftet. Förra året drev torka vid Afrikas västkust och höga priser på kakaosmör upp kakaopriset till rekordnivåer. Vid stigande priser är producenterna de stora vinnarna, men det finns även företag som tillverkar ersättningsvaror till framställning av choklad som ökar sin försäljning på dyrare kakaopriser. Förlorarna blir då dessvärre konsumenten som får betala ett högre pris för sin chokladkaka.
Det produceras omkring 3 miljoner ton kakao per år, där Elfenbenskusten, Ghana, Indonesien är de främsta kakaoproducerande länderna. Väderstörningar eller politiska oroligheter i dessa länder har stor effekt på utbudet. Risken för stora produktionsbortfall är stor då dessa regioner står för 70 % av den globala kakao-produktionen.
Årets första skörd (main crop) och även prognoserna för årets andra skörd (mid crop) ser lovande ut. Starka produktionssiffror rapporteras framförallt från Västafrika och Sydamerika. Ser man till den globala världsproduktionen väntas den stiga med 5,9 procent för 2013/2014 jämfört med föregående år. Även chokladkonsumtionen stiger globalt och allt fler chokladfabriker väljer att expandera i Asien där efterfrågan på choklad-produkter ökar i takt med den ökande medelklassen. Konsumtionen ser även ut att öka i Västafrika, som idag står för 45 procent av världens kakaoproduktion. Tidigare har kakao varit en delikat lyxråvara i länder med goda ekonomier men i takt med ökad levnadsstandard i tillväxtländerna ökar även kakaokonsumtionen i dessa länder. En stark uppåtgående trend som verkar hålla i sig.
Utbud och efterfrågan mäts och uttrycks ibland genom förhållandet mellan utgående lager och årlig konsumtion. Denna kvot väntas minska från 40.2 till 37.3 procent, vilket kan tolkas som att konsumtionen överstiger produktionen. Vad som ytterligare talar för högre kakaopriser är de rekordhöga priserna på kakaosmör som fortsätter att stiga i takt med att efterfrågan på chokladprodukter stiger. Vi känner viss oro för att underskottet inte ska orka vända till ett överskott. Som vi skrev ovan är kakaoodlingar oerhört väderberoende, varför vi ser risk för att den stigande konsumtionen fortsätter att sluka årets kakaoskörd. Vi tycker därför kakao fortsatt är köpvärd trots redan höga nivåer.
Handelsbankens råvaruindex (USD)
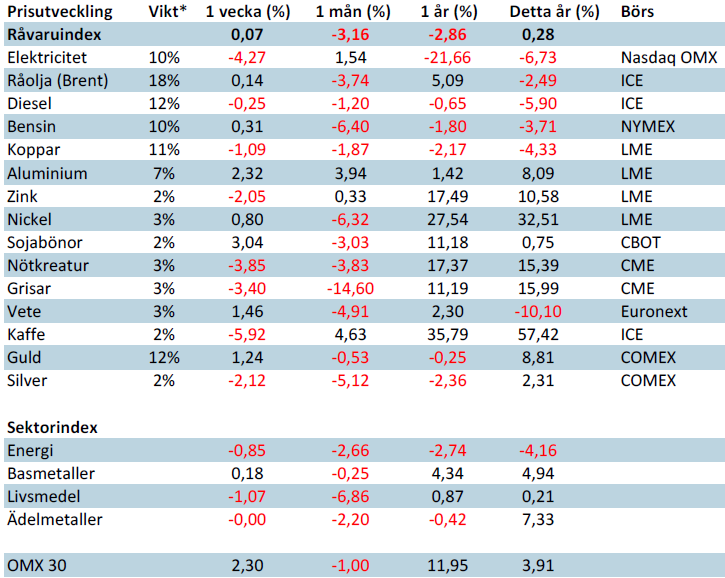
*Uppdaterade vikter från 29 november 2013
Handelsbankens råvaruindex består av de underliggande indexen för respektive råvara. Vikterna är bestämda till hälften från värdet av nordisk produktion (globala produktionen för sektorindex) och till hälften från likviditeten i terminskontrakten.
[box]SHB Råvarubrevet är producerat av Handelsbanken och publiceras i samarbete och med tillstånd på Råvarumarknaden.se[/box]
Ansvarsbegränsning
Detta material är producerat av Svenska Handelsbanken AB (publ) i fortsättningen kallad Handelsbanken. De som arbetar med innehållet är inte analytiker och materialet är inte oberoende investeringsanalys. Innehållet är uteslutande avsett för kunder i Sverige. Syftet är att ge en allmän information till Handelsbankens kunder och utgör inte ett personligt investeringsråd eller en personlig rekommendation. Informationen ska inte ensamt utgöra underlag för investeringsbeslut. Kunder bör inhämta råd från sina rådgivare och basera sina investeringsbeslut utifrån egen erfarenhet.
Informationen i materialet kan ändras och också avvika från de åsikter som uttrycks i oberoende investeringsanalyser från Handelsbanken. Informationen grundar sig på allmänt tillgänglig information och är hämtad från källor som bedöms som tillförlitliga, men riktigheten kan inte garanteras och informationen kan vara ofullständig eller nedkortad. Ingen del av förslaget får reproduceras eller distribueras till någon annan person utan att Handelsbanken dessförinnan lämnat sitt skriftliga medgivande. Handelsbanken ansvarar inte för att materialet används på ett sätt som strider mot förbudet mot vidarebefordran eller offentliggörs i strid med bankens regler.


The latest weekly report from the US DOE showed a substantial drawdown across key petroleum categories, adding more upside potential to the fundamental picture.

Commercial crude inventories (excl. SPR) fell by 5.8 million barrels, bringing total inventories down to 415.1 million barrels. Now sitting 11% below the five-year seasonal norm and placed in the lowest 2015-2022 range (see picture below).
Product inventories also tightened further last week. Gasoline inventories declined by 2.1 million barrels, with reductions seen in both finished gasoline and blending components. Current gasoline levels are about 3% below the five-year average for this time of year.
Among products, the most notable move came in diesel, where inventories dropped by almost 4.1 million barrels, deepening the deficit to around 20% below seasonal norms – continuing to underscore the persistent supply tightness in diesel markets.
The only area of inventory growth was in propane/propylene, which posted a significant 5.1-million-barrel build and now stands 9% above the five-year average.
Total commercial petroleum inventories (crude plus refined products) declined by 4.2 million barrels on the week, reinforcing the overall tightening of US crude and products.


A classic case of “buy the rumor, sell the news” played out in oil markets, as Brent crude has dropped sharply – down nearly USD 10 per barrel since yesterday evening – following Iran’s retaliatory strike on a U.S. air base in Qatar. The immediate reaction was: “That was it?” The strike followed a carefully calibrated, non-escalatory playbook, avoiding direct threats to energy infrastructure or disruption of shipping through the Strait of Hormuz – thus calming worst-case fears.
After Monday morning’s sharp spike to USD 81.4 per barrel, triggered by the U.S. bombing of Iranian nuclear facilities, oil prices drifted sideways in anticipation of a potential Iranian response. That response came with advance warning and caused limited physical damage. Early this morning, both the U.S. President and Iranian state media announced a ceasefire, effectively placing a lid on the immediate conflict risk – at least for now.
As a result, Brent crude has now fallen by a total of USD 12 from Monday’s peak, currently trading around USD 69 per barrel.
Looking beyond geopolitics, the market will now shift its focus to the upcoming OPEC+ meeting in early July. Saudi Arabia’s decision to increase output earlier this year – despite falling prices – has drawn renewed attention considering recent developments. Some suggest this was a response to U.S. pressure to offset potential Iranian supply losses.
However, consensus is that the move was driven more by internal OPEC+ dynamics. After years of curbing production to support prices, Riyadh had grown frustrated with quota-busting by several members (notably Kazakhstan). With Saudi Arabia cutting up to 2 million barrels per day – roughly 2% of global supply – returns were diminishing, and the risk of losing market share was rising. The production increase is widely seen as an effort to reassert leadership and restore discipline within the group.
That said, the FT recently stated that, the Saudis remain wary of past missteps. In 2018, Riyadh ramped up output at Trump’s request ahead of Iran sanctions, only to see prices collapse when the U.S. granted broad waivers – triggering oversupply. Officials have reportedly made it clear they don’t intend to repeat that mistake.
The recent visit by President Trump to Saudi Arabia, which included agreements on AI, defense, and nuclear cooperation, suggests a broader strategic alignment. This has fueled speculation about a quiet “pump-for-politics” deal behind recent production moves.
Looking ahead, oil prices have now retraced the entire rally sparked by the June 13 Israel–Iran escalation. This retreat provides more political and policy space for both the U.S. and Saudi Arabia. Specifically, it makes it easier for Riyadh to scale back its three recent production hikes of 411,000 barrels each, potentially returning to more moderate increases of 137,000 barrels for August and September.
In short: with no major loss of Iranian supply to the market, OPEC+ – led by Saudi Arabia – no longer needs to compensate for a disruption that hasn’t materialized, especially not to please the U.S. at the cost of its own market strategy. As the Saudis themselves have signaled, they are unlikely to repeat previous mistakes.
Conclusion: With Brent now in the high USD 60s, buying oil looks fundamentally justified. The geopolitical premium has deflated, but tensions between Israel and Iran remain unresolved – and the risk of missteps and renewed escalation still lingers. In fact, even this morning, reports have emerged of renewed missile fire despite the declared “truce.” The path forward may be calmer – but it is far from stable.
Analys
A muted price reaction. Market looks relaxed, but it is still on edge waiting for what Iran will do
Brent crossed the 80-line this morning but quickly fell back assigning limited probability for Iran choosing to close the Strait of Hormuz. Brent traded in a range of USD 70.56 – 79.04/b last week as the market fluctuated between ”Iran wants a deal” and ”US is about to attack Iran”. At the end of the week though, Donald Trump managed to convince markets (and probably also Iran) that he would make a decision within two weeks. I.e. no imminent attack. Previously when when he has talked about ”making a decision within two weeks” he has often ended up doing nothing in the end. The oil market relaxed as a result and the week ended at USD 77.01/b which is just USD 6/b above the year to date average of USD 71/b.

Brent jumped to USD 81.4/b this morning, the highest since mid-January, but then quickly fell back to a current price of USD 78.2/b which is only up 1.5% versus the close on Friday. As such the market is pricing a fairly low probability that Iran will actually close the Strait of Hormuz. Probably because it will hurt Iranian oil exports as well as the global oil market.
It was however all smoke and mirrors. Deception. The US attacked Iran on Saturday. The attack involved 125 warplanes, submarines and surface warships and 14 bunker buster bombs were dropped on Iranian nuclear sites including Fordow, Natanz and Isfahan. In response the Iranian Parliament voted in support of closing the Strait of Hormuz where some 17 mb of crude and products is transported to the global market every day plus significant volumes of LNG. This is however merely an advise to the Supreme leader Ayatollah Ali Khamenei and the Supreme National Security Council which sits with the final and actual decision.
No supply of oil is lost yet. It is about the risk of Iran closing the Strait of Hormuz or not. So far not a single drop of oil supply has been lost to the global market. The price at the moment is all about the assessed risk of loss of supply. Will Iran choose to choke of the Strait of Hormuz or not? That is the big question. It would be painful for US consumers, for Donald Trump’s voter base, for the global economy but also for Iran and its population which relies on oil exports and income from selling oil out of that Strait as well. As such it is not a no-brainer choice for Iran to close the Strait for oil exports. And looking at the il price this morning it is clear that the oil market doesn’t assign a very high probability of it happening. It is however probably well within the capability of Iran to close the Strait off with rockets, mines, air-drones and possibly sea-drones. Just look at how Ukraine has been able to control and damage the Russian Black Sea fleet.
What to do about the highly enriched uranium which has gone missing? While the US and Israel can celebrate their destruction of Iranian nuclear facilities they are also scratching their heads over what to do with the lost Iranian nuclear material. Iran had 408 kg of highly enriched uranium (IAEA). Almost weapons grade. Enough for some 10 nuclear warheads. It seems to have been transported out of Fordow before the attack this weekend.
The market is still on edge. USD 80-something/b seems sensible while we wait. The oil market reaction to this weekend’s events is very muted so far. The market is still on edge awaiting what Iran will do. Because Iran will do something. But what and when? An oil price of 80-something seems like a sensible level until something do happen.


USA ska införa 50 procent tull på koppar

Ryska staten siktar på att konfiskera en av landets största guldproducenter

Hur säkrar vi Sveriges tillgång till kritiska metaller och mineral i en ny geopolitisk verklighet?

Lundin Mining ska bli en av de tio största kopparproducenterna i världen

Sommarvädret styr elpriset i Sverige

Uppgången i oljepriset planade ut under helgen

Mahvie Minerals växlar spår – satsar fullt ut på guld

Låga elpriser i sommar – men mellersta Sverige får en ökning

Oljan, guldet och marknadens oroande tystnad
Very relaxed at USD 75/b. Risk barometer will likely fluctuate to higher levels with Brent into the 80ies or higher coming 2-3 weeks
-
 Nyheter4 veckor sedan
Uppgången i oljepriset planade ut under helgen
-
 Nyheter3 veckor sedan
Mahvie Minerals växlar spår – satsar fullt ut på guld
-
 Nyheter4 veckor sedan
Låga elpriser i sommar – men mellersta Sverige får en ökning
-
 Nyheter2 veckor sedan
Oljan, guldet och marknadens oroande tystnad
-
Analys4 veckor sedan
Very relaxed at USD 75/b. Risk barometer will likely fluctuate to higher levels with Brent into the 80ies or higher coming 2-3 weeks
-

 Nyheter2 veckor sedan
Jonas Lindvall är tillbaka med ett nytt oljebolag, Perthro, som ska börsnoteras
-
Analys3 veckor sedan
A muted price reaction. Market looks relaxed, but it is still on edge waiting for what Iran will do
-

 Nyheter2 veckor sedan
Domstolen ger klartecken till Lappland Guldprospektering