

Analys
SHB Råvarubrevet 20 juli 2012
 Allmänt
Råvaror har rusat på sistone. Efter rallyt i jordbruksprodukter orsakat av värmeböljan i USA så har Brentoljan klättrat dryga 5 % denna vecka. Sedan vi bytte fot den 19 juni och blev positiva till råvaror efter vårens fall så har SHB råvaruindex stigit 7,6 %.
Makrostatistiken har inte varit lika entydigt negativ på sistone, även om tunga siffror som USA:s detaljhandel överraskat negativt. I Kina ser infrastrukturinvesteringarna ut att ta viss fart igen, och på kinas bostadsmarknad kan en prisstabilisering nu skönjas.
Rapportsäsongen i USA har varit något svagare både i termer av börsutveckling och positiva vinstöverraskningar än vad vi vant oss vid sedan 2009. Riskaptiten har sammanfattningsvis hållit uppe väl trots dyster makrostatistik, halvdana bolagsrapporter och trots avsaknad av QE3-signaler.
Bernanke förväntas ha kaniner i hatten
Vid Fedchefen Bernankes halvårsvisa tal inför senaten sågs en ”sell-off” just på grund av avsaknaden av stimulanssignaler. Det dröjde dock inte länge förrän börsen hade återtagit och passerat, tidigare nivåer. Samma mönster har setts sedan början av juni. Detta beteende återspeglar fortsatt pessimistiskt sentiment, till viss del negativ positionering men framför allt – tydligen i cement gjutna – förväntningar på att Federal Reserve snart agerar med ytterligare stimulanser.
Skulle svagheten i ISM och speciellt i sysselsättningen (non-farm payrolls) visa sig bestå även i augusti, vilket vi upplever som troligt, sjösätts sannolikt ytterligare stimulanser inom kort. Sådana stimulanser har tidigare varit mycket gynnsamma för råvaror som då drivits av både lägre dollar och bättre utsikter för konjunkturen. Kanske tar Fed ett litet steg redan den första augusti. I så fall är ett signaleringsknep sannolikt: exempelvis att ge tecken om låga räntor till mitten av 2015 istället för till 2014.
Livsmedel
På jordbrukssidan fortsätter det varma och torra vädret att pressa upp priserna. Väderprognoser talar för att det ogynnsamma vädret kan fortsätta vilket talar för en fortsatt trend uppåt. Priset på vete har i veckan fortsatt upp kraftigt, återigen med stöd inte minst från stigande majspriser. Ingenting i veckan har egentligen hänt som bör få marknaden att ändra prisriktning, med alla dessa problem i flera regioner börjar även allt fler enas om att den senaste tidens prisuppgång inte alls är omotiverad. Vinsthemtagning lär dock ske då och då samtidigt som risken (fallhöjden) ökar allt mer som priserna stiger.
Majsen i Chicago har fortsatt att stiga i pris under veckan, främst som följd av fortsatta väderproblem i stora delar av USA:s viktiga majsdistrikt. Lite regn har fallit men nyttan är begränsad, med temperaturer kring 35-40 grader Celsius avdunstar den största delen direkt. Kommande två veckor ser ut att förbli varma och torra och ytterligare försämring av grödans skick verkar oundviklig. En del väderprognoser talar för att det ogynnsamma vädret fortsätter hela augusti månad ut, andra till och med ännu längre fram i tid. Avkastningsnivåer kring 135 bushels per acre börjar bli allt vanligare i prognoser, att jämföra med USDA:s senaste uppskattning om 146 bushels per acre – sammanfattningsvis ser situationen inte ut att ljusna och utan mer märkbart avtagande efterfrågan ser trenden ut att fortsätta uppåt.
Sojabönor nämndes som ett attraktivt case i vårt senaste brev och vårt index har sedan dess stigit med 10 %. Sojapriserna i Chicago har fortsatt kraftigt upp i veckan och handlas på högsta nivåer någonsin, viss vinsthemtagning har setts stundtals men trenden är fortsatt starkt uppåt. Det varma och torra vädret i viktiga regioner i USA, vilket är orsaken till prisuppgången, ser ut att fortsätta åtminstone två veckor till – en för sojaplantorna väldigt kritisk period vad gäller avkastningspotential och ytterligare försämring av grödans skick ser ut att bli oundviklig. En del prognoser spår dessutom att torkan kan fortsätta under väldigt lång tid. Dessa väderproblem i kombination med en fortsatt stark efterfrågan gör att det är svårt att se att prisriktningen ändrar riktning den närmaste tiden.
Vårt livsmedelsindex har under en månad gått upp med hela 15,5%!
Energi
Den kraftiga uppgången på oljemarknaden som drivits av ökad riskaptit, tillfälliga utbudsstörningar i mexiko (väder) och Norge (strejk), geopolitisk oro efter att optimismen kring förhandlingarna medIran avtagit och konflikten i Syrien eskalerat, tycker vi har nu diskonterats för så vi förväntar oss en förhållandevis lugn utveckling den kommande veckan. Fundamentalt ser vi en fortsatt press då bland annat Cushing ser ut att få ett överskott av leveranser samt att OPEC ligger kvar på höga produktionstal så inte omöjligt att vi kanske får ett tillfälligt nedställ som ett resultat av den kraftiga uppgången.
Metaller
Metallerna fann utöver den ökade riskaptiten stöd från starka amerikanska siffror (housing starts +6.9% i juni och högsta på 4 år) som visar på en fortsatt stark trend. Amerikanska marknaden är den näst största konsumenten av metaller (efter Kina) där byggsektorn förbrukar mest. En svag balans på koppar gör väl att den marknaden ser ännu mer intressant ut!
Handelsbankens Råvaruindex

[box]SHB Råvarubrevet är producerat av Handelsbanken och publiceras i samarbete och med tillstånd på Råvarumarknaden.se[/box]
Ansvarsbegränsning
Detta material är producerat av Svenska Handelsbanken AB (publ) i fortsättningen kallad Handelsbanken. De som arbetar med innehållet är inte analytiker och materialet är inte oberoende investeringsanalys. Innehållet är uteslutande avsett för kunder i Sverige. Syftet är att ge en allmän information till Handelsbankens kunder och utgör inte ett personligt investeringsråd eller en personlig rekommendation. Informationen ska inte ensamt utgöra underlag för investeringsbeslut. Kunder bör inhämta råd från sina rådgivare och basera sina investeringsbeslut utifrån egen erfarenhet.
Informationen i materialet kan ändras och också avvika från de åsikter som uttrycks i oberoende investeringsanalyser från Handelsbanken. Informationen grundar sig på allmänt tillgänglig information och är hämtad från källor som bedöms som tillförlitliga, men riktigheten kan inte garanteras och informationen kan vara ofullständig eller nedkortad. Ingen del av förslaget får reproduceras eller distribueras till någon annan person utan att Handelsbanken dessförinnan lämnat sitt skriftliga medgivande. Handelsbanken ansvarar inte för att materialet används på ett sätt som strider mot förbudet mot vidarebefordran eller offentliggörs i strid med bankens regler.


U.S. commercial crude inventories posted a marginal draw last week, falling by 0.6 million barrels to 414.8 million barrels. Inventories remain 4% below the five-year seasonal average, but the draw is far smaller than last week’s massive 9.3-million-barrel decline. Higher crude imports (+803,000 bl d WoW) and steady refinery runs (93% utilization) helped keep the crude balance relatively neutral.

Yet another drawdown indicates commercial crude inventories continue to trend below the 2015–2022 seasonal norm (~440 million barrels), though at 414.8 million barrels, levels are now almost exactly in line with both the 2023 and 2024 trajectory, suggesting stable YoY conditions (see page 3 attached).
Gasoline inventories dropped by 1.1 million barrels and are now 2% below the five-year average. The decline was broad-based, with both finished gasoline and blending components falling, indicating lower output and resilient end-user demand as we enter the shoulder season post-summer (see page 6 attached).
On the diesel side, distillate inventories declined by 1.7 million barrels, snapping a two-week streak of strong builds. At 125 million barrels, diesel inventories are once again 8% below the five-year average and trending near the low end of the historical range.
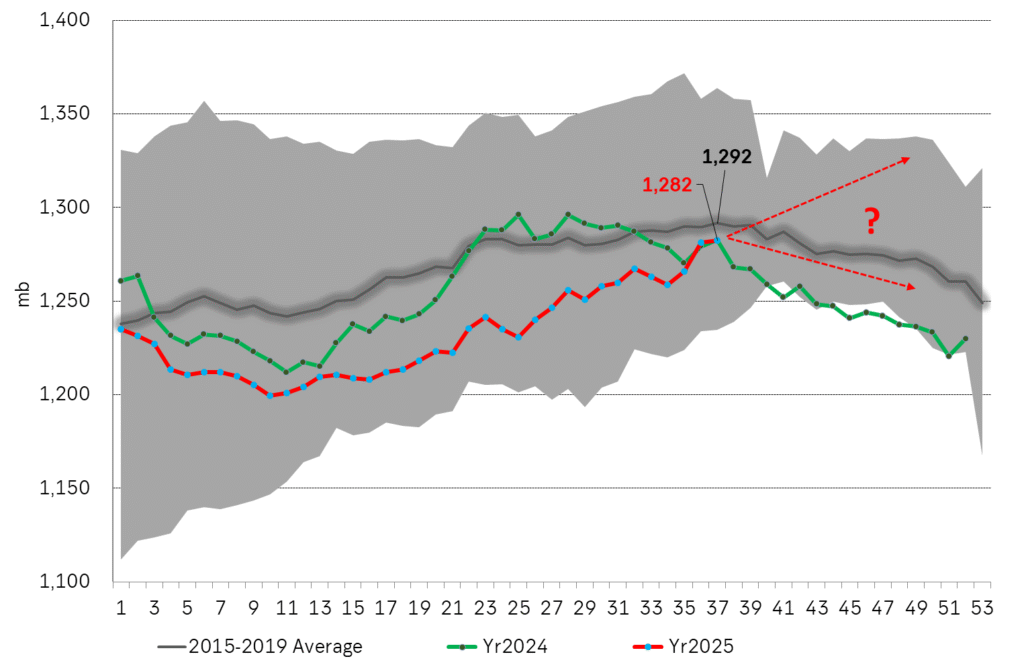
In total, commercial petroleum inventories (excl. SPR) slipped by 0.5 million barrels on the week to ish 1,281.5 million barrels. While essentially flat, this ends a two-week streak of meaningful builds, reflecting a return to a slightly tighter situation.
On the demand side, the DOE’s ‘products supplied’ metric (see page 6 attached), a proxy for implied consumption, softened slightly. Total demand for crude oil over the past four weeks averaged 20.5 million barrels per day, up just 0.9% YoY.
Summing up: This week’s report shows a re-tightening in diesel supply and modest draws across the board, while demand growth is beginning to flatten. Inventories remain structurally low, but the tone is less bullish than in recent weeks.


Brent crude rose 1.6% yesterday. After trading in a range of USD 66.1 – 68.09/b it settled at USD 67.63/b. A level which we are well accustomed to see Brent crude flipping around since late August. This morning it is trading 0.5% higher at USD 68/b. The market was expecting an increase of 230 kb/d in Iraqi crude exports from Kurdistan through Turkey to the Cheyhan port but that has so far failed to materialize. This probably helped to drive Brent crude higher yesterday. Indications last evening that US crude oil inventories likely fell 3.8 mb last week (indicative numbers by API) probably also added some strength to Brent crude late in the session. The market continues to await the much heralded global surplus materializing as rising crude and product inventories in OECD countries in general and the US specifically.

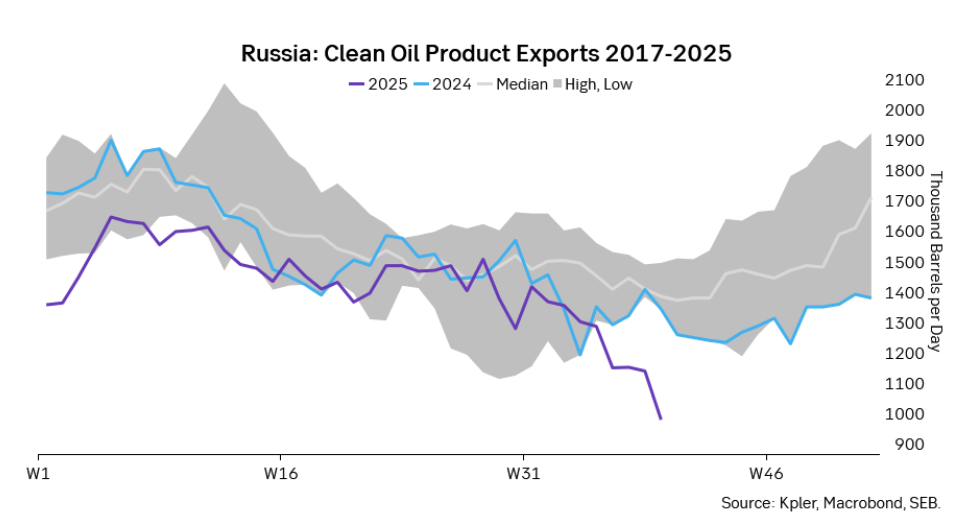
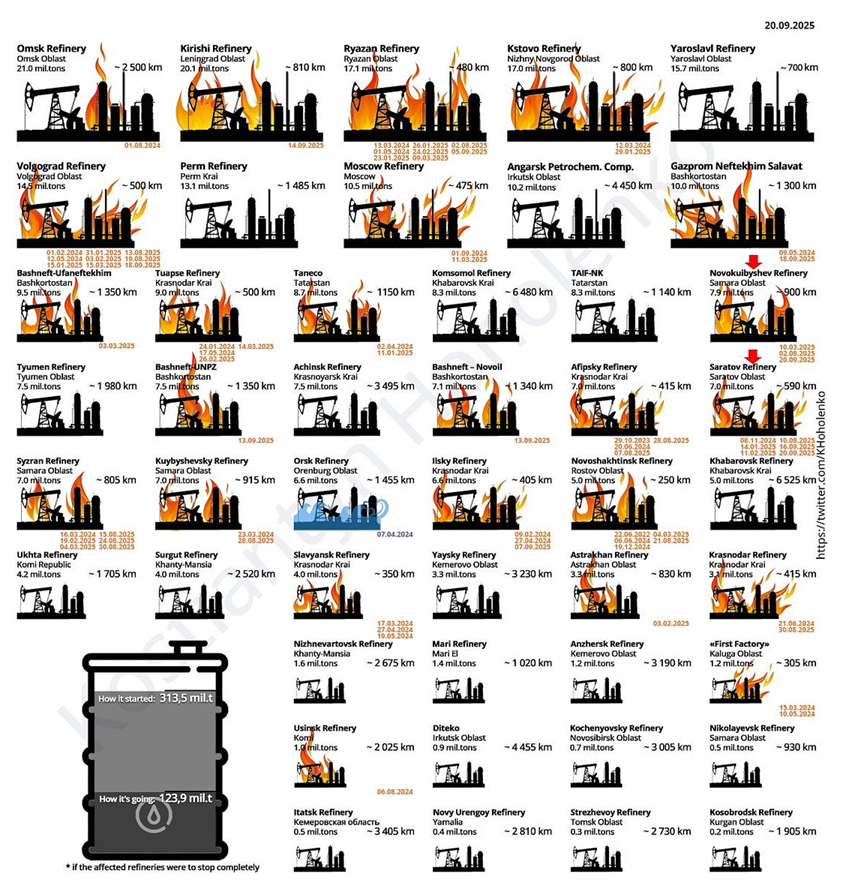
The oil market is starting to focus increasingly on the successful Ukrainian attacks on Russian oil infrastructure. Especially the attacks on Russian refineries. Refineries are highly complex and much harder to repair than simple crude oil facilities like export pipelines, ports and hubs. It can take months and months to repair complex refineries. It is thus mainly Russian oil products which will be hurt by this. First oil product exports will go down, thereafter Russia will have to ration oil product consumption domestically. Russian crude exports may not be hurt as much. Its crude exports could actually go up as its capacity to process crude goes down. SEB’s Emerging Market strategist Erik Meyersson wrote about the Ukrainian campaign this morning: ”Are Ukraine’s attacks on Russian energy infrastructure working?”. Phillips P O’Brian published an interesting not on this as well yesterday: ”An Update On The Ukrainian Campaign Against Russian Refineries”. It is a pay-for article, but it is well worth reading. Amongst other things it highlights the strategic focus of Ukraine towards Russia’s energy infrastructure. A Ukrainian on the matter also put out a visual representation of the attacks on twitter. We have not verified the data representation. It needs to be interpreted with caution in terms of magnitude of impact and current outage.
Complex Russian oil refineries are sitting ducks in the new, modern long-range drone war. Ukraine is building a range of new weapons as well according to O’Brian. The problem with attacks on Russian refineries is thus on the rise. This will likely be an escalating problem for Russia. And oil products around the world may rise versus the crude oil price while the crude oil price itself may not rise all that much due to this.
Russian clean oil product exports as presented by SEB’s Erik Meyersson in his note this morning.
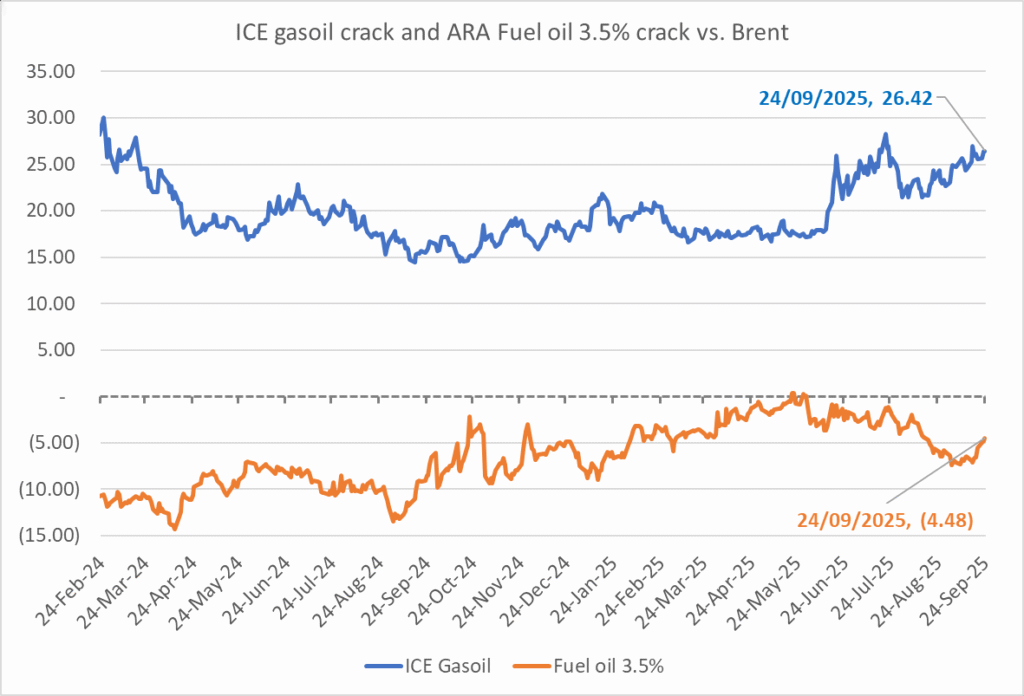
The ICE Gasoil crack and the 3.5% fuel oil crack has been strengthening. The 3.5% crack should have weakened along with rising exports of sour crude from OPEC+, but it hasn’t. Rather it has moved higher instead. The higher cracks could in part be due to the Ukrainian attacks on Russian oil refineries.
Ukrainian inhabitants graphical representation of Ukrainian attacks on Russian oil refineries on Twitter. Highlighting date of attacks, size of refineries and distance from Ukraine. We have not verified the detailed information. And you cannot derive the amount of outage as a consequence of this.
Brent down 0.5% last week with a little bounce this morning. Brent crude fell 0.5% last week to USD 66.68/b with a high of the week of USD 68/69/b set early in the week and the low of USD 66.44/b on Friday. This morning it is up 0.6% and trading at USD 67.1/b and just three dollar below the year to date average of USD 70/b.
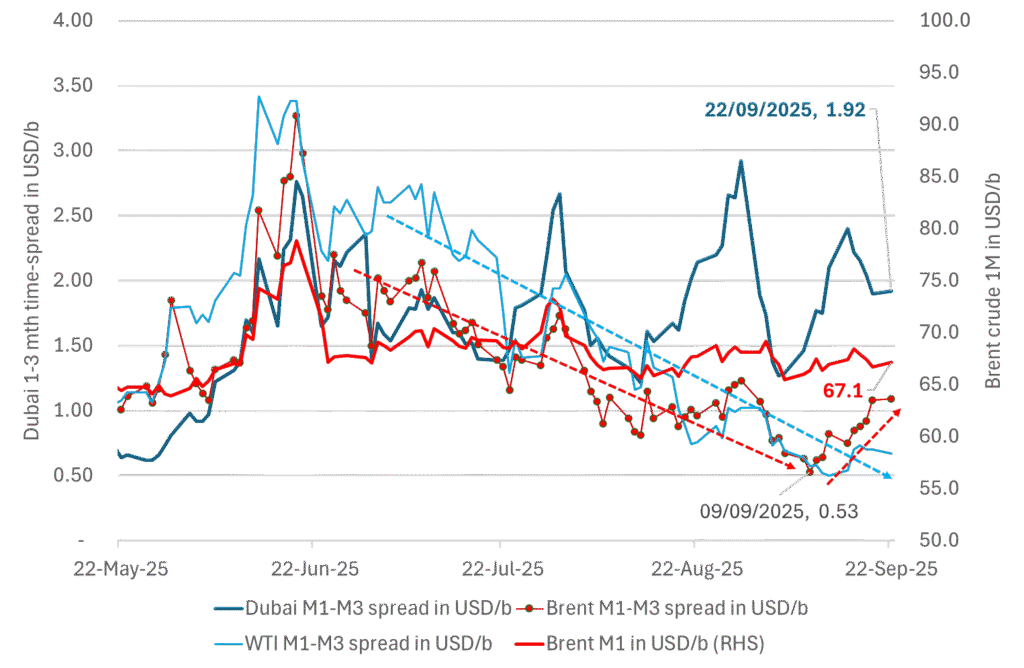
The Dubai crude curve is holding strong. Flat prices will move lower when/if that starts to weaken. The front-end of the Brent crude oil curve has been on a strengthening path since around 10 September, but the front-month contract is more or less at the same level as 10 September. But the overall direction since June has been steadily lower. The recent strengthening in the front-end of the Brent curve is thus probably temporary. The WTI curve has also strengthened a little but much less visibly. What stands out is the robustness in the front-end of the Dubai crude curve. With tapering crude burn for power in the Middle East as we move away from the summer heat together with increasing production by OPEC+, one should have expected to see a weakening in the Dubai curve. The 1 to 3mth Dubai time-spread is however holding strong at close to USD 2/b. When/if the Dubai front-end curve starts to weaken, that is probably when we’ll see flat prices start to taper off and fall lower. Asian oil demand in general and Chinese stockpiling specifically is probably what keeps the the strength in the front-end of the Dubai curve elevated. It is hard to see Brent and WTI prices move significantly lower before the Dubai curve starts to give in.
The 1mth to 3mth time spreads of Brent, WTI and Dubai in USD/b
If US oil stocks continues higher in Q4 we’ll start to feel the bearish pressure more intensely. US commercial crude and product stocks have been below normal and below levels from last year as well all until now. Inventories have been rising since week 10 and steadily faster than the normal seasonal trend and today are finally on par with last year and only 10 mb below normal. From here to the end of the year is however is the interesting part as inventories normally decline from now to the end of the year. If US inventories instead continues to rise, then the divergence with normal inventories will be very explicit and help to drive the price lower. So keep a keen eye on US commercial inventories in the coming weeks for such a possible divergence.
US Commercial crude and product stocks in million barrels.
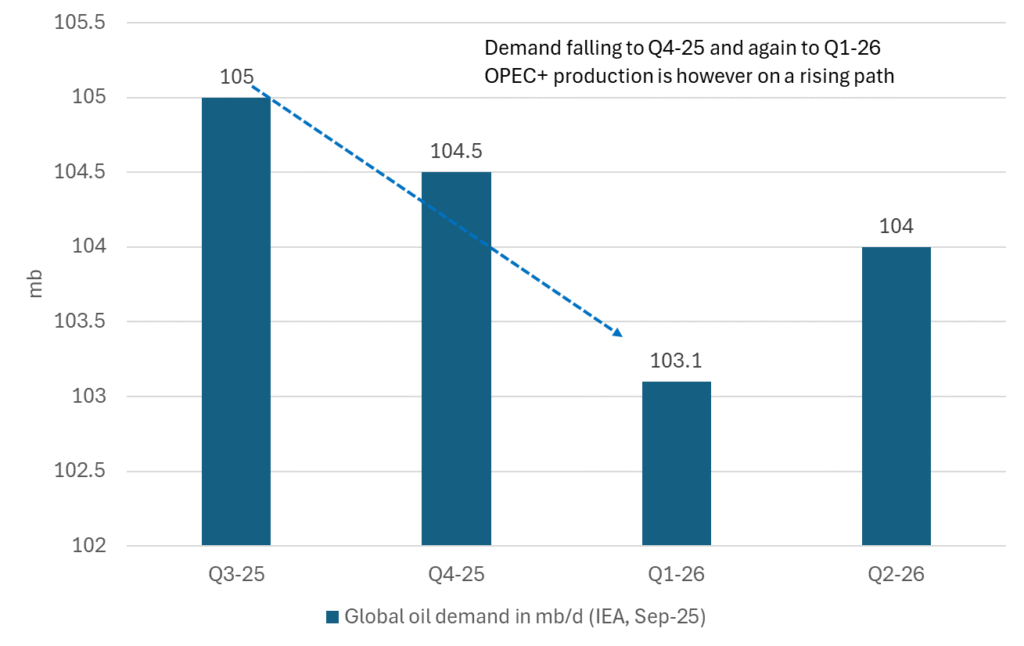
Falling seasonal demand and rising OPEC+ supply will likely drive oil lower in Q4-25. The setup for the oil market is that global oil demand is set to taper off from Q3 to Q4 and again to Q1-26. At the same time production by OPEC+ is on a rising path. The big question this is of course if China will stockpile the increasing surplus or whether the oil price will be pushed lower into the 50ies. We believe the latter.
Outlook for global oil demand by IEA in the OMR September report


OPEC+ missar produktionsmål, stöder oljepriserna

Kanadensiska naturgasproducenter stryper produktionen efter minuspriser
Modest draws, flat demand, and diesel back in focus

ShaMaran återupptar oljeexport genom Irak–Turkiet-pipelinen
Are Ukraine’s attacks on Russian energy infrastructure working?

Eurobattery Minerals satsar på kritiska metaller för Europas självförsörjning

Guldpriset kan närma sig 5000 USD om centralbankens oberoende skadas

Mahvie Minerals i en guldtrend
OPEC+ in a process of retaking market share

Aktier i guldbolag laggar priset på guld
-
 Nyheter3 veckor sedan
Eurobattery Minerals satsar på kritiska metaller för Europas självförsörjning
-
 Nyheter3 veckor sedan
Guldpriset kan närma sig 5000 USD om centralbankens oberoende skadas
-
 Nyheter2 veckor sedan
Mahvie Minerals i en guldtrend
-
Analys4 veckor sedan
OPEC+ in a process of retaking market share
-
 Nyheter2 veckor sedan
Aktier i guldbolag laggar priset på guld
-

 Nyheter3 veckor sedan
OPEC signalerar att de inte bryr sig om oljepriset faller kommande månader
-
Analys2 veckor sedan
Volatile but going nowhere. Brent crude circles USD 66 as market weighs surplus vs risk
-

 Nyheter2 veckor sedan
Kinas elproduktion slog nytt rekord i augusti, vilket även kolkraft gjorde