

Analys
SHB Råvarubrevet 19 april 2013

 Råvaror allmänt
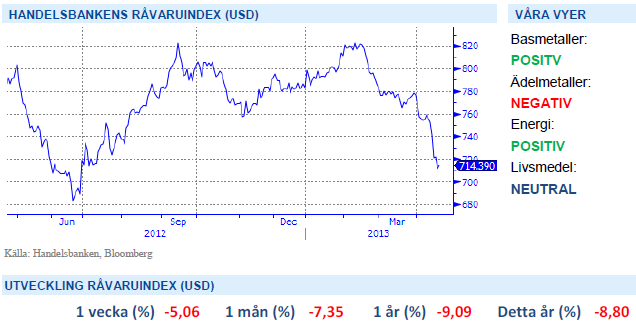
En vecka med motvind
Marknaden har haft ordentlig motvind sedan förra veckan. Denna gång är det framförallt råvaror som har handlats ner. Brentoljan har dippat under 100 USD och koppar under 7000 USD samtidigt som guldet har genomlidit det största fallet under två dagar på 30 år. De senaste motgångarna är inte koncentrerade till Europa som vi vant oss vid utan kommer från makrodata i USA och Kina. Vi har påtalat risken för besvikelser i amerikanskt makro under våren och de senaste händelserna stödjer denna riskbild.
Den QE pådrivna börsen tar sig förbi svagare data medan räntemarknaden och råvarumarknaden prisar in den för fullt. En svagare data är antagligen de första tecknen på finanspolitisk åtstramning i USA och kan också vara tecken på att QE3 effekten nu börjar ebba ut. Samtidigt har data i Kina börjat oroa på svagare nivåer än väntat på det hela taget. Med problembarnet Europa ständigt närvarande ser vi få ljuspunkter i makrobilden just nu.
Basmetaller
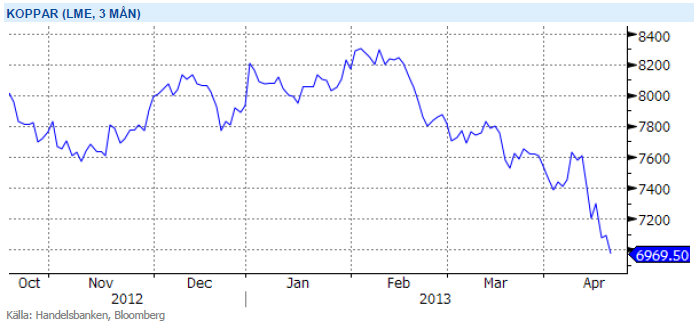
Metallerna under marginalkostnad
Basmetallerna har haft ytterligare en vecka med fallande priser, där koppar tappat dryga 6 % och handlas nu under 7000 USD – i nivå vi inte sett sedan oktober 2011. Förhoppningar på Kinas konjunkturuppgång har inte infriats och med ett USA som samtidigt släpper svagare data har fått konjunktur känsliga metaller att falla. I närtid finns risk för mer dålig USA data och för Kina ororas vi av att de stimulanser som lanserats redan verkat i indikatorer och det finns därför inte mer lanserad stimulansdriven tillväxt att vänta i barometerdata.
En rad metaller har efter senaste veckans negativa rörelser nu sjunkit och handlas klart under marginalkostnad för produktion vilken brukar verka bättre som stöd vid fallande kurser. Om vi bortser från Koppar där denna ligger på ca 4,500 dollar eller strax över 6,000 dollar om man ser till det ”incentive-pris”, som gäller för nya investeringar, och kanske bättre symboliserar stödet vid en svag balans, har vi svårt att se att detta ska falla så värst mycket ytterligare. Vi förväntar oss dock inget kraftigt uppställ på kort sikt utan snarare att marknaden bottnar ur för att sedan på lite längre sikt börja stiga igen. Initialt mot marginalkostnad vilket gör att vi ser detta som köpterritorium för metaller och möjlighet att komma in på bra nivåer.
Trots fortsatt svag makromiljö, utan någon direkt ljusning ser vi ändå basmetaller som köpvärda på dessa nivåer. Vi tror på: LONG BASMET H
Ädelmetaller
Veckans snackis!
Guldet blev denna veckas stora samtalsämne efter att på måndagen ha fallit med över 11 % jämfört med fredagskvällens notering. Det cirkulerade många försök till förklaringar till den stora och plötsliga rörelsen, och varför den skedde just nu. Vi har inga bra svar på timingen, men konstaterar att det är en rörelse vi väntat på, och vi tror inte att den är över i och med detta fall. Vi har nu fallit med 26 % från toppen hösten 2011, och 16 % hittills i år. Silvret däremot – guldets sprallige lillebror – har mer än halverats sedan toppen, och fallit 22 % i år. Den stora frågan nu är naturligtvis huruvida det ska fortsätta, och isåfall hur långt.
Vårt resonemang har som bekant varit att guldet handlas i stort sett enbart ur perspektivet att man vill tjäna pengar – man köper guld för att sälja dyrare till någon annan – och att guldet inte har massvis med andra användningsområden. Det är helt korrekt, som många kommenterat, att guld används till smycken och viss industriell nytta, men vi anser inte att dessa delar är de som sätter priset på guld. Det är guldets likviditet, enkla omsättningsbarhet, och det upplevda skyddet mot finansiell osäkerhet och inflation som driver priset. Och när alla har ”köpt färdigt” guld, då blir dynamiken väldigt speciell…
Om majoriteten av guld och silverspekulanter inte längre tror att de kan köpa för att sälja dyrare till någon annan så finns det få anledningar att hålla guld. Detta konstaterades redan 1980 då guldet gjort en fantastisk resa uppåt under ett par intensiva år. Då föll det tillbaks 65 % på drygt två år, och sen dröjde det drygt två decennier innan man började intressera sig för guld på allvar igen.
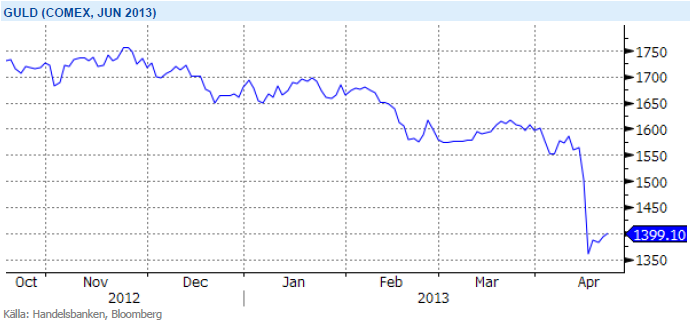
Trots det största raset på 30 år tror vi att förtroendet för guld håller på urholkas och att trenden nedåt fortsätter. Vi tror på: SHRT GULD H
Energi
Utsläppsrätterna – i händer på politiken
Elkontraktet Q3 2013 faller tillbaka med över 5 procent under veckan och det är mest till följd av utsläppsrätterna som rasar med över 34 procent. Ser vi till CO2-marknaden kan dess fortsatta existens nu stark ifrågasättas efter att parlamentet röstat emot kommissionens förslag om att minska överskottet på rätter. Förslaget om ”backloading” innebär att hålla tillbaka allokeringen om 900 miljoner rätter mot slutet av fas III för att balansera marknaden men det är nu mycket ovisst vad som kommer hända framöver. Sannolikt att det kommer att handlas på nuvarande nivå om 2-3 euro, dvs ca 2 öre per kWh på elpriset, så länge det finns hopp om att kommissionen kommer att agera på något sätt för att upprätthålla förtroendet.
På dessa låga nivåer finns dock inga större incitament att investera i minskade utsläpp! Vi kan liksom tidigare konstatera att denna marknad varit fel utformad från dag 1 och lägg därtill misslyckandet om att få till ett globalt direktiv – en central del för en fungerande marknad och långsiktig överlevnad. Vi behöver en mer överskådlig parameter vad gäller utsläppskostnader och dess inverkan på elpriset. Inte omöjligt att det istället blir någon form av skatt emot vilken nuvarande överskott kan kvittas, på så sätt bör kommissionen kunna erkänna sitt misslyckande och ändå rädda ansiktet.
Kort om oljan, som under veckan handlas under 100 USD: OPEC har varit väldigt aktiva i att styra priset efter stora prisfall och vi väntar oss att kartellen griper in vilken dag som helst och drar tillbaka produktion. Vi ser olja under 100 som klart köpvärd.
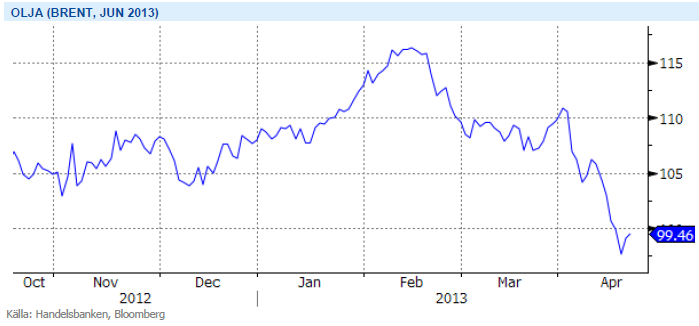
OPEC har tidigare aktivt och framgångsrikt försvarat prismålet 100-110 USD och vi väntar oss handling snarare än besked från kartellen inom kort. Konflikten mellan Israel och Iran är nästa skäl att förvänta sig högre oljepriser under H2. Vi tror på: LONG OLJA H
Livsmedel
Än är inte faran över för vetet
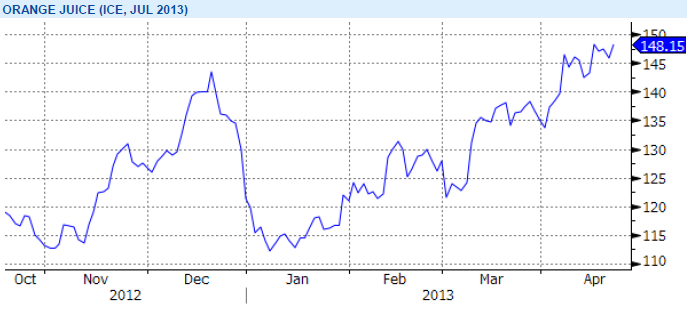
Vete avslutar denna vecka i princip oförändrad (svagt ned). Än är vi inte helt ute ur en känslig period för höstvetet och än är inte vårsådden helt klar i alla områden. Dock förbättras situationen (om än sakta) i de flesta områden och risken för bakslag minskar. Det är dock långt kvar till skörd och väldigt mycket kan ske fram tills dess – med väldigt små lager får eventuella väderproblem lätt stora och snabba effekter i form av stigande priser. I dagsläget finner vi dock inte skäl till större oro utan är kvar i vår tro om en relativt kraftig återhämtning av den globala spannmålsproduktionen – med följden att vi väntar oss lägre priser på vete längre fram på året.
Under våren har priset på apelsinjuice skjutit i höjden p.g.a. minskad produktion som en följd av frost, bakteriesjukdom och torrt väder i Florida. I veckan nådde priset nästan årshögsta efter spekulationer kring en aktiv orkansäsong som närmar sig och som skulle hota den redan drabbade trädplanteringen i Florida ytterligare.
För kakao behåller vi vår vy och är fortsatt positiva efter signaler om stigande konsumtion. Siffror från National Confectioners Association i veckan ger fortsatt stöd till kakaopriset. Rapporten visade på ökat processande av kakao i Nordamerika för Q1-13 jämfört med samma period förra året.
Då priserna har på de stora jordbruksråvarorna soja, majs och vete har fallit tillbaka till nivåer före torkan i USA, tror vi att en nedsida är begränsad på kort sikt och därför är vi neutrala till utvecklingen för denna sektor.
Handelsbankens Råvaruindex
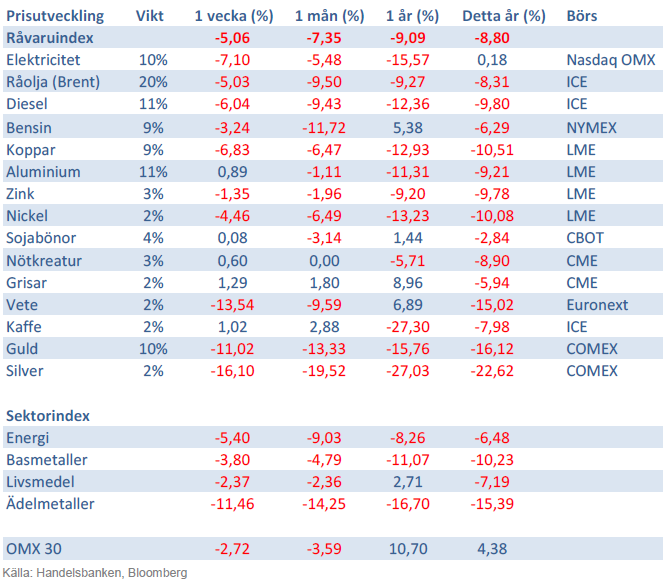
Handelsbankens råvaruindex består av de underliggande indexen för respektive råvara. Vikterna är bestämda till hälften från värdet av nordisk produktion (globala produktionen för sektorindex) och till hälften från likviditeten i terminskontrakten.
[box]SHB Råvarubrevet är producerat av Handelsbanken och publiceras i samarbete och med tillstånd på Råvarumarknaden.se[/box]
Ansvarsbegränsning
Detta material är producerat av Svenska Handelsbanken AB (publ) i fortsättningen kallad Handelsbanken. De som arbetar med innehållet är inte analytiker och materialet är inte oberoende investeringsanalys. Innehållet är uteslutande avsett för kunder i Sverige. Syftet är att ge en allmän information till Handelsbankens kunder och utgör inte ett personligt investeringsråd eller en personlig rekommendation. Informationen ska inte ensamt utgöra underlag för investeringsbeslut. Kunder bör inhämta råd från sina rådgivare och basera sina investeringsbeslut utifrån egen erfarenhet.
Informationen i materialet kan ändras och också avvika från de åsikter som uttrycks i oberoende investeringsanalyser från Handelsbanken. Informationen grundar sig på allmänt tillgänglig information och är hämtad från källor som bedöms som tillförlitliga, men riktigheten kan inte garanteras och informationen kan vara ofullständig eller nedkortad. Ingen del av förslaget får reproduceras eller distribueras till någon annan person utan att Handelsbanken dessförinnan lämnat sitt skriftliga medgivande. Handelsbanken ansvarar inte för att materialet används på ett sätt som strider mot förbudet mot vidarebefordran eller offentliggörs i strid med bankens regler.


Some rebound but not much. Brent crude rebounded 1.5% yesterday to $65.47/b. This morning it is inching 0.2% up to $65.6/b. The lowest close last week was on Thursday at $64.11/b.

The curve structure is almost as week as it was before the weekend. The rebound we now have gotten post the message from OPEC+ over the weekend is to a large degree a rebound along the curve rather than much strengthening at the front-end of the curve. That part of the curve structure is almost as weak as it was last Thursday.
We are still on a weakening path. The message from OPEC+ over the weekend was we are still on a weakening path with rising supply from the group. It is just not as rapidly weakening as was feared ahead of the weekend when a quota hike of 500 kb/d/mth for November was discussed.
The Brent curve is on its way to full contango with Brent dipping into the $50ies/b. Thus the ongoing weakening we have had in the crude curve since the start of the year, and especially since early June, will continue until the Brent crude oil forward curve is in full contango along with visibly rising US and OECD oil inventories. The front-month Brent contract will then flip down towards the $60/b-line and below into the $50ies/b.
At what point will OPEC+ turn to cuts? The big question then becomes: When will OPEC+ turn around to make some cuts? At what (price) point will they choose to stabilize the market? Because for sure they will. Higher oil inventories, some more shedding of drilling rigs in US shale and Brent into the 50ies somewhere is probably where the group will step in.
There is nothing we have seen from the group so far which indicates that they will close their eyes, let the world drown in oil and the oil price crash to $40/b or below.
The message from OPEC+ is also about balance and stability. The world won’t drown in oil in 2026. The message from the group as far as we manage to interpret it is twofold: 1) Taking back market share which requires a lower price for non-OPEC+ to back off a bit, and 2) Oil market stability and balance. It is not just about 1. Thus fretting about how we are all going to drown in oil in 2026 is totally off the mark by just focusing on point 1.
When to buy cal 2026? Before Christmas when Brent hits $55/b and before OPEC+ holds its last meeting of the year which is likely to be in early December.
Brent crude oil prices have rebounded a bit along the forward curve. Not much strengthening in the structure of the curve. The front-end backwardation is not much stronger today than on its weakest level so far this year which was on Thursday last week.

The front-end backwardation fell to its weakest level so far this year on Thursday last week. A slight pickup yesterday and today, but still very close to the weakest year to date. More oil from OPEC+ in the coming months and softer demand and rising inventories. We are heading for yet softer levels.

Down to the lowest since early May. Brent crude has fallen sharply the latest four days. It closed at USD 64.11/b yesterday which is the lowest since early May. It is staging a 1.3% rebound this morning along with gains in both equities and industrial metals with an added touch of support from a softer USD on top.
What stands out the most to us this week is the collapse in the Dubai one to three months time-spread.
Dubai is medium sour crude. OPEC+ is in general medium sour crude production. Asian refineries are predominantly designed to process medium sour crude. So Dubai is the real measure of the balance between OPEC+ holding back or not versus Asian oil demand for consumption and stock building.
A sharp weakening of the front-end of the Dubai curve. The front-end of the Dubai crude curve has been holding out very solidly throughout this summer while the front-end of the Brent and WTI curves have been steadily softening. But the strength in the Dubai curve in our view was carrying the crude oil market in general. A source of strength in the crude oil market. The core of the strength.
The now finally sharp decline of the front-end of the Dubai crude curve is thus a strong shift. Weakness in the Dubai crude marker is weakness in the core of the oil market. The core which has helped to hold the oil market elevated.
Facts supports the weakening. Add in facts of Iraq lifting production from Kurdistan through Turkey. Saudi Arabia lifting production to 10 mb/d in September (normal production level) and lifting exports as well as domestic demand for oil for power for air con is fading along with summer heat. Add also in counter seasonal rise in US crude and product stocks last week. US oil stocks usually decline by 1.3 mb/week this time of year. Last week they instead rose 6.4 mb/week (+7.2 mb if including SPR). Total US commercial oil stocks are now only 2.1 mb below the 2015-19 seasonal average. US oil stocks normally decline from now to Christmas. If they instead continue to rise, then it will be strongly counter seasonal rise and will create a very strong bearish pressure on oil prices.
Will OPEC+ lift its voluntary quotas by zero, 137 kb/d, 500 kb/d or 1.5 mb/d? On Sunday of course OPEC+ will decide on how much to unwind of the remaining 1.5 mb/d of voluntary quotas for November. Will it be 137 kb/d yet again as for October? Will it be 500 kb/d as was talked about earlier this week? Or will it be a full unwind in one go of 1.5 mb/d? We think most likely now it will be at least 500 kb/d and possibly a full unwind. We discussed this in a not earlier this week: ”500 kb/d of voluntary quotas in October. But a full unwind of 1.5 mb/d”
The strength in the front-end of the Dubai curve held out through summer while Brent and WTI curve structures weakened steadily. That core strength helped to keep flat crude oil prices elevated close to the 70-line. Now also the Dubai curve has given in.

Brent crude oil forward curves

Total US commercial stocks now close to normal. Counter seasonal rise last week. Rest of year?

Total US crude and product stocks on a steady trend higher.

Analys
OPEC+ will likely unwind 500 kb/d of voluntary quotas in October. But a full unwind of 1.5 mb/d in one go could be in the cards
Down to mid-60ies as Iraq lifts production while Saudi may be tired of voluntary cut frugality. The Brent December contract dropped 1.6% yesterday to USD 66.03/b. This morning it is down another 0.3% to USD 65.8/b. The drop in the price came on the back of the combined news that Iraq has resumed 190 kb/d of production in Kurdistan with exports through Turkey while OPEC+ delegates send signals that the group will unwind the remaining 1.65 mb/d (less the 137 kb/d in October) of voluntary cuts at a pace of 500 kb/d per month pace.
Signals of accelerated unwind and Iraqi increase may be connected. Russia, Kazakhstan and Iraq were main offenders versus the voluntary quotas they had agreed to follow. Russia had a production ’debt’ (cumulative overproduction versus quota) of close to 90 mb in March this year while Kazakhstan had a ’debt’ of about 60 mb and the same for Iraq. This apparently made Saudi Arabia angry this spring. Why should Saudi Arabia hold back if the other voluntary cutters were just freeriding? Thus the sudden rapid unwinding of voluntary cuts. That is at least one angle of explanations for the accelerated unwinding.
If the offenders with production debts then refrained from lifting production as the voluntary cuts were rapidly unwinded, then they could ’pay back’ their ’debts’ as they would under-produce versus the new and steadily higher quotas.
Forget about Kazakhstan. Its production was just too far above the quotas with no hope that the country would hold back production due to cross-ownership of oil assets by international oil companies. But Russia and Iraq should be able to do it.
Iraqi cumulative overproduction versus quotas could reach 85-90 mb in October. Iraq has however steadily continued to overproduce by 3-5 mb per month. In July its new and gradually higher quota came close to equal with a cumulative overproduction of only 0.6 mb that month. In August again however its production had an overshoot of 100 kb/d or 3.1 mb for the month. Its cumulative production debt had then risen to close to 80 mb. We don’t know for September yet. But looking at October we now know that its production will likely average close to 4.5 mb/d due to the revival of 190 kb/d of production in Kurdistan. Its quota however will only be 4.24 mb/d. Its overproduction in October will thus likely be around 250 kb/d above its quota with its production debt rising another 7-8 mb to a total of close to 90 mb.
Again, why should Saudi Arabia be frugal while Iraq is freeriding. Better to get rid of the voluntary quotas as quickly as possible and then start all over with clean sheets.
Unwinding the remaining 1.513 mb/d in one go in October? If OPEC+ unwinds the remaining 1.513 mb/d of voluntary cuts in one big go in October, then Iraq’s quota will be around 4.4 mb/d for October versus its likely production of close to 4.5 mb/d for the coming month..
OPEC+ should thus unwind the remaining 1.513 mb/d (1.65 – 0.137 mb/d) in one go for October in order for the quota of Iraq to be able to keep track with Iraq’s actual production increase.
October 5 will show how it plays out. But a quota unwind of at least 500 kb/d for Oct seems likely. An overall increase of at least 500 kb/d in the voluntary quota for October looks likely. But it could be the whole 1.513 mb/d in one go. If the increase in the quota is ’only’ 500 kb/d then Iraqi cumulative production will still rise by 5.7 mb to a total of 85 mb in October.
Iraqi production debt versus quotas will likely rise by 5.7 mb in October if OPEC+ only lifts the overall quota by 500 kb/d in October. Here assuming historical production debt did not rise in September. That Iraq lifts its production by 190 kb/d in October to 4.47 mb/d (August level + 190 kb/d) and that OPEC+ unwinds 500 kb/d of the remining quotas in October when they decide on this on 5 October.


Silver spränger den magiska gränsen, kostar nu över 50 USD per uns

Blykalla, Evroc och Studsvik vill bygga kärnkraftsdrivna datacenter i Sverige

Toppmöte om framtidens kärnkraft runt Östersjön hölls idag

Nytt prisrekord, guld stiger över 4000 USD

Goldman Sachs höjer prognosen för guld, tror priset når 4900 USD

Mahvie Minerals i en guldtrend
Volatile but going nowhere. Brent crude circles USD 66 as market weighs surplus vs risk

Aktier i guldbolag laggar priset på guld

Kinas elproduktion slog nytt rekord i augusti, vilket även kolkraft gjorde

Tyskland har så höga elpriser att företag inte har råd att använda elektricitet
-
 Nyheter4 veckor sedan
Mahvie Minerals i en guldtrend
-
Analys4 veckor sedan
Volatile but going nowhere. Brent crude circles USD 66 as market weighs surplus vs risk
-
 Nyheter4 veckor sedan
Aktier i guldbolag laggar priset på guld
-
 Nyheter4 veckor sedan
Kinas elproduktion slog nytt rekord i augusti, vilket även kolkraft gjorde
-
Nyheter3 veckor sedan
Tyskland har så höga elpriser att företag inte har råd att använda elektricitet
-

 Nyheter4 veckor sedan
Guld når sin högsta nivå någonsin, nu även justerat för inflation
-

 Nyheter4 veckor sedan
Det stigande guldpriset en utmaning för smyckesköpare
-
Analys4 veckor sedan
Waiting for the surplus while we worry about Israel and Qatar