

Analys
SHB Råvarubrevet 17 januari 2014

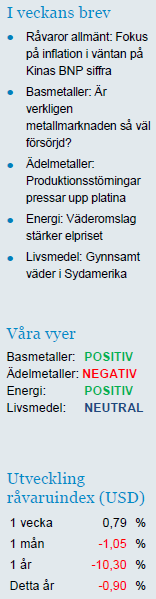 Råvaror allmänt:
Fokus på inflation i väntan på Kinas BNP siffra
All fokus på deflationstendenser i Europa och USA under veckan. USA data oroar inte även om förra fredagens arbetsmarknadsrapport var oväntat svag. Ärkekylan i Nordamerika har nog gett sitt bidrag till den siffran.
Istället fokuserar marknaden på den låga inflationen. Om den förblir låg trots att makrodata förbättras kommer sannolikt FED låta räntan ligga kvar på nuvarande låga nivåer vilket kan ge konjunkturen ytterligare skjuts. Även i Europa är inflationen låg. Inte minst fallande priser på livsmedelsråvaror har bidragit till det låga inflationstrycket som eventuellt kommer tvinga ECB till ytterligare aktioner. Nästa vecka, på måndag, kommer Kinas helårs BNP siffra, ingen stor sak enligt oss då det är tillrättalagd data. Kina kommer snart somna in i nyårsfirande under sista veckan i januari och som vanligt blir tiden därefter viktig för att ta ut riktningen för vårens utveckling på råvarumarknaden. Förra året kom aldrig Kina igång efter nyårsledigheten och vi minns ju alla hur råvarupriserna föll under fjolårets första halvår.
Basmetaller: Är verkligen metallmarknaden så väl försörjd?
En viktig kopparfråga inför 2014 är om gruvorna ska fortsätta klara sig med mindre driftstörningar än normalt? Så var fallet under 2013 och det var en av förklaringarna till att produktionen ökade med 9 % mot historiska snittet på 2,5 %. Speciellt under andra halvåret ökade gruvproduktionen och fick priset på fall. I början av detta år ser det mer positivt ut med en stark import av koppar till Kina.
Annars är nickel metallen med stort M just nu. Vi har hetsat upp oss över nickel sedan i december, baserat på låga prisnivåer, det nu lanserade exportstoppet av oförädlad nickelmalm från Indonesien och det faktum att 40 % av gruvorna går med förlust på dagens prisnivå (vår så kallade cocktail där exportstoppet är den starka ingrediensen). Situationen är inte hållbar och priset har nu stigit 5 dagar i rad. Världens metallanalytiker har snabbt delat upp sig i två läger; de som tror att historien snabbt passerar och de som tror att det blir långvarig påverkan på nickelmarknaden. Vi sällar oss som bekant till de senare. Ett tungt vägande skäl är sommarens val i Indonesien som riskerar att skapa en ordentlig soppa av en redan rörig situation kring exportförbudet och dess effekter som nu gör ca 1 miljon människor arbetslösa i Indonesien. Vi lär återkomma i ämnet.
Zink är en annan rallande basmetall. Fjolåret visar nu på ett oväntat underskott i marknaden där LME:s lager föll med 300 000 ton. Begränsningar i Kinas produktion, lägre produktion utanför Kina och en starkare efterfrågan under andra halvåret har bättrat på marknadsbalansen. Efter att en av de riktigt stora indexdrakarna nu slutat sälja zink efter ombalanseringen kring årsskiftet så har nu zink klättrat uppåt.
Vi tror sammantaget att basmetallerna kommer stiga några veckor till innan de åter vänder ned. Vi tror på: LONG BASMETALLER H
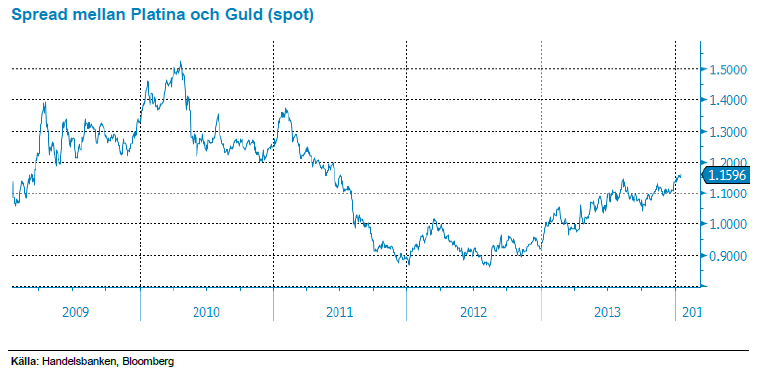
Ädelmetaller: Produktionsstörningar pressar upp platina
Vi lägger en ganska händelselös vecka för guldet till handlingarna, en marginell prisnedgång och tight range utan nya signaler eller nyheter. Vår negativa vy ligger kvar intakt, även om vi – som vi beskrev förra veckan – kan se möjligheter för den riskvillige och opportunistiske köparen. En av våra favorittrades från förra året kan vara smart i detta läge – lång platina mot guld. Denna beskrev vi helt kort i Börsrummet 17 juni, och denna spread har sedan början av 2013 stigit med nära 26 % (varav 12 % sedan den 17 juni…). Det betyder att platina blivit 26 % mer värt RELATIVT guldet, fast att även platina föll under 2013. Fördelen med en ”marknadsneutral” position i två olika ädelmetaller mot varandra är att man inte behöver riskera att sitta fel i en rekyl uppåt i guldpriset, även om man – som vi – är negativ till guldet.
Vårt resonemang kring guldet är numera bekant – man köper det bara för att sälja dyrare – medan platina är en ädelmetall som faktiskt behövs till något (främst katalysatorer till bilindustrin). Platina har dessutom brottats med produktionsstörningar i Sydafrika under året som gått.
Sättet att skapa sig en ”spreadposition” i dessa är att köpa – för lika mycket pengar – LONG PLAT H och SHRT GULD H. Genom att göra detta tar man en vy enbart på dessa ädelmetallers värdering relativt varandra, och man blir mindre exponerad mot en underliggande marknadsrörelse i ädelmetallsektorn.
Vi tror på mindre exponering mot en underliggande marknadsrörelse i ädelmetallsektorn. Vi tror på: Spreaden mellan LONG PLAT H och SHRT GULD H
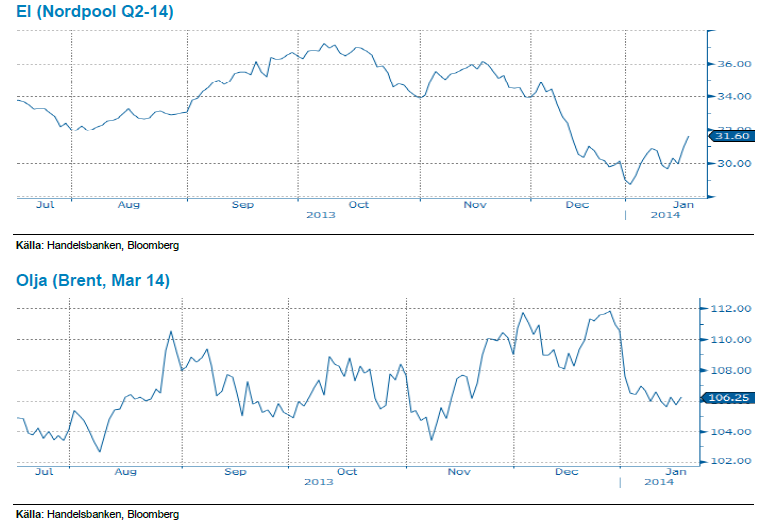
Energi: Väderomslag stärker elpriset
Som vi skrev förra veckan har väderskiftet till kallare och torrare väder har drivit upp både spotpriset och terminspriser. Q2-14 (underliggande till SHB Power) har stigit med nästan 7 % under veckan. Det hydrologiska läget för norden har försämrats marginellt och ligger nu runt –2.8 TWh. Vi bedömer att energiunderskottet kommer att fortsätta öka på grund av betydligt högre lastnivå och en prognostiserad nederbörd under normalt.
Väderprognoser för Sverige och Norge för 10 dygn framåt visar på temperaturer på 2-3 grader under de normala. Nederbördsprognoserna visar på drygt 2.5 TWh under normalen för de kommande 10 dygnen. Det finns en god körvilja hos vattenkraftverken och vi har ett läge som inte stimulerar till allt för mycket sparande sett till spotpriset, vilket gör att vi tycker att närmaste kvartalskontrakten känns rätt värderade. Dock vill vi reservera oss för att om det kalla och torra vädret håller i sig under en längre period kan både spotpriset och terminskurvan justeras upp.
Oljepriset (brent) har pendlat runt 105-106 USD/fat under veckan och handlas i skrivande stund på USD 105,9.
Priset på Brent steg 1,5 % efter lagernivåer i USA föll mer än väntat, 7,66 miljoner fat mot väntade 0,67 miljoner. Vi har nu har de lägsta lagernivåerna på totalt 350,2 miljoner fat på 22 månader. USA:s stigande produktion fortsätter, driven av utvinning av skifferolja, och ligger nu på 8,16 miljoner fat per dag- detta att jämföra med Saudi Arabien (OPEC största producent) 9,68 mfpd. Ett avtal gällande Irans kärnprogram träder i kraft den 20 januari efter överenskommelse i förra veckan som bland annat innebär att Iran stoppar utvecklingen av kärnenergiprogram och anläggningar öppnas för inspektioner.
Vi tror att det kommer ges möjligheter till god avkastning i denna range-baserade handel där oljan är köpvärd var gång den kommer ned på dessa lite lägre nivåer. Vi tror på: LONG OLJA H
Livsmedel: Gynnsamt väder i Sydamerika
Priserna på majs i Chicago har gått ned under den gångna veckan, delvis påverkat av fallande priser på vete. En del regn har fallit i Argentina under veckan men klart mer behövs, främst i söder. Nästa vecka ser något bättre ut med mer regnperioder än torrperioder. Omkring 80 procent av sådden i Argentina uppges nu vara avklarad. Situationen har nu förbättrats något i Argentina och annars inga större problem att rapportera om varför det känns svårt att se varför majspriserna skulle vända uppåt.
Priserna i Chicago på sojabönor har stigit under veckan med stöd från fortsatt stark efterfrågan från Kina. Vädret i Sydamerika är generellt sett väldigt fördelaktigt och hoppet om en kommande rekordskörd stärks samtidigt som risken för bakslag blir allt mindre efter hand som skörden kommer närmare. 96 procent av den argentinska sådden uppges nu vara avklarad. Vad som ytterligare spär på tron om lägre priser på soja framöver är en förväntad stor areal i USA till våren – relationen mellan majspriser och sojapriser talar helt klart för en ökad areal soja på bekostnad av majs.
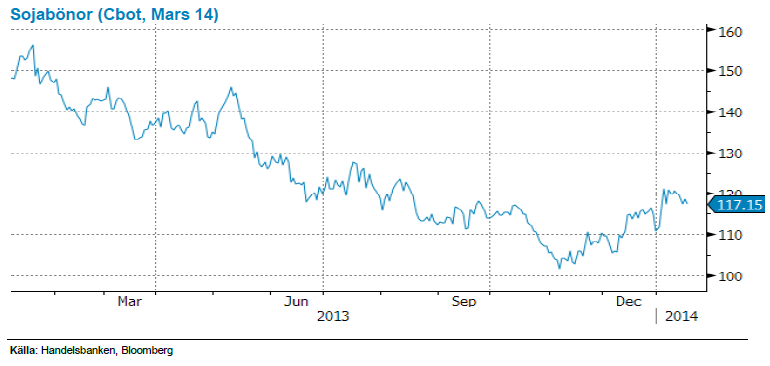
Stor skörd på ingång i Brasilien för sojabönor. Vi tror på: BEAR SOJA H
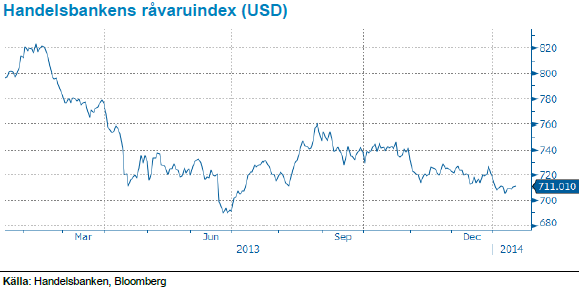
Handelsbankens råvaruindex
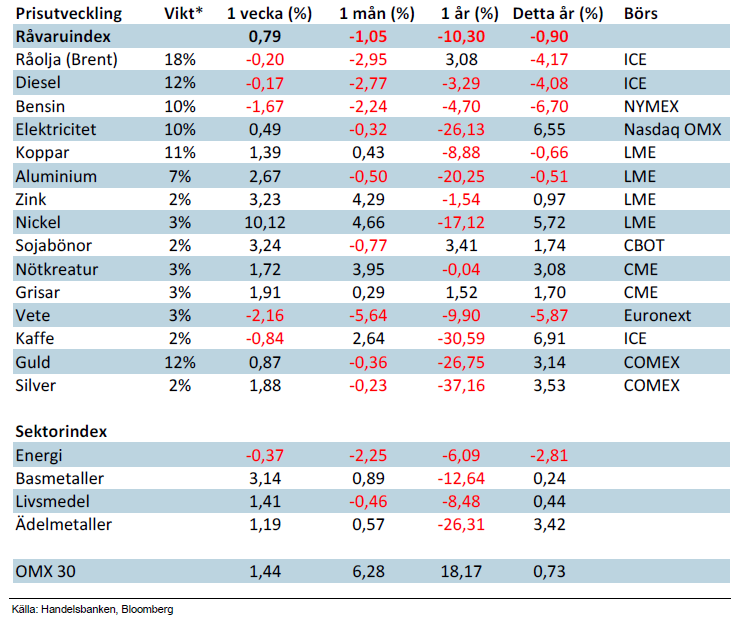
*Uppdaterade vikter från 29 november 2013
Handelsbankens råvaruindex består av de underliggande indexen för respektive råvara. Vikterna är bestämda till hälften från värdet av nordisk produktion (globala produktionen för sektorindex) och till hälften från likviditeten i terminskontrakten.
[box]SHB Råvarubrevet är producerat av Handelsbanken och publiceras i samarbete och med tillstånd på Råvarumarknaden.se[/box]
Ansvarsbegränsning
Detta material är producerat av Svenska Handelsbanken AB (publ) i fortsättningen kallad Handelsbanken. De som arbetar med innehållet är inte analytiker och materialet är inte oberoende investeringsanalys. Innehållet är uteslutande avsett för kunder i Sverige. Syftet är att ge en allmän information till Handelsbankens kunder och utgör inte ett personligt investeringsråd eller en personlig rekommendation. Informationen ska inte ensamt utgöra underlag för investeringsbeslut. Kunder bör inhämta råd från sina rådgivare och basera sina investeringsbeslut utifrån egen erfarenhet.
Informationen i materialet kan ändras och också avvika från de åsikter som uttrycks i oberoende investeringsanalyser från Handelsbanken. Informationen grundar sig på allmänt tillgänglig information och är hämtad från källor som bedöms som tillförlitliga, men riktigheten kan inte garanteras och informationen kan vara ofullständig eller nedkortad. Ingen del av förslaget får reproduceras eller distribueras till någon annan person utan att Handelsbanken dessförinnan lämnat sitt skriftliga medgivande. Handelsbanken ansvarar inte för att materialet används på ett sätt som strider mot förbudet mot vidarebefordran eller offentliggörs i strid med bankens regler.


Some rebound but not much. Brent crude rebounded 1.5% yesterday to $65.47/b. This morning it is inching 0.2% up to $65.6/b. The lowest close last week was on Thursday at $64.11/b.

The curve structure is almost as week as it was before the weekend. The rebound we now have gotten post the message from OPEC+ over the weekend is to a large degree a rebound along the curve rather than much strengthening at the front-end of the curve. That part of the curve structure is almost as weak as it was last Thursday.
We are still on a weakening path. The message from OPEC+ over the weekend was we are still on a weakening path with rising supply from the group. It is just not as rapidly weakening as was feared ahead of the weekend when a quota hike of 500 kb/d/mth for November was discussed.
The Brent curve is on its way to full contango with Brent dipping into the $50ies/b. Thus the ongoing weakening we have had in the crude curve since the start of the year, and especially since early June, will continue until the Brent crude oil forward curve is in full contango along with visibly rising US and OECD oil inventories. The front-month Brent contract will then flip down towards the $60/b-line and below into the $50ies/b.
At what point will OPEC+ turn to cuts? The big question then becomes: When will OPEC+ turn around to make some cuts? At what (price) point will they choose to stabilize the market? Because for sure they will. Higher oil inventories, some more shedding of drilling rigs in US shale and Brent into the 50ies somewhere is probably where the group will step in.
There is nothing we have seen from the group so far which indicates that they will close their eyes, let the world drown in oil and the oil price crash to $40/b or below.
The message from OPEC+ is also about balance and stability. The world won’t drown in oil in 2026. The message from the group as far as we manage to interpret it is twofold: 1) Taking back market share which requires a lower price for non-OPEC+ to back off a bit, and 2) Oil market stability and balance. It is not just about 1. Thus fretting about how we are all going to drown in oil in 2026 is totally off the mark by just focusing on point 1.
When to buy cal 2026? Before Christmas when Brent hits $55/b and before OPEC+ holds its last meeting of the year which is likely to be in early December.
Brent crude oil prices have rebounded a bit along the forward curve. Not much strengthening in the structure of the curve. The front-end backwardation is not much stronger today than on its weakest level so far this year which was on Thursday last week.

The front-end backwardation fell to its weakest level so far this year on Thursday last week. A slight pickup yesterday and today, but still very close to the weakest year to date. More oil from OPEC+ in the coming months and softer demand and rising inventories. We are heading for yet softer levels.

Down to the lowest since early May. Brent crude has fallen sharply the latest four days. It closed at USD 64.11/b yesterday which is the lowest since early May. It is staging a 1.3% rebound this morning along with gains in both equities and industrial metals with an added touch of support from a softer USD on top.
What stands out the most to us this week is the collapse in the Dubai one to three months time-spread.
Dubai is medium sour crude. OPEC+ is in general medium sour crude production. Asian refineries are predominantly designed to process medium sour crude. So Dubai is the real measure of the balance between OPEC+ holding back or not versus Asian oil demand for consumption and stock building.
A sharp weakening of the front-end of the Dubai curve. The front-end of the Dubai crude curve has been holding out very solidly throughout this summer while the front-end of the Brent and WTI curves have been steadily softening. But the strength in the Dubai curve in our view was carrying the crude oil market in general. A source of strength in the crude oil market. The core of the strength.
The now finally sharp decline of the front-end of the Dubai crude curve is thus a strong shift. Weakness in the Dubai crude marker is weakness in the core of the oil market. The core which has helped to hold the oil market elevated.
Facts supports the weakening. Add in facts of Iraq lifting production from Kurdistan through Turkey. Saudi Arabia lifting production to 10 mb/d in September (normal production level) and lifting exports as well as domestic demand for oil for power for air con is fading along with summer heat. Add also in counter seasonal rise in US crude and product stocks last week. US oil stocks usually decline by 1.3 mb/week this time of year. Last week they instead rose 6.4 mb/week (+7.2 mb if including SPR). Total US commercial oil stocks are now only 2.1 mb below the 2015-19 seasonal average. US oil stocks normally decline from now to Christmas. If they instead continue to rise, then it will be strongly counter seasonal rise and will create a very strong bearish pressure on oil prices.
Will OPEC+ lift its voluntary quotas by zero, 137 kb/d, 500 kb/d or 1.5 mb/d? On Sunday of course OPEC+ will decide on how much to unwind of the remaining 1.5 mb/d of voluntary quotas for November. Will it be 137 kb/d yet again as for October? Will it be 500 kb/d as was talked about earlier this week? Or will it be a full unwind in one go of 1.5 mb/d? We think most likely now it will be at least 500 kb/d and possibly a full unwind. We discussed this in a not earlier this week: ”500 kb/d of voluntary quotas in October. But a full unwind of 1.5 mb/d”
The strength in the front-end of the Dubai curve held out through summer while Brent and WTI curve structures weakened steadily. That core strength helped to keep flat crude oil prices elevated close to the 70-line. Now also the Dubai curve has given in.

Brent crude oil forward curves

Total US commercial stocks now close to normal. Counter seasonal rise last week. Rest of year?

Total US crude and product stocks on a steady trend higher.

Analys
OPEC+ will likely unwind 500 kb/d of voluntary quotas in October. But a full unwind of 1.5 mb/d in one go could be in the cards
Down to mid-60ies as Iraq lifts production while Saudi may be tired of voluntary cut frugality. The Brent December contract dropped 1.6% yesterday to USD 66.03/b. This morning it is down another 0.3% to USD 65.8/b. The drop in the price came on the back of the combined news that Iraq has resumed 190 kb/d of production in Kurdistan with exports through Turkey while OPEC+ delegates send signals that the group will unwind the remaining 1.65 mb/d (less the 137 kb/d in October) of voluntary cuts at a pace of 500 kb/d per month pace.
Signals of accelerated unwind and Iraqi increase may be connected. Russia, Kazakhstan and Iraq were main offenders versus the voluntary quotas they had agreed to follow. Russia had a production ’debt’ (cumulative overproduction versus quota) of close to 90 mb in March this year while Kazakhstan had a ’debt’ of about 60 mb and the same for Iraq. This apparently made Saudi Arabia angry this spring. Why should Saudi Arabia hold back if the other voluntary cutters were just freeriding? Thus the sudden rapid unwinding of voluntary cuts. That is at least one angle of explanations for the accelerated unwinding.
If the offenders with production debts then refrained from lifting production as the voluntary cuts were rapidly unwinded, then they could ’pay back’ their ’debts’ as they would under-produce versus the new and steadily higher quotas.
Forget about Kazakhstan. Its production was just too far above the quotas with no hope that the country would hold back production due to cross-ownership of oil assets by international oil companies. But Russia and Iraq should be able to do it.
Iraqi cumulative overproduction versus quotas could reach 85-90 mb in October. Iraq has however steadily continued to overproduce by 3-5 mb per month. In July its new and gradually higher quota came close to equal with a cumulative overproduction of only 0.6 mb that month. In August again however its production had an overshoot of 100 kb/d or 3.1 mb for the month. Its cumulative production debt had then risen to close to 80 mb. We don’t know for September yet. But looking at October we now know that its production will likely average close to 4.5 mb/d due to the revival of 190 kb/d of production in Kurdistan. Its quota however will only be 4.24 mb/d. Its overproduction in October will thus likely be around 250 kb/d above its quota with its production debt rising another 7-8 mb to a total of close to 90 mb.
Again, why should Saudi Arabia be frugal while Iraq is freeriding. Better to get rid of the voluntary quotas as quickly as possible and then start all over with clean sheets.
Unwinding the remaining 1.513 mb/d in one go in October? If OPEC+ unwinds the remaining 1.513 mb/d of voluntary cuts in one big go in October, then Iraq’s quota will be around 4.4 mb/d for October versus its likely production of close to 4.5 mb/d for the coming month..
OPEC+ should thus unwind the remaining 1.513 mb/d (1.65 – 0.137 mb/d) in one go for October in order for the quota of Iraq to be able to keep track with Iraq’s actual production increase.
October 5 will show how it plays out. But a quota unwind of at least 500 kb/d for Oct seems likely. An overall increase of at least 500 kb/d in the voluntary quota for October looks likely. But it could be the whole 1.513 mb/d in one go. If the increase in the quota is ’only’ 500 kb/d then Iraqi cumulative production will still rise by 5.7 mb to a total of 85 mb in October.
Iraqi production debt versus quotas will likely rise by 5.7 mb in October if OPEC+ only lifts the overall quota by 500 kb/d in October. Here assuming historical production debt did not rise in September. That Iraq lifts its production by 190 kb/d in October to 4.47 mb/d (August level + 190 kb/d) and that OPEC+ unwinds 500 kb/d of the remining quotas in October when they decide on this on 5 October.


Blykalla, Evroc och Studsvik vill bygga kärnkraftsdrivna datacenter i Sverige

Toppmöte om framtidens kärnkraft runt Östersjön hölls idag

Nytt prisrekord, guld stiger över 4000 USD

Goldman Sachs höjer prognosen för guld, tror priset når 4900 USD
More weakness and lower price levels ahead, but the world won’t drown in oil in 2026

Mahvie Minerals i en guldtrend
Volatile but going nowhere. Brent crude circles USD 66 as market weighs surplus vs risk

Aktier i guldbolag laggar priset på guld

Kinas elproduktion slog nytt rekord i augusti, vilket även kolkraft gjorde

Tyskland har så höga elpriser att företag inte har råd att använda elektricitet
-
 Nyheter4 veckor sedan
Mahvie Minerals i en guldtrend
-
Analys4 veckor sedan
Volatile but going nowhere. Brent crude circles USD 66 as market weighs surplus vs risk
-
 Nyheter4 veckor sedan
Aktier i guldbolag laggar priset på guld
-
 Nyheter3 veckor sedan
Kinas elproduktion slog nytt rekord i augusti, vilket även kolkraft gjorde
-
Nyheter3 veckor sedan
Tyskland har så höga elpriser att företag inte har råd att använda elektricitet
-

 Nyheter4 veckor sedan
Guld når sin högsta nivå någonsin, nu även justerat för inflation
-

 Nyheter4 veckor sedan
Det stigande guldpriset en utmaning för smyckesköpare
-
Analys4 veckor sedan
Waiting for the surplus while we worry about Israel and Qatar