

Analys
SHB Råvarubrevet 15 februari 2013

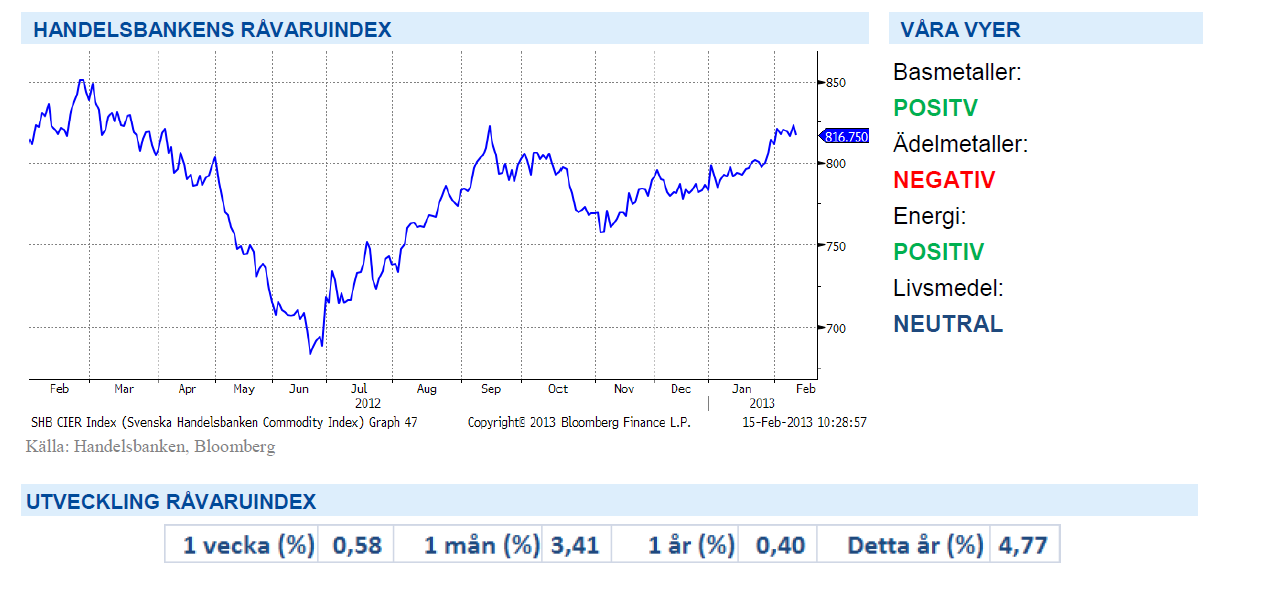
 Intressant vecka trots kinesisk nyårsledighet!
Vi hade väntat oss en lugn vecka på råvarumarknaden när kineserna hade ledigt efter söndagens nyårsfest. Volymerna har visserligen varit lägre men det har ändå varit intressanta rörelser. Guld bröt ner genom sitt starka tekniska motstånd på 1545 och vi skickade idag ut en handels ide där vi tycker att man ska sälja guld med 1550 som mål. Att sälja guld nu är logiskt med vår tro på en starkare konjunktur och en utbredd ”risk on” mentalitet på marknaderna. Vi sätter också större tilltro till de tekniska signalerna för guld än för övriga råvaror då guld har mindre fasta kopplingar till den fundamentala bilden. Vår tro på starkare oljepris håller i sig och under veckan har Brent åter varit uppe över 119 USD. Inte mycket nytt kom ut från Iranmötet i tisdags utan sanktionerna mot Irans oljeexport till USA och EU ligger kvar. Inga nya möten är planerade.
Aluminium nådde ett nytt friskt månadshögsta under veckan på 2166.5 och basmetallerna ser starka ut trots kinesernas frånvaro. Nu krävs att kinas metallhandlare fortsätter köpvågen när de återvänder till handlarborden på måndag.
Basmetallerna
Metaller i fokus
Vårt basmetallindex ligger kvar oförändrat under en förhållandevis lugn vecka och Kinesiskt nyår. Aluminium noteras på månadshögsta samtidigt som ett antal aktörer minskat ned sina contango-positioner, dvs lagrat och finansierat Aluminium och sen låst in en ca 5 procent i årlig avkastning genom att rulla terminerna. Eftersom det är så lugnt på basmetaller kan vi passa på att berätta om en positiv utveckling på den finansiella järnmalmsmarknaden där omsättningen fortsätter att öka. 100 miljoner ton omsattes 2012 (ca 1/10 av den fysiskt handlade) och vi ser ett ökande intresse från investerare. Positivt även för finansiella skrotkontrakt men för färdiga stål är det egentligen bara SHFE som lyckats med sitt Rebar kontrakt, övriga och däribland LME har svårt att attrahera industrins intresse.
Vi tror på fortsatt styrka i konjunkturen och att högre priser kommer nås under slutet av februari. Denna bild har bekräftats av makrodata och fått investerare att allokera om sina portföljer från defensiva positioner till mer konjunkturdrivna råvaror som olja och basmetaller. Basmetaller är ett enkelt sätt att exponera sig mot den ekonomiska utvecklingen i Kina (se Kinas PMI och SHB Basmetaller nedan). En annan intressant bild (se nedan) är den mellan SHB Basmetaller och S&P 500 där vi förväntar oss att gapet kommer ihop på sikt.
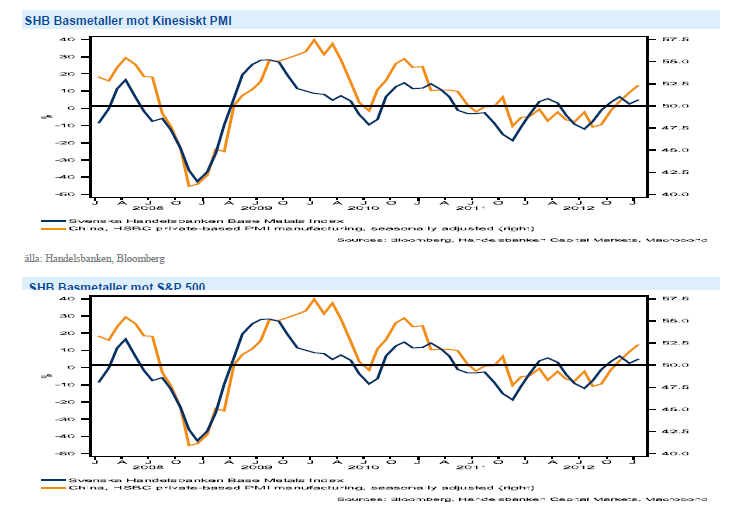
Den globala tillväxten har fått ny kraft och gynnar konjunkturkänsliga råvaror som basmetaller. Vi tror på: BASMET H
Ädelmetaller
Sälj guld på bättre konjunktur
Guld har 12 år med stigande pris i ryggen och blivit råvaran som inte kan gå ner. Under 2012 nådde guld sin högsta nivå 1794 USD/oz under oktober när QE3 yran var som värst. Därefter har guldet hamnat i en fallande trend. Många analytiker räknade med att debaclet kring USA:s skuldtak skulle ge priset stöd under början av året. Så har inte varit fallet och vi ser nu flera skäl till att guldet kommer fortsätta falla nedåt. Sedan de första positiva signalerna kom från Kina i september har bilden av en allt bättre global konjunktur börjat sprida sig. Denna bild har bekräftats av makrodata och fått investerare att allokera om sina portföljer från defensiva positioner till en mer risksökande inriktning. I denna omallokering ingår att lämna guld för ”risk on” tillgångar som aktier och andra mer konjunkturdrivna råvaror som olja och basmetaller. Dessa flöden tro vi kommer fortsätta under våren när finansmarknaden dansar till allt gladare toner från bättre konjunkturdata.
Under senaste veckorna har olja handlats upp samtidigt som guld handlats ner. Det är en klassisk indikator på att en ljusare framtid är här. Tekniskt står guld nu på ett mycket viktigt stöd och fallhöjden är ner till 1530 om guld bryter under 1645. Uppåt tycker vi att en stopp på 1705 är att rekommendera.
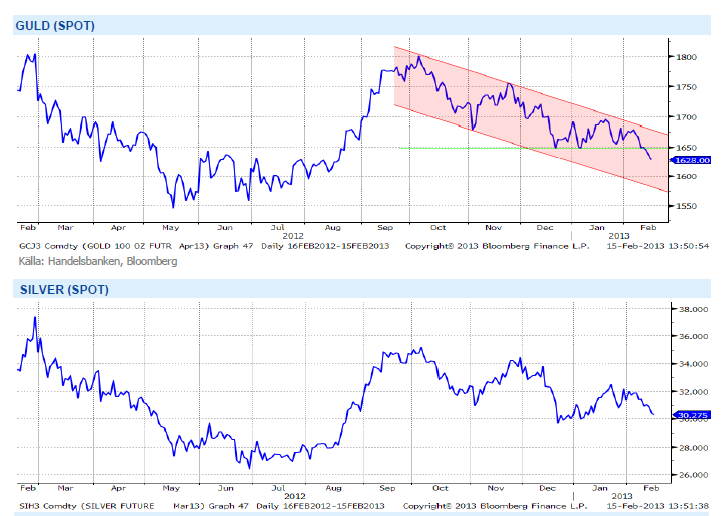
Med fortsatt positivt risksentiment och potentiellt stigande räntenivåer ser vi nästa stora rörelse kommer att vara nedåt. Vi tror på GULD S H
Energi
Starkt sentiment på oljan
Fundamentalt inga större förändringar på oljemarknaden men en ökad oro för att planlagda underhåll på amerikanska raffinader kommer att förvärra lagersituationen på bensin ytterligare i kombination med positiva sysselsättningssiffror ger stöd. Vi är fortsatt positiva till oljan där en rad faktorer som global tillväxt och risk för produktionsbortfall men framför allt en ökad riskaptit som ser ut att tillfälligt kunna driva brentoljan en bit över 120 dollar. En osäker faktor på lite längre sikt är skifferoljan (se bifogad bilaga) där produktionen överträffat alla prognoser framför allt i USA vilket naturligtvis är kopplat till USAs mål om att vara självförsörjande på energi framöver. Utvinningen är dock omstridd och det finns all anledning att tro att miljöfrågorna kommer att hamna mer i fokus.
Elen handlas oförändrat över veckan där fokus varit på utsläppsmarknaden och miljöutskottets möte i veckan som kommer. Sannolikt att vi får någon form av backdrop, dvs förskjuten tilldelning mot slutet av fasen, av de ca 900 miljoner ton som diskuteras men svårt att säga vad det innebär konkret förens parlamentet godkänner förslaget. Det talas om nivåer på uppemot 15 euro per ton vilket skulle innebära ca 7 öre extra på elpriset från dagens nivåer men vår gissning är att de fortsätter att stiga något till fram till mötet för att sedan successivt börja falla tillbaka på vinsthemtagning och osäkerhet om nästa fas och liggar kvar på nivåer strax över 5 euro.
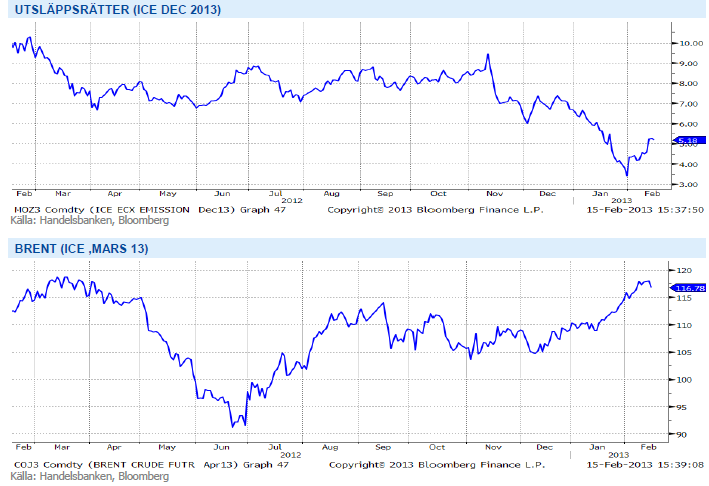
Den råvarugrupp som är mest beroende av den globala konjunkturen är Energi och med en starkare konjunktur ser vi positivt på utvecklingen för denna sektor. Vi tror på: ENERGI H
Livsmedel
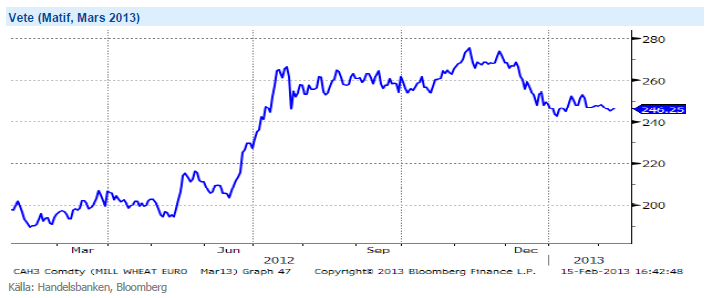
Oron långt ifrån över för Vetet
Terminspriserna på vete noteras ned sedan förra veckan i både Chicago och Paris. Nedgången har delvis påverkats av fortsatta skurar på det amerikanska höstvetet, dock har det ännu inte fallit några större mängder för att göra märkbar skillnad och oron är långt ifrån över. Nästa vecka ser det dessutom ut att bli torrt med endast väldigt små regnmängder, inte alls idealiskt för grödorna. Trots nedgång för veckan som helhet stiger priserna under fredagen, delvis som följd av amerikanska exportsiffror som rapporterats in på högre nivå än väntat – vilka i sin tur påverkas av att de amerikanska vetepriserna nu handlas på lägsta nivå på över sju månader.
I EU bedöms allt fortfarande vara helt ok. Enligt franska officiella siffror är landets höstveteareal upp cirka tre procent från förra årets. I en del områden i Europa har snön regnat bort men temperaturen är relativt hög och ser ut att förbli så framöver. I Ukraina har det blivit lite kallare igen men generellt sett är snötäcket tillräckligt tjockt för att skydda grödorna. I Ryssland bedöms läget generellt sett också vara ok, lite kallare i de norra och centrala delarna men gott om snö och i söder något för torrt men utan större oro. Höstvetet i USA är i riktigt dåligt skick och nederbörden ser ut att bli väldigt begränsad under kommande vecka. I andra veteregioner i världen råder dock inga större problem vilket ger viss press nedåt på priserna. Än finns det dessutom tid för regn att falla inför sådd av majs i USA – vilket spannmålsmarknaden lägger stort fokus på för tillfället. Vetet handlas nu på de lägsta nivåerna sedan juni/juli 2012, givet inga större väderproblem (vilket vi dock blivit ganska vana vid) bör vi kunna vänta oss fortsatt lägre priser lite längre fram på året.
Socker
Sockerpris på nivåer som närmar sig produktionskostnaden, produktions fall i Thailand och ökad efterfrågan på etanol får oss att tro på BULL SOCKER H
Handelsbankens Råvaruindex
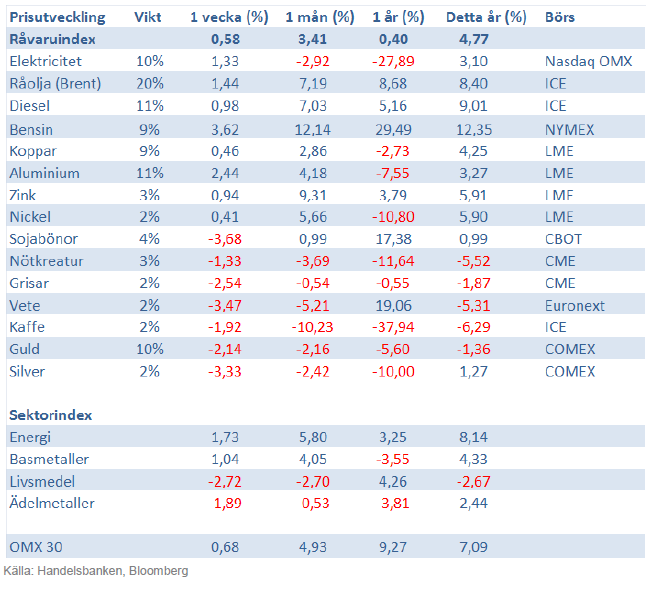
Handelsbankens råvaruindex består av de underliggande indexen för respektive råvara. Vikterna är bestämda till hälften från värdet av global produktion och till hälften från likviditeten i terminskontrakten.
[box]SHB Råvarubrevet är producerat av Handelsbanken och publiceras i samarbete och med tillstånd på Råvarumarknaden.se[/box]
Ansvarsbegränsning
Detta material är producerat av Svenska Handelsbanken AB (publ) i fortsättningen kallad Handelsbanken. De som arbetar med innehållet är inte analytiker och materialet är inte oberoende investeringsanalys. Innehållet är uteslutande avsett för kunder i Sverige. Syftet är att ge en allmän information till Handelsbankens kunder och utgör inte ett personligt investeringsråd eller en personlig rekommendation. Informationen ska inte ensamt utgöra underlag för investeringsbeslut. Kunder bör inhämta råd från sina rådgivare och basera sina investeringsbeslut utifrån egen erfarenhet.
Informationen i materialet kan ändras och också avvika från de åsikter som uttrycks i oberoende investeringsanalyser från Handelsbanken. Informationen grundar sig på allmänt tillgänglig information och är hämtad från källor som bedöms som tillförlitliga, men riktigheten kan inte garanteras och informationen kan vara ofullständig eller nedkortad. Ingen del av förslaget får reproduceras eller distribueras till någon annan person utan att Handelsbanken dessförinnan lämnat sitt skriftliga medgivande. Handelsbanken ansvarar inte för att materialet används på ett sätt som strider mot förbudet mot vidarebefordran eller offentliggörs i strid med bankens regler.


Brent is climbing higher. Front-month is at USD 106.3/bl this morning, close to a weekly high and a USD 9/bl jump from Mondays open. This is the move we flagged as a risk earlier in the week: the market shifting from ”a deal is around the corner” to ”this is going to take longer than we thought”.

Analyst Commodities, SEB
During April, rest-of-year Brent remained remarkably stable around USD 90/bl. A stability which rested on one single assumption: the SoH reopens around 1 May. That assumption is now slowly falling apart.
As we highlighted yesterday: every week of delay beyond 1 May adds (theoretically) ish USD 5/bl to the rest-of-year average, as global inventories draw 100 million barrels per week. i.e., a mid-May reopening implies rest-of-year Brent closer to USD 100/bl, and anything pushing into June or July takes us meaningfully higher.
What’s changed in the last 48 hours:
#1: The US military has formally warned that clearing suspected sea mines from SoH could take up to six months. That is a completely different timescale from what the financial market is pricing. Even a political deal tomorrow does not immediately reopen the strait.
#2: Trump has shifted his tone from urgency to ”strategic patience”. In yesterday’s press conference: ”Don’t rush me… I want a great deal.” The market is reading this as a president no longer feeling pressured by timelines, with the naval blockade running in the background.
#3: So far, the military activity is escalating, not de-escalating. Axios reports Iran is laying more mines in SoH. The US 3rd carrier strike group (USS George H.W. Bush) is arriving with two countermine vessels. Trump yesterday ordered the US Navy to destroy any Iranian boats caught laying mines. While CNN reports that the Pentagon is actively drawing up plans to strike Iranian SoH capabilities and individual Iranian military leaders if the ceasefire collapses. i.e., NOT a attitude consistent with an imminent deal!
Spot crude and product prices eased off the early-April highs on a combination of system rerouting and deal optimism. Both now weakening. Goldman estimates April Gulf output is reduced by 14.5 mbl/d, or 57% of pre-war supply, a number that keeps getting worse the longer this drags on.
Demand-side adaptation is ongoing: S. Korea has cut its Middle East crude dependence from 69% to 56% by pulling more from the Americas and Africa, and Japan is kicking off a second round of SPR releases from 1 May. But SPRs are finite.
Ref. to the negotiations, we should not bet on speed. The current Iranian leadership is dominated by genuine hardliners willing to absorb economic pain and run the clock to extract concessions. That is not a setup for a rapid resolution. US/Israeli media briefings keep framing the delay as ”internal Iranian divisions”, the reality is more complicated and points toward weeks and months, not days.
Our point is that the complexity is large, and higher prices have only just started (given a scenario where the negotiations drag out in time). The market spent April leaning on the USD 90/bl rest-of-year assumption; that case is diminishing by the hour. If ”early May reopening” is replaced by ”June, July or later” over the next week or two, both crude and products have meaningful room to reprice higher from here. There is a high risk being short energy and betting on any immediate political resolution(!).
Down on Friday. Up on Monday. The Brent June crude oil contract traded down 5.1% last week to a close of $90.38/b. It reached a high of $103.87/b last Monday and a low of $86.09/b on Friday as Iran announced that the Strait of Hormuz was fully open for transit. That quickly changed over the weekend as the US upheld its blockade of Iranian oil exports while Iran naturally responded by closing the SoH again. The US blew a hole in the engine room of the Iranian ship TOUSKA and took custody of the ship on Sunday. Brent crude is up 5.6% this morning to $95.4/b.

The cease-fire is expiring tomorrow. The US has said it will send a delegation for a second round of negotiations in Islamabad in Pakistan. But Iran has for now rejected a second round of talks as it views US demands as unrealistic and excessive while the US is also blocking the Strait of Hormuz.
While Brent is up 5% this morning, the financial market is still very optimistic that progress will be made. That talks will continue and that the SoH will fully open by the start of May which is consistent with a rest-of-year average Brent crude oil price of around $90/b with the market now trading that balance at around $88/b.
Financial optimism vs. physical deterioration. We have a divergence where the financial market is trading negotiations, improvements and resolution while at the same time the physical market is deteriorating day by day. Physical oil flows remain constrained by disrupted flows, longer voyage times and elevated freight and insurance costs.
Financial markets are betting that a US/Iranian resolution will save us in time from violent shortages down the road. But every day that the SoH remains closed is bringing us closer to a potentially very painful point of shortages and much higher prices.
The US blockade is also a weapon of leverage against its European and Asian allies. When Iran closed the SoH it held the world economy as a hostage against the US. The US blockade of the SoH is of course blocking Iranian oil exports. But it is also an action of disruption directed towards Europe and Asia. The US has called for the rest of the world to engaged in the war with Iran: ”If you want oil from the Persian Gulf, then go and get it”. A risk is that the US plays brinkmanship with the global oil market directed towards its European and Asian allies and maybe even towards China to force them to engage and take part. Maybe unthinkable. But unthinkable has become the norm with Trump in the White House.
Wild moves yesterday. Brent crude traded to a high of $114.43/b and a low of $96.0/b and closed at $99.94/b yesterday.
US – Iran negotiations ongoing or not? What a day. Donald Trump announced that good talks were ongoing between Iran and the US and that the 48 hour deadline before bombing Iranian power plants and energy infrastructure was postponed by five days subject to success of ongoing meetings. Iranian media meanwhile stated that no meetings were ongoing at all.
Today we are scratching our heads trying to figure out what yesterday was all about.
Friends and family playing the market? Was it just Trump and his friends and family who were playing with oil and equity markets with $580m and $1.46bn in bets being placed by someone in oil and equity markets just 15 minutes before Trump’s announcement?
Was Trump pulling a TACO as he reached his political and economic pain point: Brent at $112/b, US Gas at $4/gal, SPX below 200dma and US 10yr above 4.4%?
Different Iranian factions with Trump talking with one of them? Are there real negotiations going on but with the US talking to one faction in Iran while another, the hardliners, are not involved and are denying any such negotiations going on?
Extending the ultimatum to attack and invade Kharg island next weekend? Or, is the five day delay of the deadline a tactical decision to allow US amphibious assault ships and marines to arrive in the Gulf in the upcoming weekend while US and Israeli continues to degrade Iranian military targets till then. And then next weekend a move by the US/Israel to attack and conquer for example the Kharg island?
We do not really know which it is or maybe a combination of these.
We did get some kind of TACO ydy. But markets have been waiting for some kind of TACO to happen and yesterday we got some kind of TACO. And Brent crude is now trading at $101.5/b as a result rather than at $112-114/b as it did no the high yesterday.
But what really matters in our view is the political situation on the ground in Iran. Will hardliners continue to hold power or will a more pragmatic faction gain power?
If the hardliners remain in power then oil pain should extend all the way to US midterm elections. The hardliners were apparently still in charge as of last week. Iran immediately retaliated and damaged LNG infrastructure in Qatar after Israel hit Iranian South Pars. The SoH was still closed and all messages coming out of Iran indicated defiance. Hardliners continues in power has a huge consequence for oil prices going forward. The regime has played its ’oil-weapon’ (closing or chocking the Strait of Hormuz). It is using it to achieve political goals. Deterrence: it needs to be so politically and economically expensive to attack Iran that it won’t happen again in the future. Or at least that the US/Israel thinks 10-times over before they attack again. The highest Brent crude oil closing price since the start of the war is $112.19/b last Friday. In comparison the 20-year inflation adjusted Brent price is $103/b. So Brent crude last Friday at $112.19/b isn’t a shockingly high price. And it is still far below the nominal high of $148/b from 2008 which is $220/b if inflation adjusted. So once in a lifetime Iran activates its most powerful weapon. The oil weapon. It needs to show the power of this weapon and it needs to reap political gains. Getting Brent to $112/b and intraday high of $119.5/b (9 March) isn’t a display of the power of that weapon. And it is not a deterrence against future attacks.
So if the hardliners remain in power in Iran, then the SoH will likely remain chocked all the way to US midterm elections and Brent crude will at a minimum go above the historical nominal high of $148/b from 2008.
Thus the outlook for the oil price for the rest of the year doesn’t depend all that much of whether Trump pulls a TACO or not. Stops bombing or not. It depends more on who is in charge in Iran. If it is the hardliners, then deterrence against future attacks via chocking of the SoH and high oil prices is the likely line of action. It is impacting the world but the Iranian ’oil-weapon’ is directed towards the US president and the the US midterm elections.
If a pragmatic faction gets to power in Iran, then a very prosperous future is possible. However, if power is shifting towards a more pragmatic faction in Iran then a completely different direction could evolve. Such a faction could possibly be open for cooperation with the US and the GCC and possibly put its issues versus Israel aside. Then the prosperity we have seen evolving in Dubai could be a possible future also for Iran.
So far it looks like the hardliners are fully in charge. As far as we can see, the hardliners are still fully in control in Iran. That points towards continued chocking of the SoH and oil prices ticking higher as global inventories (the oil market buffers) are drawn lower. And not just for a few more weeks, but possibly all the way to the US midterm elections.


Solkraften pressar elpriserna dagtid

Michel Gubel ger sin syn på oljemarknaden

Svag vårflod dubblar elpriserna
Brent crude up USD 9/bl on the week… ”deal around the corner” narrative fades
Market Still Betting on Timely Resolution, But Each Day Raises Shortage Risk

Christian Kopfer om läget för oljan
Market Still Betting on Timely Resolution, But Each Day Raises Shortage Risk
Brent crude up USD 9/bl on the week… ”deal around the corner” narrative fades
Michel Gubel ger sin syn på oljemarknaden
Solkraften pressar elpriserna dagtid
-
 Nyheter4 veckor sedan
Christian Kopfer om läget för oljan
-
Analys3 veckor sedan
Market Still Betting on Timely Resolution, But Each Day Raises Shortage Risk
-
Analys3 veckor sedan
Brent crude up USD 9/bl on the week… ”deal around the corner” narrative fades
-
 Nyheter2 veckor sedan
Michel Gubel ger sin syn på oljemarknaden
-
 Nyheter2 veckor sedan
Solkraften pressar elpriserna dagtid
-
Nyheter2 veckor sedan
Svag vårflod dubblar elpriserna