

Analys
SEB – Råvarukommentarer, 18 februari 2013

Rekommendationer
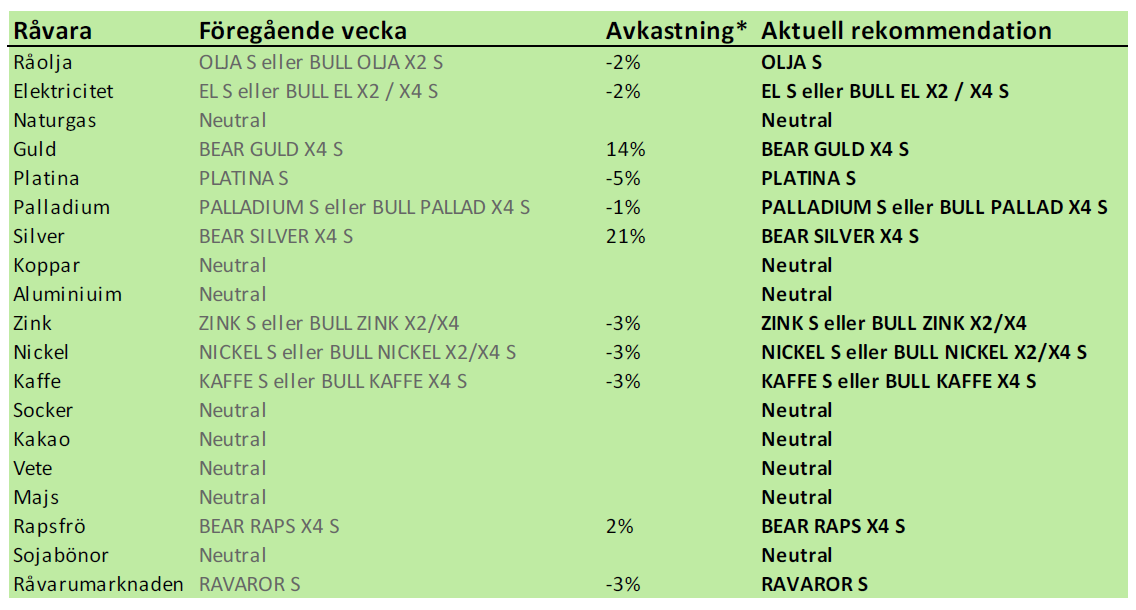
Inledning
SEB:s råvaruindex var oförändrat i veckan som gick, men eftersom kronan stärktes föll RAVAROR S, eftersom den håller “kassan” i dollar och euro, råvarornas noteringsvalutor. Vi återupprepar vår rekommendation att köpa PLATINA S. Platinapriset hängde i veckan på när guld och silver föll.
Samtidigt kom dock tre rätt så betydande nyheter som pekar på högre, inte lägre priser. Vi tror att det lägre priset den här veckan – i kombination med fundamentalt sett mer “bullish news” erbjuder ett köptillfälle i platina.
Samtidigt är vi glada för att vi låg köpta BEAR GULD X4 S, som steg med 14% i veckan som gick. Och BEAR SILVER X4 S, som steg med 21%. Vi ligger kvar i dessa. Vi rekommenderar fortsatt köp av BEAR – certifikat på guld och silver.
Vi tror att prisrekylen på Nasdaqs elbörs (fd Nordpool) gör det möjligt att komma in på den långa sidan igen, t ex i EL S.
Råvaruindex
I diagrammet nedan ser vi SEB:s råvaruindex, som följer avkastningen på en diversifierad korg av råvaruterminer. Sammansättningen är gjord med tanke på en nordisk eller europisk placerare. Indexet innehåller t ex terminer på nordisk och tysk el, men ingen amerikansk naturgas. Indexet har slagit DJ UBS index med 8 procentenheter per år, vilket är statistiskt signifikant (p=0.11), förutom att vara tämligen ekonomiskt signifikant.
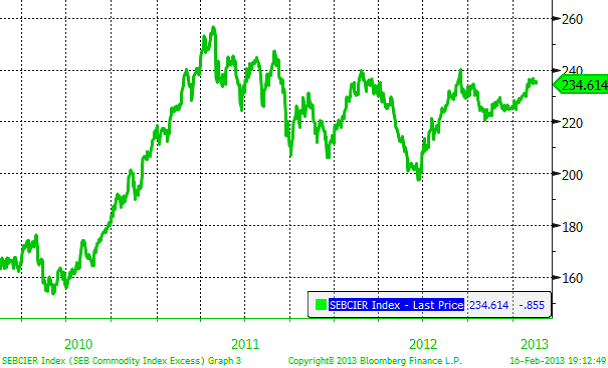
Den som vill investera i indexet och den investeringsstrategi som ligger bakom kan läsa mer om certifikatet RAVAROR S.
Indexet var oförändrat från förra veckan, men eftersom dollar och euro sjönk mot svenska kronor sjönk RAVAROR S med 3%.
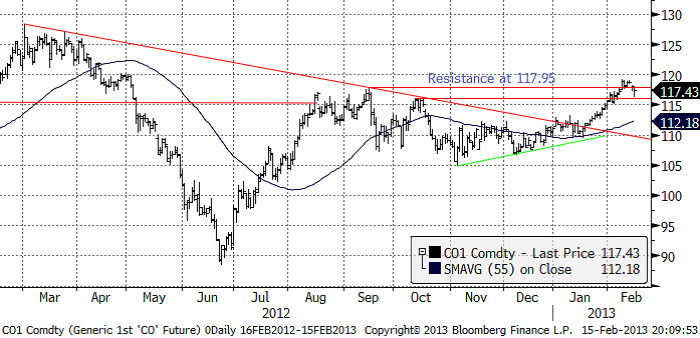
Råolja – Brent
Oljepriset gick över motståndet på 117.95 dollar, men föll sedan tillbaka till 117.43 dollar per fat. (Det är 4.70 kr per liter. Kan vara bra att komma ihåg om man tycker att 117.95 dollar är ett högt pris på råolja. En liter bensin kostar ungefär lika mycket, eftersom destillationen inte är en speciellt dyr process). Priset föll kraftigt i fredags, men höll sig över ett tekniskt stöd precis under. Vi tycker att priset rusat iväg lite för fort sedan januari och går över till neutral rekommendation, för tillfället. Vi rekommenderar alltså inte köp av BULL OLJA X2/X4 S, men tycker att man kan ligga kvar i OLJA S.
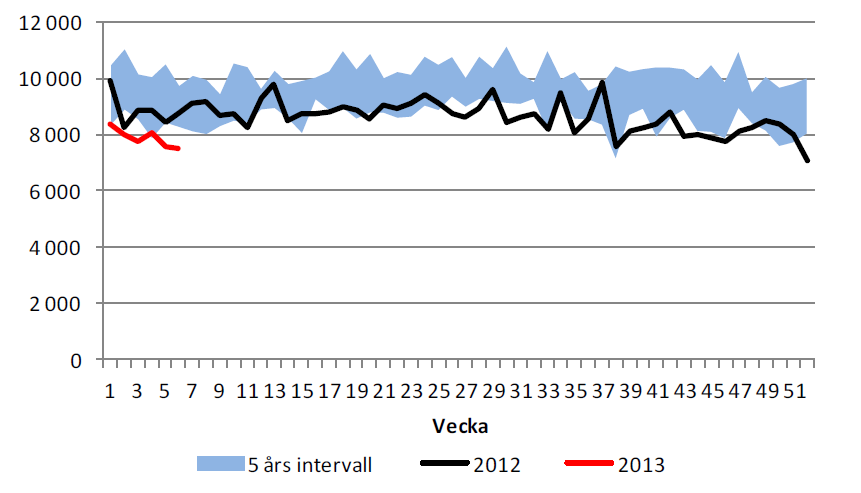
Lagren och lagerförändringarna i USA per den 25 januari ser vi nedan, enligt Department of Energy och American Petroleum Institute.
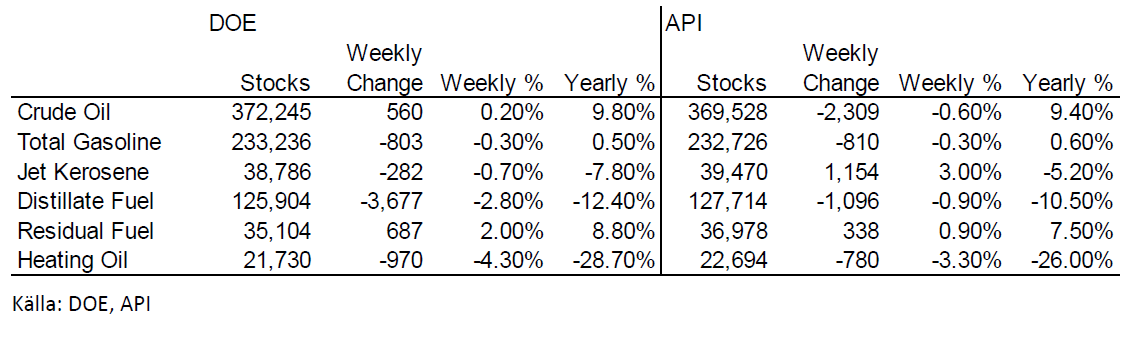
Det var inga stora förändringar. Destillat och eldningsolja har betydligt lägre lager än förra året. Råoljelagren fortsätter att byggas på och produkternas lager minskar.
Nedan ser vi amerikanska råoljelager enligt DOE i tusen fat. Den svarta kurvan är 2012 års lagernivåer vecka för vecka och den lilla röda linjen är 2013 års nivå. Vi ser att lagernivåerna fortsätter att vara högre än de varit sedan 2007 för den här tiden på året.
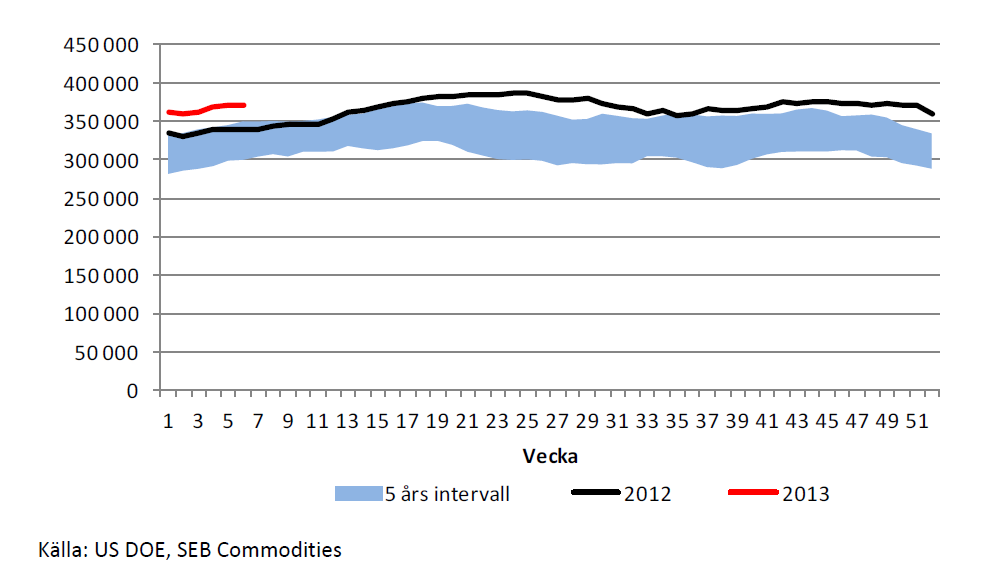
Lagren ökar samtidigt som vi ser att importen av råolja till USA fortsätter att minska.
Sammanfattningsvis: Vi går över till neutral rekommendation från den tidigare köprekommendationen. Detta innebär att vi rekommenderar köp av OLJA S, men inte av BULL OLJA S. Anledningen till denna skillnad och att vi rekommenderar köp av OLJA S är för att rabatten på terminerna innebär en stadig intäkt om ca 6% per år + ränta på kapitalet.
Elektricitet
Elpriset steg inledningsvis under veckan, men föll och stängde på dagslägsta i fredags. Det fanns uppenbarligen starka säljintressen på 37 euro per MWh. Det förefaller som om de gav köparna mer än vad de orkade med. Gissningsvis öppnar marknaden ner på måndag igen. Trenden är uppåtriktad och stöd finns på 35 euro, där man kan försöka komma in på den köpta sidan. Vi tror att motståndet på 37 euro kommer att testas igen.
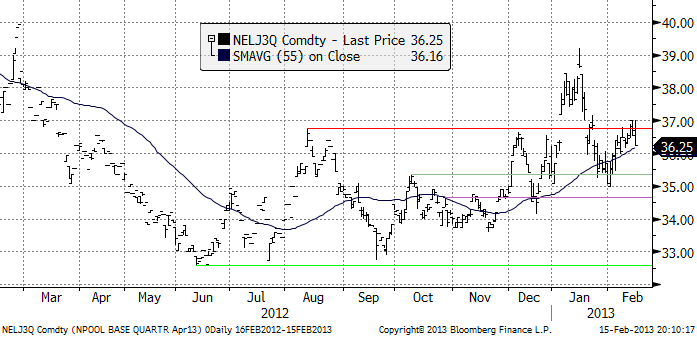
Prisfallet på tysk el (den svarta linjen nedan) har upphört, i alla fall för tillfället. Detta ger stöd för det nordiska elpriset, som gynnas av underskottet i den hydrologiska balansen.
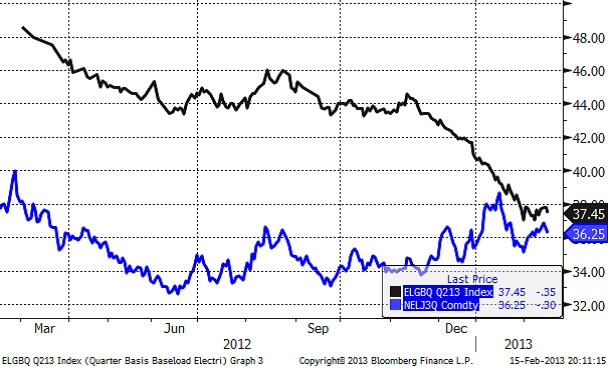
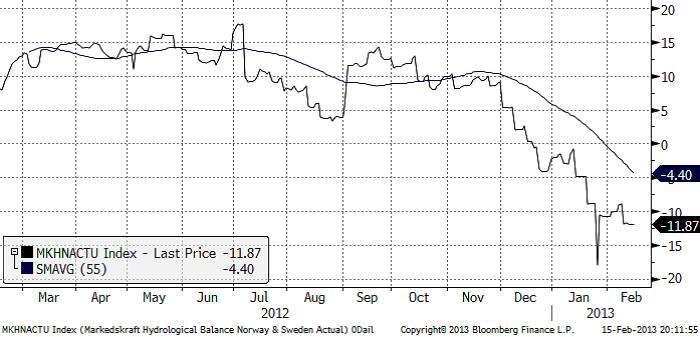
Den hydrologiska balansen för NordPools börsområde sjönk något och ligger enligt Markedskraft på -11.87 TWh.
Sammanfattningsvis. Efter en initial prisnedgång i veckan som kommer, tror vi det finns utsikter till ett nytt försök att gå igenom 37 euro per MWh och rekommenderar köp av EL S eller BULL EL X2/X4 S.
Naturgas
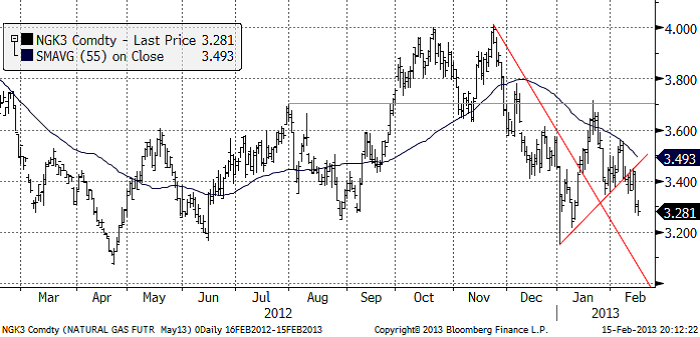
Naturgasterminen på NYMEX (maj 2013) bröt stödet vid 3.40 dollar per MMBtu (miljoner British Thermal Units; en BTU är den energi som höjer temperaturen i en halvliter vatten med en grad). Nästa stöd finns nu på 3.20. Vi fortsätter med neutral rekommendation. Vid 3.20 kan man försöka köpa NATGAS S.
Guld och Silver
Guldpriset bröt först stödet vid 1670 dollar per ozt och sedan hände allt på en gång i fredags. Priset föll rakt genom stödet vid 1625, ända ner till 1600. Den nu aktuella prisnivån har en del stöd. Vi ser att det skedde en hel del handel på den här nivån i maj, juni och juli förra sommaren. Så det är möjligt att prisfallet hejdar sig mellan 1600 och 1550.
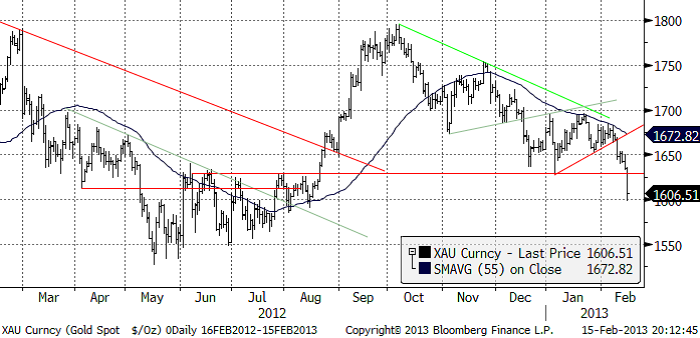
Vad var det som hände i fredags, som fick den här effekten? Det kom två nyheter. Dels nyheten att storspekulanten
George Soros sålt av en stor post guld (förmodligen gjort på högre prisnivåer) och dels mailade World Gold Council ut sin senaste kvartalsrapport. Den visade att efterfrågan i Kina och Indien var upp ca 30%, men att smyckesefterfrågan i Kina inte ökat alls under hösten.
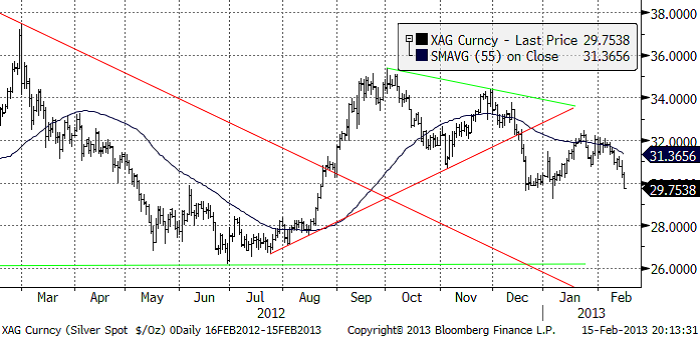
Nedan ser vi kursdiagrammet för silver i dollar per troy ounce. Situationen är snarlik den för guld. Silverpriset befinner sig precis på en nivå där det bör finnas tekniskt stöd, men övertygelsen i de senaste dagarnas kursfall gör att priset kanske faller rakt ner till nästa stöd vid 28 dollar.
Platina & Palladium
I veckan har det kommit nyheter om platinamarknaden som indikerar högre priser. Dessa nyheter kan sammanfattas med namnen Implats, Zuma och Zimbabwe.
Implats
Impala Platinum Holdings publicerade sin bokslutsrapport i veckan som gick. Bolaget är ett av de ledande gruvföretagen i Sydafrika och världens näst största producent platina. Rapporten ger stöd för priset på platina. Bolaget rapporterade att produktionen av platina sjönk under det andra halvåret förra året. De rapporterade också att kostnaden per troy uns steg med 42% till 1815 dollar! Notera att detta är högre än priset på platina idag.
De skrev också att vilda strejker vid anläggningarna fortsätter att förekomma. Strejkerna som i höstas bidrog till hausse i metallen (men knappast i gruvföretagens aktiekurser), fortsätter alltså.
Zuma
Sydafrikas president Jacob Zuma gav i ett tal i fredags ytterligare skäl för att tro på högre pris på platina. Han sade att Sydafrika ska se över minerallagstiftningen och den skatt som gruvbolagen får betala för sin produktion. Zuma menade att detta är nödvändigt för att minska fattigdomen och ojämlikheterna hos befolkningen. Man påminns om ANC:s kommunistiska arv. Finansministern Pravin Gordhan kommer att inleda en undersökning av beskattningen senare i år för att se till att staten får in tillräckligt med skatteinkomster.
Zimbabwe
Resursnationalismen tog ett steg framåt även i Zimbabwe. I förra veckan sade landets regering att man ska ta tillbaka land med platinafyndigheter från Zimplats och sälja rättigheterna till nya investerare. Gruvministern sade också att all malm måste raffineras inom landet inom två år. Frågan är vilka modiga och spendersamma investerare som ska känna sig lockade av det?
Summa summarum, utvecklingen i Sydafrika, som står för 75% av platinaproduktionen i världen indikerar högre priser på platina. Utvecklingen i Zimbabwe samma sak. Det är svårt att tänka sig att utbudet ska öka och sätta press på priset, när gruvorna går med förlust och kostnadsnivån har en ökningstakt på 45% om året.
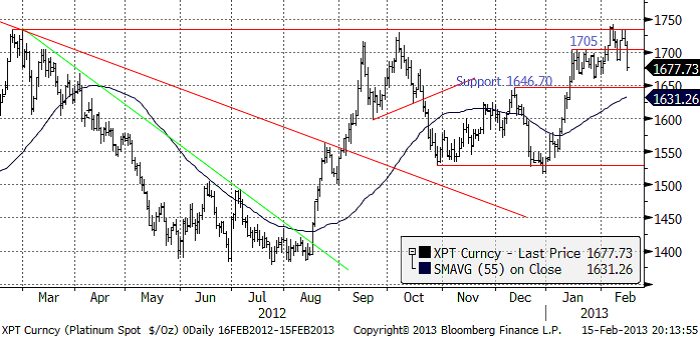
Platinapriset följde guldpriset i veckan som gick, dvs nedåt. I början av veckan bröt platina motståndet på 1705 och gick upp till huvudmotståndet strax under 1750. På den nivån ser vi att det fanns tillräckligt mycket säljare för hejda uppgångarna i februari och mars förra året. Det är uppenbarligen en viktig nivå. Nu har priset fallit så mycket att det ser ut som om priset ska ner till 1650 och hämta kraft. Där skulle man kunna försöka komma in och köpa t ex PLATINA S. Den fundamentala utbuds- och efterfrågesituation för platina skiljer sig väsentligt från guld och silver.
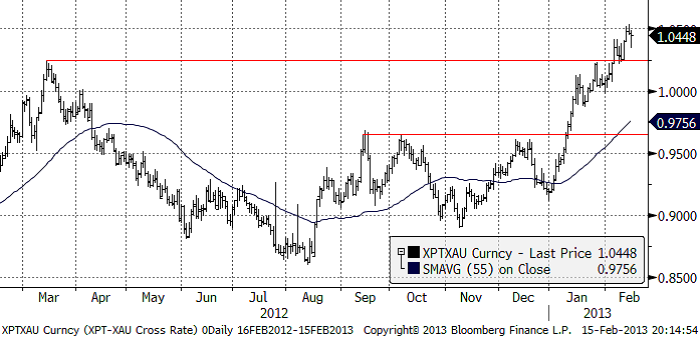
Nedan ser vi priset på platina i termer av guld, eller ”växelkursen” mellan XPT och XAU, valutakoderna för de två ädelmetallerna. Platina har fortsatt att vinna på guld.
Palladium rörde sig ”sideledes” under veckan som gick. Marknaden skulle behöva hämta andan efter den uppgång som varit från 600 dollar till över 750 dollar på bara några månader. Vi skulle gissa att marknaden den närmaste tiden rör sig sidledes och troligen även med en liten rekyl nedåt om för många vill ta hem vinster samtidigt.
Vi är alltså betydligt mer ”bullish” platina än palladium den här måndagsmorgonen.
Basmetaller
Med Kina stängt blir aktiviteten därefter. Omsättningen har varit klart lägre under veckan och prisrörelserna modesta. Metallerna visar överlag marginella nedgångar, mellan 0,5 – 1 % så här långt (fredag eftermiddag). Undantaget är aluminium som trendat uppåt under veckan, understödd av köp från aktörer som köper tillbaka korta positioner.
Koppar
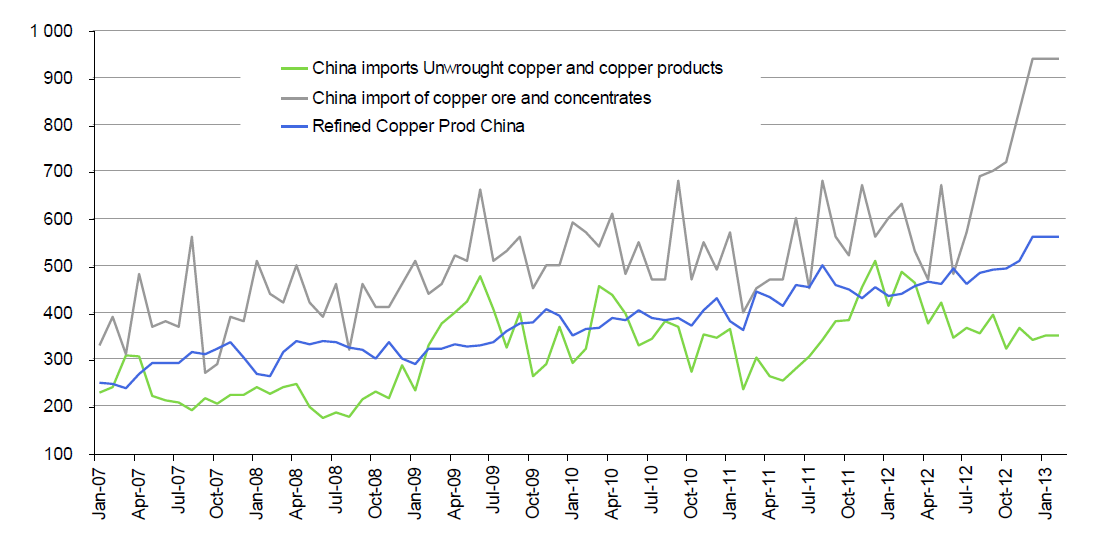
Vi skrev i förra veckans brev om Kinas importsiffror som kom in på 350 958 ton, + 2,9 % i januari jämfört med december. Jämfört med januari förra året föll importen med 15,2 % (se månadsstatistiken nedan). Trenden är fallande under året. Möjligtvis anas en tendens till ”urbottning”. I grafen nedan har vi lagt in importen kopparmalm, vilket nyanserar analysen. Den sjunkande importen av ”obehandlad” koppar har kompenserats av en ökad import av malm, och som vi ser i grafen behålls en oförändrad ganska hög inhemsk produktion. Internt i Kina kompenseras således den minskande importen av inhemsk produktion. Den positiva tolkningen av detta är att Kina kommer att behöva koppar (trots minskad import). Den negativa tolkningen är att den ökade malmimporten är ytterligare ett tecken på ökat utbud av kopparmalm.
Kinas kopparimport och produktion (1000-tals ton)
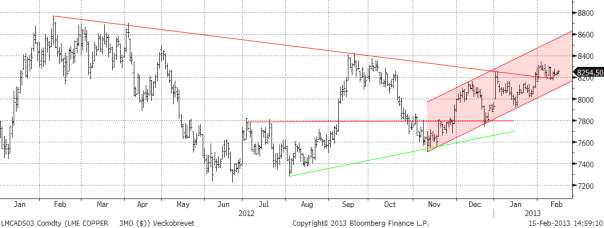
Tekniskt sett ser det fortfarande relativt positivt ut. Priset får stöd av brottet ur den stora ”triangelformationen”. Om priset lyckas ta sig över toppen för 3 veckor sen kring $8350, öppnas det upp för en uppgång i trendkanalen upp mot nivåer kring $8600.
Som vi skrivit tidigare tyder mycket på ökat utbud för koppar, vilket ökar risken för en lite trögare marknad. Vi ser inte den stora potentialen på koppar på uppsidan just nu. Vi rekommenderar därför en fortsatt neutral position i koppar.
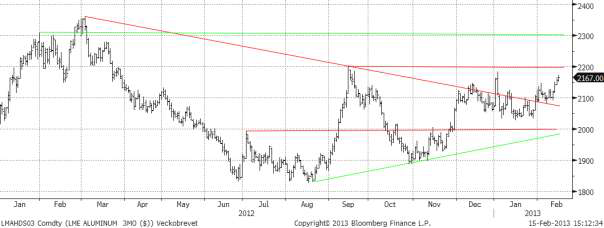
Aluminium
Tekniskt sett liknar bilden den för koppar. ”Utbrottspunkten” tangerades exakt. I skrivandes stund är vi igenom $2150. Om vi får en veckostängning över nivån talar det för ytterligare uppgång. Som vi tidigare skrivit begränsar det överhängande lagret möjligheterna för stora uppgångar, men $2300 är definitivt inom räckhåll.
Med den fundamentala situationen i bakhuvet (stora överskott), rekommenderas fortsättningsvis en neutral position i aluminium.
Zink
Förra veckans stängning fick inte riktigt den följdrörelse som vi hade förväntat oss. ”Den sista utposten” som motsvaras av toppen från i början av förra året, kring $2220 blev för svår att forcera. Många aktörer valde att ta hem vinst och priset föll tillbaka.
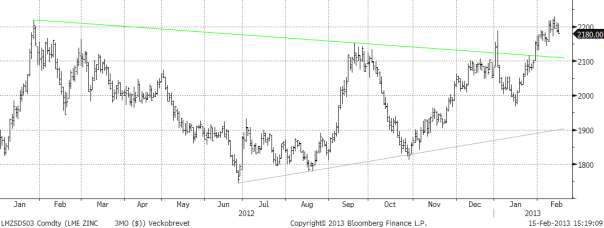
Vi rekommenderar köp av ZINK S eller BULL ZINK X2 / X4 S för den som vill ta mer risk. Efter de senaste veckornas kraftiga uppgång finns fortfarande risk för en rekyl. För nya köp bör man avvakta en eventuell rekyl ned mot intervallet $2000-$2100. Vi skrev i förra veckan: ”För den som köpt bör man avvakta veckans inledning för att se om marknaden orkar igenom toppen från januari 2011 på $2020”. Som vi sett så gjorde den inte det. För nya köp bör man således fortfarande avvakta. På lite längre sikt (1-2 månaders sikt) är potentialen stor med målet $2400 på 1-2 månaders sikt.
Nickel
Rekylen blev relativt kraftig för nickel, med ett fall från $18760 ned till $18150 som lägst. Priset har återhämtat sig, men inte riktigt som övriga metaller. Marknaden är fortsatt tveksam till den fundamentala situationen. Kommentarer från den fysiska marknaden indikerar att ”det finns gott om nickel”, samtidigt som rapporter gör gällande att exporten av nickelmalm från Indonesien till Kina ökar igen, vilket riskerar att öka utbudet av s.k. Nickel Pig Iron i Kina (vilket i sin tur minskar efterfrågan på nickelbärande skrot och primärnickel).
Som vi tidigare skrivit kan dock nickel erfarenhetsmässigt ofta överraska. Den tekniska bilden är väldigt tydlig med nästa motståndsnivå vid $19000 och därefter $22000. För den som följde rådet att ta hem vinst för två veckor sedan, kan det vara värt att gå in igen kring ”utbrottspunkten” $18000 med ett nytt köp.
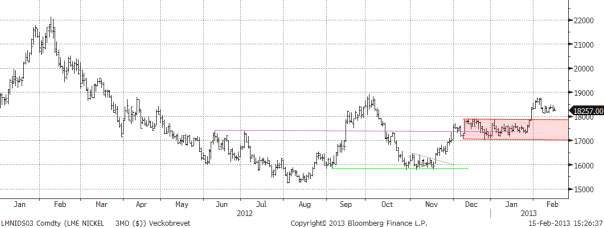
Vi rekommenderar köp av NICKEL S eller BULL NICKEL X2 / X4 S för den som vill ta mer risk. Efter de senaste veckornas kraftiga uppgång finns risk för en rekyl. För nya köp bör man avvakta en eventuell rekyl ned mot ”utbrottsnivån” $18000. För den som köpt tidigare bör man kortsiktigt ta hem vinst vid motståndsnivån $19000. På lite längre sikt är potentialen större med målet $22 000 på 1-2 månaders sikt.
Kaffe
Kaffepriset (maj 2013) nådde en ny kontraktslägsta i veckan. Tekniskt är trenden nedåtriktad, då det inte blev något trendbrott (över 160 cent i majkontraktet) och stödet på 145 cent inte höll. Eftersom det är en så jämn siffra utgör 140 cent nu ett stöd i sig självt. Vi ser kursutvecklingen det senaste året i diagrammet nedan.
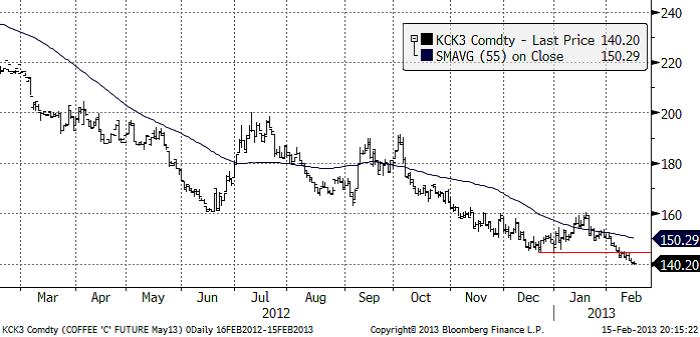
Vi fortsätter att dela den uppfattningen och tycker att man ska handla kaffe från den ”långa” sidan. Vi fortsätter därför att generellt sett rekommendera köp av KAFFE S.
Socker
Sockerpriset (mars 2013) fortsatte falla i veckan som gick. Det gör socker till den jordbruksprodukt som utvecklats sämst hittills i år. Marknaden väntar sig att 2013 ska bli det tredje året med utbud större än efterfrågan, trots fallande pris.
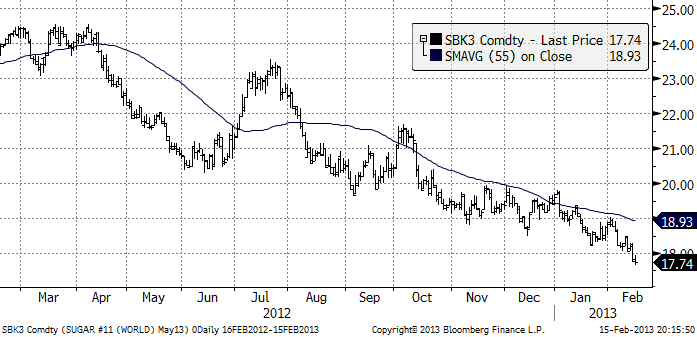
Brasiliens regering vill öka användningen av etanol som drivmedel i landet. Många bilar i landet går att köra på både bensin och etanol, men priserna har varit sådana att folk har valt att tanka med bensin. Den ökade fokuseringen på etanol har fått priset att stiga, som vi ser i nedanstående diagram, som visar etanolpriset i Sao Paulo i USD per liter. Den blå linjen är priset på socker i samma delstat.
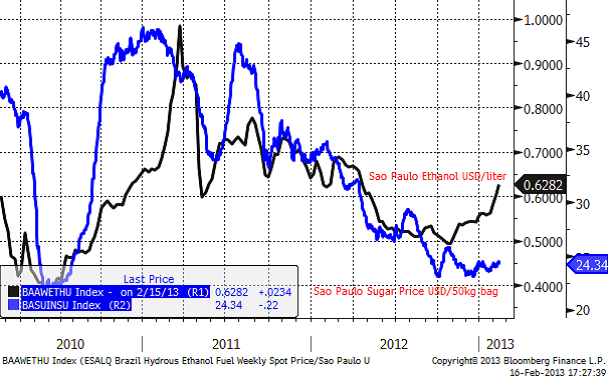
Vi ser att de två linjerna tenderar att hänga ihop och en uppgång i priset på etanol kan signalera att priset på socker också kommer att stiga framöver.
Finns tecken på att priset på socker är nära botten, men än så länge är pristrenden så stark att vi väljer att behålla neutral rekommendation ytterligare en vecka.
[box]SEB Veckobrev Veckans råvarukommentar är producerat av SEB Merchant Banking och publiceras i samarbete och med tillstånd på Råvarumarknaden.se[/box]
Disclaimer
The information in this document has been compiled by SEB Merchant Banking, a division within Skandinaviska Enskilda Banken AB (publ) (“SEB”).
Opinions contained in this report represent the bank’s present opinion only and are subject to change without notice. All information contained in this report has been compiled in good faith from sources believed to be reliable. However, no representation or warranty, expressed or implied, is made with respect to the completeness or accuracy of its contents and the information is not to be relied upon as authoritative. Anyone considering taking actions based upon the content of this document is urged to base his or her investment decisions upon such investigations as he or she deems necessary. This document is being provided as information only, and no specific actions are being solicited as a result of it; to the extent permitted by law, no liability whatsoever is accepted for any direct or consequential loss arising from use of this document or its contents.
About SEB
SEB is a public company incorporated in Stockholm, Sweden, with limited liability. It is a participant at major Nordic and other European Regulated Markets and Multilateral Trading Facilities (as well as some non-European equivalent markets) for trading in financial instruments, such as markets operated by NASDAQ OMX, NYSE Euronext, London Stock Exchange, Deutsche Börse, Swiss Exchanges, Turquoise and Chi-X. SEB is authorized and regulated by Finansinspektionen in Sweden; it is authorized and subject to limited regulation by the Financial Services Authority for the conduct of designated investment business in the UK, and is subject to the provisions of relevant regulators in all other jurisdictions where SEB conducts operations. SEB Merchant Banking. All rights reserved.


The latest weekly report from the US DOE showed a substantial drawdown across key petroleum categories, adding more upside potential to the fundamental picture.

Commercial crude inventories (excl. SPR) fell by 5.8 million barrels, bringing total inventories down to 415.1 million barrels. Now sitting 11% below the five-year seasonal norm and placed in the lowest 2015-2022 range (see picture below).
Product inventories also tightened further last week. Gasoline inventories declined by 2.1 million barrels, with reductions seen in both finished gasoline and blending components. Current gasoline levels are about 3% below the five-year average for this time of year.
Among products, the most notable move came in diesel, where inventories dropped by almost 4.1 million barrels, deepening the deficit to around 20% below seasonal norms – continuing to underscore the persistent supply tightness in diesel markets.
The only area of inventory growth was in propane/propylene, which posted a significant 5.1-million-barrel build and now stands 9% above the five-year average.
Total commercial petroleum inventories (crude plus refined products) declined by 4.2 million barrels on the week, reinforcing the overall tightening of US crude and products.


A classic case of “buy the rumor, sell the news” played out in oil markets, as Brent crude has dropped sharply – down nearly USD 10 per barrel since yesterday evening – following Iran’s retaliatory strike on a U.S. air base in Qatar. The immediate reaction was: “That was it?” The strike followed a carefully calibrated, non-escalatory playbook, avoiding direct threats to energy infrastructure or disruption of shipping through the Strait of Hormuz – thus calming worst-case fears.
After Monday morning’s sharp spike to USD 81.4 per barrel, triggered by the U.S. bombing of Iranian nuclear facilities, oil prices drifted sideways in anticipation of a potential Iranian response. That response came with advance warning and caused limited physical damage. Early this morning, both the U.S. President and Iranian state media announced a ceasefire, effectively placing a lid on the immediate conflict risk – at least for now.
As a result, Brent crude has now fallen by a total of USD 12 from Monday’s peak, currently trading around USD 69 per barrel.
Looking beyond geopolitics, the market will now shift its focus to the upcoming OPEC+ meeting in early July. Saudi Arabia’s decision to increase output earlier this year – despite falling prices – has drawn renewed attention considering recent developments. Some suggest this was a response to U.S. pressure to offset potential Iranian supply losses.
However, consensus is that the move was driven more by internal OPEC+ dynamics. After years of curbing production to support prices, Riyadh had grown frustrated with quota-busting by several members (notably Kazakhstan). With Saudi Arabia cutting up to 2 million barrels per day – roughly 2% of global supply – returns were diminishing, and the risk of losing market share was rising. The production increase is widely seen as an effort to reassert leadership and restore discipline within the group.
That said, the FT recently stated that, the Saudis remain wary of past missteps. In 2018, Riyadh ramped up output at Trump’s request ahead of Iran sanctions, only to see prices collapse when the U.S. granted broad waivers – triggering oversupply. Officials have reportedly made it clear they don’t intend to repeat that mistake.
The recent visit by President Trump to Saudi Arabia, which included agreements on AI, defense, and nuclear cooperation, suggests a broader strategic alignment. This has fueled speculation about a quiet “pump-for-politics” deal behind recent production moves.
Looking ahead, oil prices have now retraced the entire rally sparked by the June 13 Israel–Iran escalation. This retreat provides more political and policy space for both the U.S. and Saudi Arabia. Specifically, it makes it easier for Riyadh to scale back its three recent production hikes of 411,000 barrels each, potentially returning to more moderate increases of 137,000 barrels for August and September.
In short: with no major loss of Iranian supply to the market, OPEC+ – led by Saudi Arabia – no longer needs to compensate for a disruption that hasn’t materialized, especially not to please the U.S. at the cost of its own market strategy. As the Saudis themselves have signaled, they are unlikely to repeat previous mistakes.
Conclusion: With Brent now in the high USD 60s, buying oil looks fundamentally justified. The geopolitical premium has deflated, but tensions between Israel and Iran remain unresolved – and the risk of missteps and renewed escalation still lingers. In fact, even this morning, reports have emerged of renewed missile fire despite the declared “truce.” The path forward may be calmer – but it is far from stable.
Analys
A muted price reaction. Market looks relaxed, but it is still on edge waiting for what Iran will do
Brent crossed the 80-line this morning but quickly fell back assigning limited probability for Iran choosing to close the Strait of Hormuz. Brent traded in a range of USD 70.56 – 79.04/b last week as the market fluctuated between ”Iran wants a deal” and ”US is about to attack Iran”. At the end of the week though, Donald Trump managed to convince markets (and probably also Iran) that he would make a decision within two weeks. I.e. no imminent attack. Previously when when he has talked about ”making a decision within two weeks” he has often ended up doing nothing in the end. The oil market relaxed as a result and the week ended at USD 77.01/b which is just USD 6/b above the year to date average of USD 71/b.

Brent jumped to USD 81.4/b this morning, the highest since mid-January, but then quickly fell back to a current price of USD 78.2/b which is only up 1.5% versus the close on Friday. As such the market is pricing a fairly low probability that Iran will actually close the Strait of Hormuz. Probably because it will hurt Iranian oil exports as well as the global oil market.
It was however all smoke and mirrors. Deception. The US attacked Iran on Saturday. The attack involved 125 warplanes, submarines and surface warships and 14 bunker buster bombs were dropped on Iranian nuclear sites including Fordow, Natanz and Isfahan. In response the Iranian Parliament voted in support of closing the Strait of Hormuz where some 17 mb of crude and products is transported to the global market every day plus significant volumes of LNG. This is however merely an advise to the Supreme leader Ayatollah Ali Khamenei and the Supreme National Security Council which sits with the final and actual decision.
No supply of oil is lost yet. It is about the risk of Iran closing the Strait of Hormuz or not. So far not a single drop of oil supply has been lost to the global market. The price at the moment is all about the assessed risk of loss of supply. Will Iran choose to choke of the Strait of Hormuz or not? That is the big question. It would be painful for US consumers, for Donald Trump’s voter base, for the global economy but also for Iran and its population which relies on oil exports and income from selling oil out of that Strait as well. As such it is not a no-brainer choice for Iran to close the Strait for oil exports. And looking at the il price this morning it is clear that the oil market doesn’t assign a very high probability of it happening. It is however probably well within the capability of Iran to close the Strait off with rockets, mines, air-drones and possibly sea-drones. Just look at how Ukraine has been able to control and damage the Russian Black Sea fleet.
What to do about the highly enriched uranium which has gone missing? While the US and Israel can celebrate their destruction of Iranian nuclear facilities they are also scratching their heads over what to do with the lost Iranian nuclear material. Iran had 408 kg of highly enriched uranium (IAEA). Almost weapons grade. Enough for some 10 nuclear warheads. It seems to have been transported out of Fordow before the attack this weekend.
The market is still on edge. USD 80-something/b seems sensible while we wait. The oil market reaction to this weekend’s events is very muted so far. The market is still on edge awaiting what Iran will do. Because Iran will do something. But what and when? An oil price of 80-something seems like a sensible level until something do happen.


USA ska införa 50 procent tull på koppar

Ryska staten siktar på att konfiskera en av landets största guldproducenter

Hur säkrar vi Sveriges tillgång till kritiska metaller och mineral i en ny geopolitisk verklighet?

Lundin Mining ska bli en av de tio största kopparproducenterna i världen

Sommarvädret styr elpriset i Sverige

Uppgången i oljepriset planade ut under helgen

Mahvie Minerals växlar spår – satsar fullt ut på guld

Låga elpriser i sommar – men mellersta Sverige får en ökning

Oljan, guldet och marknadens oroande tystnad
Very relaxed at USD 75/b. Risk barometer will likely fluctuate to higher levels with Brent into the 80ies or higher coming 2-3 weeks
-
 Nyheter4 veckor sedan
Uppgången i oljepriset planade ut under helgen
-
 Nyheter3 veckor sedan
Mahvie Minerals växlar spår – satsar fullt ut på guld
-
 Nyheter4 veckor sedan
Låga elpriser i sommar – men mellersta Sverige får en ökning
-
 Nyheter2 veckor sedan
Oljan, guldet och marknadens oroande tystnad
-
Analys4 veckor sedan
Very relaxed at USD 75/b. Risk barometer will likely fluctuate to higher levels with Brent into the 80ies or higher coming 2-3 weeks
-

 Nyheter2 veckor sedan
Jonas Lindvall är tillbaka med ett nytt oljebolag, Perthro, som ska börsnoteras
-
Analys3 veckor sedan
A muted price reaction. Market looks relaxed, but it is still on edge waiting for what Iran will do
-

 Nyheter2 veckor sedan
Domstolen ger klartecken till Lappland Guldprospektering