

Analys
SHB Råvarubrevet 14 februari 2014

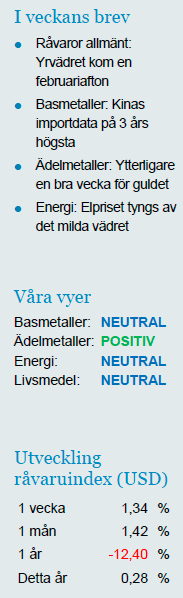
Råvaror allmänt: Yrvädret kom en februariafton
 Optimismen i början av året fick sig en törn, men har kommit tillbaka relativt snabbt. Börser i väst har återhämtat den största delen av fallet och marknaden drar slutsatsen att den senaste tidens överraskande svaghet i amerikansk data (ISM och payrolls), är tillfällig. I den mån vädret ligger bakom avmattningen i data skulle effekten kunna bestå även i februari. Vi tror dock att investerare kommer att vara betydligt mer obekväma med en sådan tolkning om både sysselsättningsökningen och ISM skulle ligga kvar på januarinivåer. Därmed blir ISM och sysselsättningsdata än mer avgörande för marknaden i samband med release i början av mars.
I samband med Yellens jungfrutal i veckan indikerade hon att betydligt mer än några låga sysselsättningssiffror krävs för att Fed skall avvika från inslagen taper-linje (vilket bekräftade en av hörnpelarna i vår vändning till köp på guld). Oron för tillväxtmarknader finns kvar, men marknaden drar slutsatsen att de länder som är har de tydligaste problemen (Argentina, Turkiet, Sydafrika) är för små finansiellt och realt för att gunga den globala båten.
Förutsättningarna för en amerikanskt ledd global återhämtning är på pappret bättre än på länge. De senaste årens stigande tillgångspriser och kraftiga ihopspreadningar talar för att den sedvanliga feedback-loopen ger en skjuts in i realekonomin. Dessutom är finanspolitiken en mindre motvind jämfört med de senaste åren. Till och med euroområdet har överraskningspotential mot bakgrund av den signifikanta lättnaden i finansiella förhållanden som har blivit följden av ECB:s backstop. I Kina är det dock slagigt, importdata för koppar, järnmalm, soja och olja kom under veckan på 3 års högsta för januari månad. Tillsammans med en motstridig uppgift om starkare än väntad export/import anar vi viss nyårsledighetseffekt i data. Data under mars kommer bli ovanligt viktig, både från Kina och USA.
Basmetaller: Kinas importdata på 3 års högsta
Basmetallerna fortsätter att handlas upp något även denna vecka. Under februari har vårt basmetallsindex stigit med 2,2 %. Importdata för januari från Kina visar på rekordhög import på bland annat koppar. Risk finns dock att den höga siffran har påverkats av kinas nyår då tullverket pappersarbetet forcerats inför nyårsledigheten. Vi väntar med andra ord att februaris import kommer in betydligt svagare.
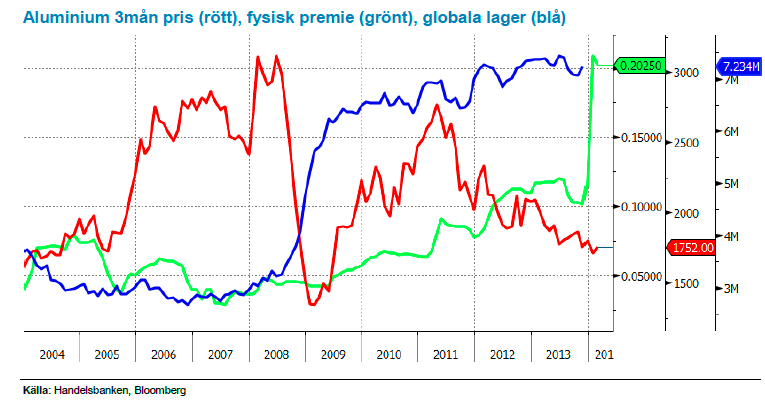
Väldigt intressant utveckling på aluminium där den fysiska premien (i grönt nedan) skjutit iväg som ett resultat av höga lager (blå kurva nedan 7.234 miljoner ton nedan) / långa köer på grund av de contangoaffärer och börsens svårigheter att lösa flaskhalsarna som vi tidigare skrivit om. Samtidigt ser vi en starkare efterfrågan, framför allt i USA, där flertalet hamnat korta efter att man dragit ned närmare 600,000 ton kapacitet (USA som producerade ca 4.9 miljoner ton 2013 står för 10% av den gloabal produktionen där Kina är ledande med 21.9 miljoner ton rapporterat och uppskattningsvis 2.4 miljoner ton orapporterat. Vi förväntar oss att aluminium stiger något under året men att det stora överskottet först börjar betas av mot slutet av 2015. Såväl Rusal, Alcoa och Rio Tinto har aviserat neddragningar vilket ger stöd för priset.
Låga prisnivåer, exportstopp av oförädlad nickelmalm från Indonesien och det faktum att 40 % av gruvorna går med förlust på dagens prisnivå. Vi tror på: LONG NICKEL H
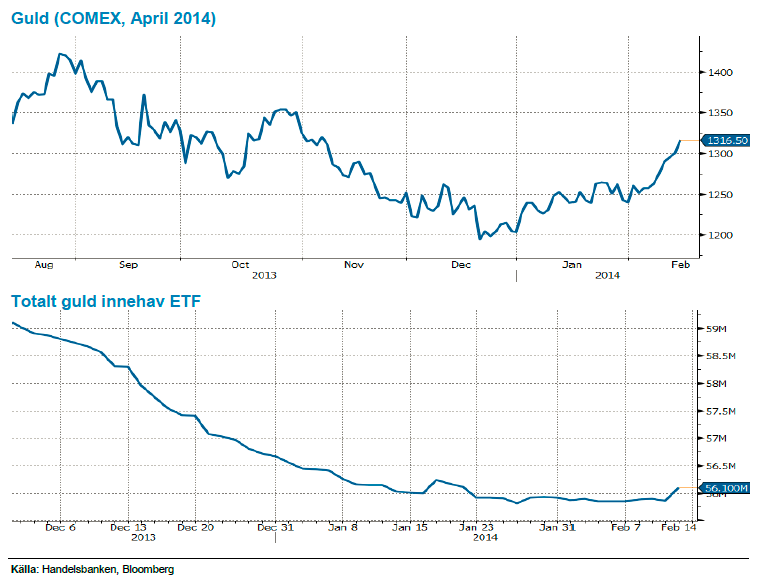
Ädelmetaller: Ytterligare en bra vecka för guldet
Vi noterar en bra vecka för samtliga ädelmetaller, guldet har t. ex. stigit med drygt 3,2 procent sedan förra veckans brev. Vi är ju sedan ett par veckor nu positiva på ädelmetaller – särskilt guldet – drivet av ett par orsaker. Vårt resonemang – som dessutom mynnade ut i ett Trading Case den 31 januari – baserades på att konsensus blivit negativa på guld (det brukar löna sig att gå emot strömmen), att Feds begynnande åtstramning inte haft negativ påverkan på guldet, och att utflödena ur guld ETF-er verkar ha avstannat. Vidare trodde vi att den uppseglande emerging markets-oron kunde leda till ”säkerhamn” flöden in i guld, och att Indien och Kina nu kan komma att köpa en något större del av den fysiska produktionen.
När vi nu tittar på dessa faktorer så noterar vi att – som nämnts i inledningen av brevet – Yellens tal i veckan, som signalerade åtstramning, inte hade negativ påverkan på guldet denna gång heller, och att flödet till ETF för första gången på väldigt länge varit starkt positivt. Därtill har en återhämtning i den globala riskaptiten – som lett till börsuppgångar världen över, och återhämtning i emerging-valutor – inte heller skapat någon nedgång i guldpriset. Vi är sammantaget fortsatt starka i vår positiva syn efter ytterligare en vecka med positiv prisutveckling.
Efter en lång tid av negativ vy för guldet har vi bytt fot och tror på stigande pris. Vi tror på: LONG GULD H
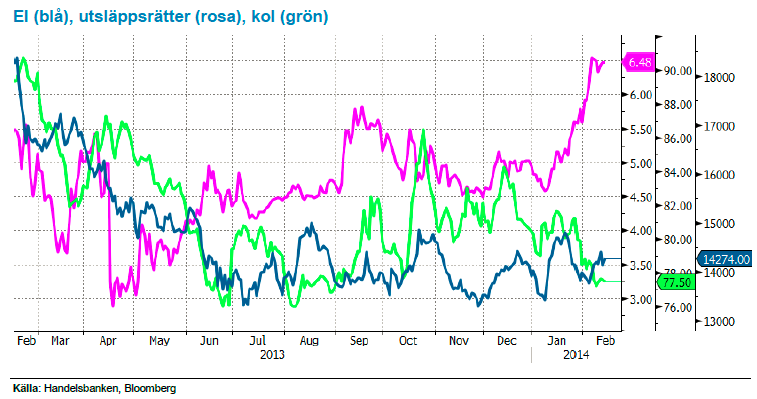
Energi: Elpriset tyngs av det milda vädret
Det räcker med att titta ut genom fönstret så förstår ni hur resten av elmarknaden resonerar, vädret är just nu den styrande faktorn och prognoserna pekar på fortsatt våta och milda scenarion vilket gör att vi närmar oss den tidigare lågpunkten för Q2-14. Vi har en svag fysisk marknad där spoten överraskar negativt mot slutet av veckan samt en nedskrivning av vattenvärdena i nivå med var brytpriset ligger. Utsläppsrätterna, rosa i graf, som stigit 30 procent under året efter mer konkreta förslag kring att minska överskottet faller tillbaka något samtidigt som kolet, i grönt nedan, handlas oförändrat. Vi behåller en neutral vy i väntan på att någon av ovan nämnda faktorer förändras.
Oljemarknaden handlas oförändrat över veckan då amerikanska arbetslöshetssiffror balanseras av vikande Libyska produktionssiffror, återigen ned till 450kbpd efter protester vid oljefälten, samt torsdagens rapport från International Energy Agency som nu är något mer positiv. IEA rapporten visar att lagren i OECD länderna föll 1.5 procent under förra kvartalet som ett resultat av en ökad efterfrågan vilket i så fall skulle innebära det största kvartalsfallet sedan 1999 för lagren. Tidigare i veckan har även OPEC och EIA reviderat upp sina prognoser för efterfrågan under 2014. På utbudssidan minskar både Irak och Saudi något (9.82 mfpd i december), säkerligen med stöd från Libyen som ändå väntas nå en produktion om 770kfpd under året. Det skulle innebära att reservkapaciteten ökar till 1.92 mfpd vilket är en förbättring från nuvarande ca 1.5 mfpd. Summa summarum, vi står fast vid vår vy att oljan kommer att vara fortsatt köpvärd ned mot 106 med en begränsad potential uppemot 111 dollar och där en positiv rullningsavkastning tack vare terminsrabatten motiverar att ligga kvar.
Vi tror att det kommer ges möjligheter till god avkastning i denna range-baserade handel där oljan är köpvärd var gång den kommer ned på lägre nivåer. Vi tror på: LONG OLJA H
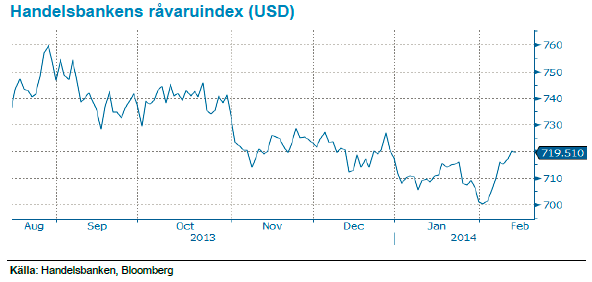
Handelsbankens råvaruindex
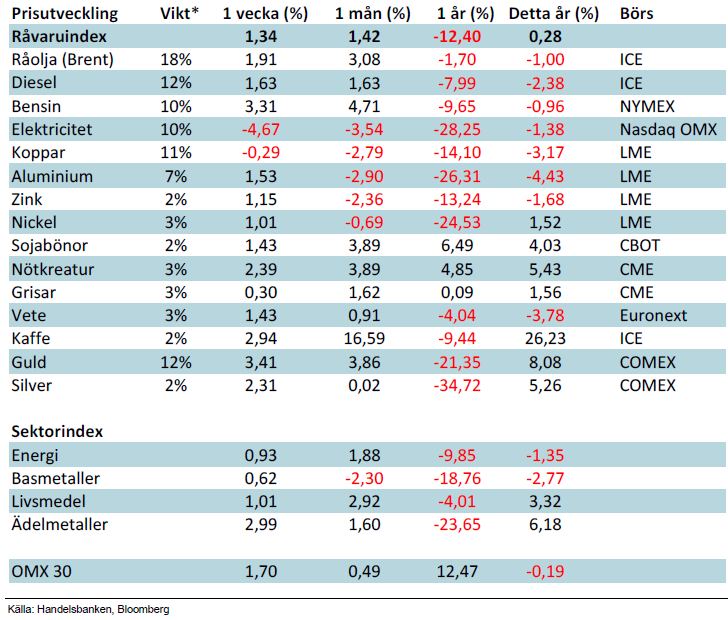
*Uppdaterade vikter från 29 november 2013
Handelsbankens råvaruindex består av de underliggande indexen för respektive råvara. Vikterna är bestämda till hälften från värdet av nordisk produktion (globala produktionen för sektorindex) och till hälften från likviditeten i terminskontrakten.
[box]SHB Råvarubrevet är producerat av Handelsbanken och publiceras i samarbete och med tillstånd på Råvarumarknaden.se[/box]
Ansvarsbegränsning
Detta material är producerat av Svenska Handelsbanken AB (publ) i fortsättningen kallad Handelsbanken. De som arbetar med innehållet är inte analytiker och materialet är inte oberoende investeringsanalys. Innehållet är uteslutande avsett för kunder i Sverige. Syftet är att ge en allmän information till Handelsbankens kunder och utgör inte ett personligt investeringsråd eller en personlig rekommendation. Informationen ska inte ensamt utgöra underlag för investeringsbeslut. Kunder bör inhämta råd från sina rådgivare och basera sina investeringsbeslut utifrån egen erfarenhet.
Informationen i materialet kan ändras och också avvika från de åsikter som uttrycks i oberoende investeringsanalyser från Handelsbanken. Informationen grundar sig på allmänt tillgänglig information och är hämtad från källor som bedöms som tillförlitliga, men riktigheten kan inte garanteras och informationen kan vara ofullständig eller nedkortad. Ingen del av förslaget får reproduceras eller distribueras till någon annan person utan att Handelsbanken dessförinnan lämnat sitt skriftliga medgivande. Handelsbanken ansvarar inte för att materialet används på ett sätt som strider mot förbudet mot vidarebefordran eller offentliggörs i strid med bankens regler.


Rebounding along with most markets. But concerns over solidity of Gaza peace may also contribute. Brent crude fell 0.8% yesterday to $61.91/b and its lowest close since May this year. This morning it is bouncing up 0.9% to $62.5/b along with a softer USD amid positive sentiment with both equities and industrial metals moving higher. Concerns that the peace in Gaza may be less solid than what one might hope for also yields some support to Brent. Bets on tech stocks are rebounding, defying fears of trade war. Money moving back into markets. Gold continues upwards its strong trend and a softer dollar helps it higher today as well.

US crude & products probably rose 5.6 mb last week (API) versus a normal seasonal decline of 2.4 mb. The US API last night partial and thus indicative data for US oil inventories. Their data indicates that US crude stocks rose 7.4 mb last week, gasoline stocks rose 3.0 mb while Distillate stocks fell 4.8 mb. Altogether an increase in commercial crude and product stocks of 5.6 mb. Commercial US crude and product stocks normally decline by 2.4 mb this time of year. So seasonally adjusted the US inventories rose 8 mb last week according to the indicative numbers by the API. That is a lot. Also, the counter seasonal trend of rising stocks versus normally declining stocks this time of year looks on a solid pace of continuation. If the API is correct then total US crude and product stocks would stand 41 mb higher than one year ago and 6 mb higher than the 2015-19 average. And if we combine this with our knowledge of a sharp increase in production and exports by OPEC(+) and a large increase in oil at sea, then the current trend in US oil inventories looks set to continue. So higher stocks and lower crude oil prices until OPEC(+) switch to cuts. Actual US oil inventory data today at 18:00 CET.
US commercial crude and product stocks rising to 1293 mb in week 41 if last nights indicative numbers from API are correct.

Crude oil soon coming to a port near you. OPEC has lifted production sharply higher this autumn. At the same time demand for oil in the Middle-East has fallen as we have moved out of summer heat and crude oil burn for power for air-conditioning. The Middle-East oil producers have thus been able to lift exports higher on both accounts. Crude oil and condensates on water has shot up by 177 mb since mid-August. This oil is now on its way to ports around the world. And when they arrive, it will likely help to lift stocks onshore higher. That is probably when we will lose the last bit of front-end backwardation the the crude oil curves. That will help to drive the front-month Brent crude oil price down to the $60/b line and revisit the high $50ies/b. Then the eyes will be all back on OPEC+ when they meet in early November and then again in early December.
Crude oil and condensates at sea have moved straight up by 177 mb since mid-August as OPEC(+) has produced more, consumed less and exported more.

When it starts to move lower it moves rather quickly. Gaza, China, IEA. Brent crude is down 2.1% today to $62/b after having traded as high as $66.58/b last Thursday and above $70/b in late September. The sell-off follows the truce/peace in Gaze, a flareup in US-China trade and yet another bearish oil outlook from the IEA.
A lasting peace in Gaze could drive crude oil at sea to onshore stocks. A lasting peace in Gaza would probably calm down the Houthis and thus allow more normal shipments of crude oil to sail through the Suez Canal, the Red Sea and out through the Bab-el-Mandeb Strait. Crude oil at sea has risen from 48 mb in April to now 91 mb versus a pre-Covid normal of about 50-60 mb. The rise to 91 mb is probably the result of crude sailing around Africa to be shot to pieces by the Houthis. If sailings were to normalize through the Suez Canal, then it could free up some 40 mb in transit at sea moving onshore into stocks.
The US-China trade conflict is of course bearish for demand if it continues.
Bearish IEA yet again. Getting closer to 2026. Credibility rises. We expect OPEC to cut end of 2025. The bearish monthly report from the IEA is what it is, but the closer we get to 2026, the more likely the IEA is of being ball-park right in its outlook. In its monthly report today the IEA estimates that the need for crude oil from OPEC in 2026 will be 25.4 mb/d versus production by the group in September of 29.1 mb/d. The group thus needs to do some serious cutting at the end of 2025 if it wants to keep the market balanced and avoid inventories from skyrocketing. Given that IEA is correct that is. We do however expect OPEC to implement cuts to avoid a large increase in inventories in Q1-26. The group will probably revert to cuts either at its early December meeting when they discuss production for January or in early January when they discuss production for February. The oil price will likely head yet lower until the group reverts to cuts.
Dubai: The Mid-East anchor dragging crude oil lower. Surplus emerging in Mid-East pricing. Crude oil prices held surprisingly strong all through the summer. A sign and a key source of that strength came from the strength in the front-end backwardation of the Dubai crude oil curve. It held out strong from mid-June and all until late September with an average 1-3mth time-spread premium of $1.8/b from mid-June to end of September. The 1-3mth time-spreads for Brent and WTI however were in steady deterioration from late June while their flat prices probably were held up by the strength coming from the Persian Gulf. Then in late September the strength in the Dubai curve suddenly collapsed. Since the start of October it has been weaker than both the Brent and the WTI curves. The Dubai 1-3mth time-spread now only stands at $0.25/b. The Middle East is now exporting more as it is producing more and also consuming less following elevated summer crude burn for power (Aircon) etc.
The only bear-element missing is a sudden and solid rise in OECD stocks. The only thing that is missing for the bear-case everyone have been waiting for is a solid, visible rise in OECD stocks in general and US oil stocks specifically. So watch out for US API indications tomorrow and official US oil inventories on Thursday.
No sign of any kind of fire-sale of oil from Saudi Arabia yet. To what we can see, Saudi Arabia is not at all struggling to sell its oil. It only lowered its Official Selling Prices (OSPs) to Asia marginally for November. A surplus market + Saudi determination to sell its oil to the market would normally lead to a sharp lowering of Saudi OSPs to Asia. Not yet at least and not for November.
The 5yr contract close to fixed at $68/b. Of importance with respect to how far down oil can/will go. When the oil market moves into a surplus then the spot price starts to trade in a large discount to the 5yr contract. Typically $10-15/b below the 5yr contract on average in bear-years (2009, 2015, 2016, 2020). But the 5yr contract is usually pulled lower as well thus making this approach a moving target. But the 5yr contract price has now been rock solidly been pegged to $68/b since 2022. And in the 2022 bull-year (Brent spot average $99/b), the 5yr contract only went to $72/b on average. If we assume that the same goes for the downside and that 2026 is a bear-year then the 5yr goes to $64/b while the spot is trading at a $10-15/b discount to that. That would imply an average spot price next year of $49-54/b. But that is if OPEC doesn’t revert to cuts and instead keeps production flowing. We think OPEC(+) will trim/cut production as needed into 2026 to prevent a huge build-up in global oil stocks and a crash in prices. But for now we are still heading lower. Into the $50ies/b.
Some rebound but not much. Brent crude rebounded 1.5% yesterday to $65.47/b. This morning it is inching 0.2% up to $65.6/b. The lowest close last week was on Thursday at $64.11/b.
The curve structure is almost as week as it was before the weekend. The rebound we now have gotten post the message from OPEC+ over the weekend is to a large degree a rebound along the curve rather than much strengthening at the front-end of the curve. That part of the curve structure is almost as weak as it was last Thursday.
We are still on a weakening path. The message from OPEC+ over the weekend was we are still on a weakening path with rising supply from the group. It is just not as rapidly weakening as was feared ahead of the weekend when a quota hike of 500 kb/d/mth for November was discussed.
The Brent curve is on its way to full contango with Brent dipping into the $50ies/b. Thus the ongoing weakening we have had in the crude curve since the start of the year, and especially since early June, will continue until the Brent crude oil forward curve is in full contango along with visibly rising US and OECD oil inventories. The front-month Brent contract will then flip down towards the $60/b-line and below into the $50ies/b.
At what point will OPEC+ turn to cuts? The big question then becomes: When will OPEC+ turn around to make some cuts? At what (price) point will they choose to stabilize the market? Because for sure they will. Higher oil inventories, some more shedding of drilling rigs in US shale and Brent into the 50ies somewhere is probably where the group will step in.
There is nothing we have seen from the group so far which indicates that they will close their eyes, let the world drown in oil and the oil price crash to $40/b or below.
The message from OPEC+ is also about balance and stability. The world won’t drown in oil in 2026. The message from the group as far as we manage to interpret it is twofold: 1) Taking back market share which requires a lower price for non-OPEC+ to back off a bit, and 2) Oil market stability and balance. It is not just about 1. Thus fretting about how we are all going to drown in oil in 2026 is totally off the mark by just focusing on point 1.
When to buy cal 2026? Before Christmas when Brent hits $55/b and before OPEC+ holds its last meeting of the year which is likely to be in early December.
Brent crude oil prices have rebounded a bit along the forward curve. Not much strengthening in the structure of the curve. The front-end backwardation is not much stronger today than on its weakest level so far this year which was on Thursday last week.

The front-end backwardation fell to its weakest level so far this year on Thursday last week. A slight pickup yesterday and today, but still very close to the weakest year to date. More oil from OPEC+ in the coming months and softer demand and rising inventories. We are heading for yet softer levels.


Vad guldets uppgång egentligen betyder för världen

Spotpriset på guld över 4300 USD och silver över 54 USD
Crude oil soon coming to a port near you

Guld och silver stiger hela tiden mot nya höjder
The Mid-East anchor dragging crude oil lower

OPEC+ missar produktionsmål, stöder oljepriserna

Ett samtal om guld, olja, fjärrvärme och förnybar energi

Goldman Sachs höjer prognosen för guld, tror priset når 4900 USD
Guld nära 4000 USD och silver 50 USD, därför kan de fortsätta stiga
Are Ukraine’s attacks on Russian energy infrastructure working?
-
 Nyheter3 veckor sedan
OPEC+ missar produktionsmål, stöder oljepriserna
-
 Nyheter4 veckor sedan
Ett samtal om guld, olja, fjärrvärme och förnybar energi
-
 Nyheter2 veckor sedan
Goldman Sachs höjer prognosen för guld, tror priset når 4900 USD
-
 Nyheter2 veckor sedan
Guld nära 4000 USD och silver 50 USD, därför kan de fortsätta stiga
-
Analys4 veckor sedan
Are Ukraine’s attacks on Russian energy infrastructure working?
-

 Nyheter3 veckor sedan
Blykalla och amerikanska Oklo inleder ett samarbete
-

 Nyheter4 veckor sedan
Guldpriset uppe på nya höjder, nu 3750 USD
-
Nyheter3 veckor sedan
Ett samtal om guld, olja, koppar och stål