

Analys
SHB Råvarubrevet 13 september 2013

 Råvaror allmänt
I väntan på Fed
Det närmar sig den 18:e september då amerikanska centralbanken väntas ge besked om nedskalningen av obligationsköparprogrammen. Det har skrivits spaltmeter om detta ämne och det råder en bred konsensus om att Fed kommer minska köpen med 10-15 miljarder USD per månad. Vi har argumenterat för att detta är så gott som inprisat och tror inte att senaste tidens risker kring Mellanöstern kommer påverka Feds beslut. Intressant blir det däremot att se vad Fed signalerar kring framtida ränteläget. På onsdag får vi veta.
Vårt scenario med en global konjunkturbotten som ligger bakom oss fick fortsatt stöd under veckan med augustidata från Kina som var bättre än väntat. Industriproduktion, investeringar och återförsäljning stiger alla och pekar på en vändning under Q3 i Kina. Vår tro på att Q3:s BNP kommer överraska på uppsidan står fast och vi tycker att den synen har fått stöd i augusti månads barometerdata. Risken för en militär aktion från USA har minskat under veckan efter mötet i Genève. 4 dollar av riskpremien i Brentolja också pyst ut. LME metallerna har tappat sitt starka momentum från augusti. De positiva kinanyheterna klarar inte att vidhålla något rally utan negativa nyheter tar överhanden. Vi tror trots det att makrotrenden i Kina kommer vända trenden snart.
Basmetaller
Motigt trots starkt Kina
Trots positiv kinadata har basmetallerna fallit tillbaka något under veckan på oro för Fed´s tapering. Även Syrienoro kvarstår och gynnar inte risktillgångar som basmetaller och till det lägger vi till sämre än väntad industriproduktion från EU som pressade metallerna, främst kopparn, under veckan. Vi upprepar vår tro att den starka makrotrenden i Kina kommer vända trenden för metallerna snart.
Tenn, som steg kraftigt förra veckan efter nya exportregler i Indonesien, faller denna vecka med 2,3 %. Utbudstörningar i form av exportbegränsningar från världens största producent väntas fortsätta ge stöd åt priset. Då tenn används i tillverkningen av tv, datorer och telefoner visar prognoser samtidigt på ökad efterfråga. Stark makrodata bör ge stöd åt metallerna och vi behåller en positiv vy för denna sektor.
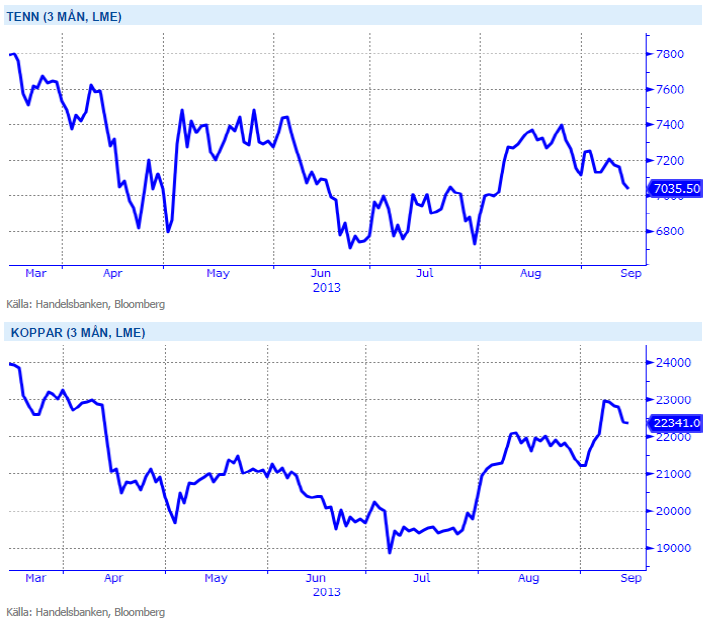
Kinas kopparimport har återigen ökat och såväl inhemska som globala lager har minskat samtidigt som investerare täckt sina korta positioner. Vi tror på: LONG KOPPAR
Ädelmetaller
Guldet fortsätter ned
Guldet har tappat ganska rejält under veckan som gått, drivet av USA:s mildrade retorik i Syrien-frågan. Hela fem procents nedgång på en vecka noterar vi, även om det är väldigt långt från rörelsen i april då det föll nästan 15 procent på bara två dagar. Vår kortsiktigt positiva syn kvarstår, även om det nu börjar kännas utmanande givet vår mer negativa långsiktiga syn. Vi tror dock att det är för tidigt att kasta in handduken på långa guldpositioner, av ett par skäl:
- Vi ser tecken på att inflationen kan komma att stiga, och att det är anledningen till att Fed kommer att guida mot högre räntor (tapering). Inflation är ingen långsiktig drivkraft för guldet, det har vi argumenterat tidigare, men den kortsiktiga effekten kan ge guldet en knuff uppåt.
- Även om retoriken mildrats runt Syrien-situationen så kommer det att kvarstå en hög risk för att något händer, vilket kommer att kunna leda till ”safe haven”-köp av guld.
- Vi ser ett generellt positivt momentum runt råvaror i den makromiljö vi har nu med stigande tillväxt och stigande inflation. Om övriga råvaror stiger tror vi att guldet kommer att följa med, åtminstone på kort sikt.
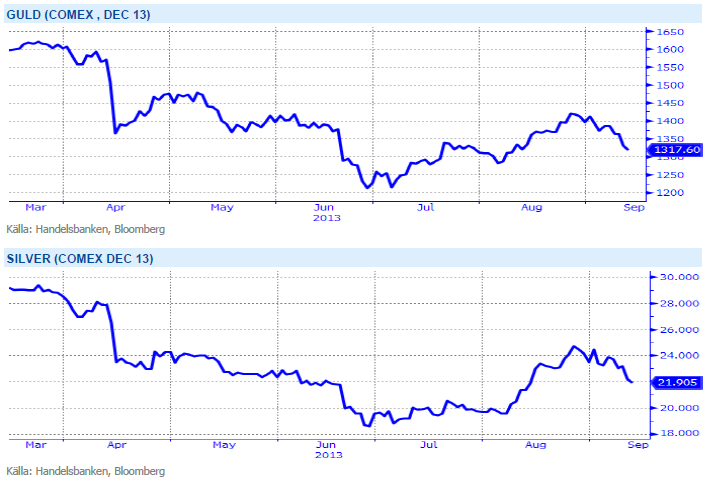
I ett läge där råvaror generellt har viktats ned av institutionella placerare kan guld och silver få en ”omotiverad” uppgång när dessa indexköpare återvänder till råvaror drivit av bättre utsikter för Kina och USA. Vi tror på: LONG GULD H och LONG SILVER H
Energi
Riskpremien pyser ut
Oljan föll med över 4 procent som mest efter att risken för en amerikansk intervention och upptrappning av konflikten kring Syrien minskat. Marknaden finner dock stöd mot slutet av veckan då Libyen deklarerat force majeure på ytterligare tre terminaler som dragits med problem under flera veckor. Även om Saudiarabien bör kunna täcka upp för detta bortfall de kommande månaderna tär det på en redan ansträngd reservkapacitet och vi anser att det ger fog för nuvarande riskpremie med potential på uppsidan. IEA reviderar dessutom upp sina tillväxtsiffror för global efterfrågan nästa år med 1.1 miljoner fat (+1.2 procent) till 92 miljoner fat. Intressant att notera att IEA även räknar med att USA passerar Ryssland om man ser till produktion av flytande bränslen. Slår vi ihop Olja och NGL förväntas USA nå 10.2 miljoner fat per dag att jämföra med Rysslands produktion om 10.8 mfpd men lägger vi även till den stora andelen av biobränslen bör USA passare Ryssland och nå en bit över 11 miljoner fat.
Elmarknaden och kvartalet Q1 2014 handlas i princip oförändrad under veckan och vi ligger kvar med vår rekommendation om köp då flertalet faktorer fortsatt pekar upp. Spotpriset överraskar på uppsidan men denna vecka är det främst utsläppsrätterna som stärks vilket drar med sig den tyska elmarknaden.
Kolet ångar på om än i måttlig takt vilket i kombination med en starkare dollar (mot euron) innebär ett något högre brytpris för kolgenererad kraft. Väderprognoserna visar på blött väder i mitten av perioden men en något torrare avslutning gör att energibalansen pekar på ett fortsatt underskott om ca 10 TWh.
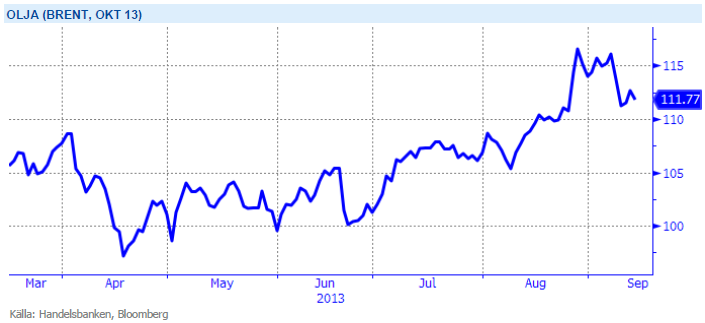
Oroligheterna i mellanöstern med risk för ytterligare produktionsbortfall ger stöd till oljepriset. Vi tror på: LONG OLJA
Livsmedel
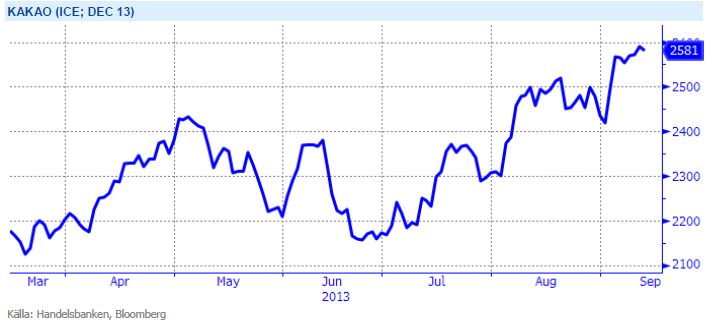
Kakao på årshögsta
Majsskörden går framåt i både USA och EU med bättre än väntad avkastning och kvalitet. Torsdagens rapport från amerikanska jordbruksdepartementet, USDA, visade på högre än väntad produktion av majs vilket pressade priset. Det ser ut att finnas gott om majs framöver i världen och svårt att se priserna gå upp från dagens nivåer. Det blir klart intressant att följa den fortsatta avkastningsnivån för den amerikanska majsen när skörden går norrut men några större överraskningar blir allt svårare att se. Torsdagens rapport visade dock lägre amerikanska lager än förväntat på sojabönor som fick priset att stiga med 4 %. Brist på nederbörd i kombination med varmt väder under augusti månad justerades avkastningen för de amerikanska sojabönorna ned igår och risken för ytterligare sänkningar är inte över än. Vi väntar oss därför en fortsatt nervös marknad kommande veckor tills faktiska avkastningsnivåer blivit mer känt. Uppsidan bedöms dock som ganska begränsad nu som följd av att en stor kommande brasiliansk skörd väntas – dock några månader tills dess. Brasilianska lantbrukare kan idag sälja kommande skörd på termin till rekordhöga priser hjälpt av en svag inhemsk valuta – vilket väntas leda till en rekordhög areal.
Den senaste tidens stigande Lean Hogspriser (gris) är drivet att dyrare priser på nötkött i USA. Fler och fler väljer därför fläsk, vilket har pressat upp priset till nivåer kring 90 cent/Ib. För oss som följt kakaons starka resa under året vet att den extrema hettan i juli vid Afrikas västkust följt av nederbörd under normalen i augusti hotar produktionen från Elfenbenskusten och Ghana. I skrivande stund handlas decemberkontraket över 2 590 dollar/ton, vilket är årshögsta för denna lyxiga mjuka råvara. Dock väntas bättre väderförhållanden för skörden som nu går mot slutfasen. Kaffe-priset däremot fortsätter att backa och har under veckan handlats till fyra års lägsta.
Förväntningar på den kommande risproduktionen är stor och prognoser visar på välfyllda lager. Vi tror på: SHORT RIS
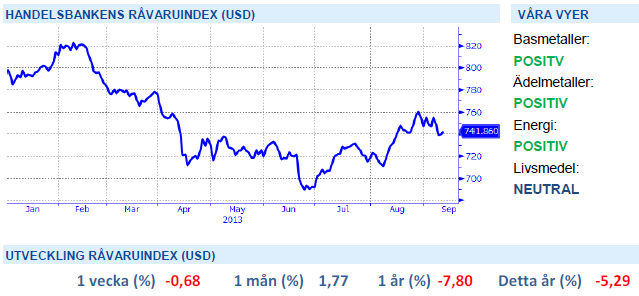
Handelsbankens Råvaruindex
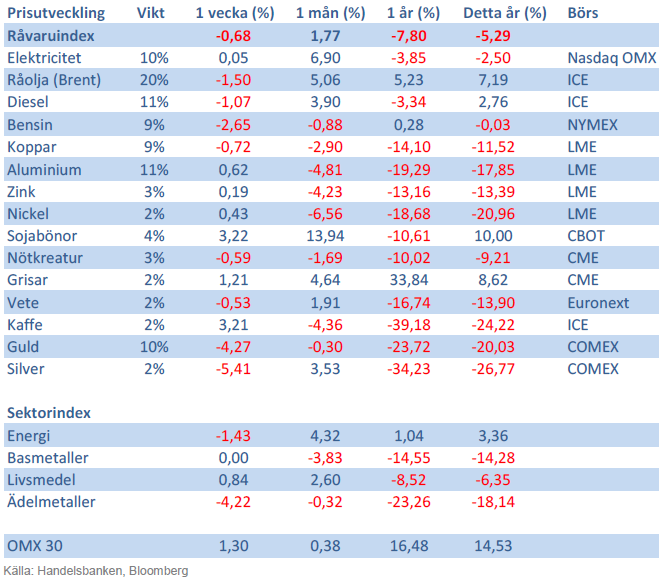
Handelsbankens råvaruindex består av de underliggande indexen för respektive råvara. Vikterna är bestämda till hälften från värdet av nordisk produktion (globala produktionen för sektorindex) och till hälften från likviditeten i terminskontrakten.
[box]SHB Råvarubrevet är producerat av Handelsbanken och publiceras i samarbete och med tillstånd på Råvarumarknaden.se[/box]
Ansvarsbegränsning
Detta material är producerat av Svenska Handelsbanken AB (publ) i fortsättningen kallad Handelsbanken. De som arbetar med innehållet är inte analytiker och materialet är inte oberoende investeringsanalys. Innehållet är uteslutande avsett för kunder i Sverige. Syftet är att ge en allmän information till Handelsbankens kunder och utgör inte ett personligt investeringsråd eller en personlig rekommendation. Informationen ska inte ensamt utgöra underlag för investeringsbeslut. Kunder bör inhämta råd från sina rådgivare och basera sina investeringsbeslut utifrån egen erfarenhet.
Informationen i materialet kan ändras och också avvika från de åsikter som uttrycks i oberoende investeringsanalyser från Handelsbanken. Informationen grundar sig på allmänt tillgänglig information och är hämtad från källor som bedöms som tillförlitliga, men riktigheten kan inte garanteras och informationen kan vara ofullständig eller nedkortad. Ingen del av förslaget får reproduceras eller distribueras till någon annan person utan att Handelsbanken dessförinnan lämnat sitt skriftliga medgivande. Handelsbanken ansvarar inte för att materialet används på ett sätt som strider mot förbudet mot vidarebefordran eller offentliggörs i strid med bankens regler.


When it starts to move lower it moves rather quickly. Gaza, China, IEA. Brent crude is down 2.1% today to $62/b after having traded as high as $66.58/b last Thursday and above $70/b in late September. The sell-off follows the truce/peace in Gaze, a flareup in US-China trade and yet another bearish oil outlook from the IEA.

A lasting peace in Gaze could drive crude oil at sea to onshore stocks. A lasting peace in Gaza would probably calm down the Houthis and thus allow more normal shipments of crude oil to sail through the Suez Canal, the Red Sea and out through the Bab-el-Mandeb Strait. Crude oil at sea has risen from 48 mb in April to now 91 mb versus a pre-Covid normal of about 50-60 mb. The rise to 91 mb is probably the result of crude sailing around Africa to be shot to pieces by the Houthis. If sailings were to normalize through the Suez Canal, then it could free up some 40 mb in transit at sea moving onshore into stocks.
The US-China trade conflict is of course bearish for demand if it continues.
Bearish IEA yet again. Getting closer to 2026. Credibility rises. We expect OPEC to cut end of 2025. The bearish monthly report from the IEA is what it is, but the closer we get to 2026, the more likely the IEA is of being ball-park right in its outlook. In its monthly report today the IEA estimates that the need for crude oil from OPEC in 2026 will be 25.4 mb/d versus production by the group in September of 29.1 mb/d. The group thus needs to do some serious cutting at the end of 2025 if it wants to keep the market balanced and avoid inventories from skyrocketing. Given that IEA is correct that is. We do however expect OPEC to implement cuts to avoid a large increase in inventories in Q1-26. The group will probably revert to cuts either at its early December meeting when they discuss production for January or in early January when they discuss production for February. The oil price will likely head yet lower until the group reverts to cuts.
Dubai: The Mid-East anchor dragging crude oil lower. Surplus emerging in Mid-East pricing. Crude oil prices held surprisingly strong all through the summer. A sign and a key source of that strength came from the strength in the front-end backwardation of the Dubai crude oil curve. It held out strong from mid-June and all until late September with an average 1-3mth time-spread premium of $1.8/b from mid-June to end of September. The 1-3mth time-spreads for Brent and WTI however were in steady deterioration from late June while their flat prices probably were held up by the strength coming from the Persian Gulf. Then in late September the strength in the Dubai curve suddenly collapsed. Since the start of October it has been weaker than both the Brent and the WTI curves. The Dubai 1-3mth time-spread now only stands at $0.25/b. The Middle East is now exporting more as it is producing more and also consuming less following elevated summer crude burn for power (Aircon) etc.
The only bear-element missing is a sudden and solid rise in OECD stocks. The only thing that is missing for the bear-case everyone have been waiting for is a solid, visible rise in OECD stocks in general and US oil stocks specifically. So watch out for US API indications tomorrow and official US oil inventories on Thursday.
No sign of any kind of fire-sale of oil from Saudi Arabia yet. To what we can see, Saudi Arabia is not at all struggling to sell its oil. It only lowered its Official Selling Prices (OSPs) to Asia marginally for November. A surplus market + Saudi determination to sell its oil to the market would normally lead to a sharp lowering of Saudi OSPs to Asia. Not yet at least and not for November.
The 5yr contract close to fixed at $68/b. Of importance with respect to how far down oil can/will go. When the oil market moves into a surplus then the spot price starts to trade in a large discount to the 5yr contract. Typically $10-15/b below the 5yr contract on average in bear-years (2009, 2015, 2016, 2020). But the 5yr contract is usually pulled lower as well thus making this approach a moving target. But the 5yr contract price has now been rock solidly been pegged to $68/b since 2022. And in the 2022 bull-year (Brent spot average $99/b), the 5yr contract only went to $72/b on average. If we assume that the same goes for the downside and that 2026 is a bear-year then the 5yr goes to $64/b while the spot is trading at a $10-15/b discount to that. That would imply an average spot price next year of $49-54/b. But that is if OPEC doesn’t revert to cuts and instead keeps production flowing. We think OPEC(+) will trim/cut production as needed into 2026 to prevent a huge build-up in global oil stocks and a crash in prices. But for now we are still heading lower. Into the $50ies/b.
Some rebound but not much. Brent crude rebounded 1.5% yesterday to $65.47/b. This morning it is inching 0.2% up to $65.6/b. The lowest close last week was on Thursday at $64.11/b.
The curve structure is almost as week as it was before the weekend. The rebound we now have gotten post the message from OPEC+ over the weekend is to a large degree a rebound along the curve rather than much strengthening at the front-end of the curve. That part of the curve structure is almost as weak as it was last Thursday.
We are still on a weakening path. The message from OPEC+ over the weekend was we are still on a weakening path with rising supply from the group. It is just not as rapidly weakening as was feared ahead of the weekend when a quota hike of 500 kb/d/mth for November was discussed.
The Brent curve is on its way to full contango with Brent dipping into the $50ies/b. Thus the ongoing weakening we have had in the crude curve since the start of the year, and especially since early June, will continue until the Brent crude oil forward curve is in full contango along with visibly rising US and OECD oil inventories. The front-month Brent contract will then flip down towards the $60/b-line and below into the $50ies/b.
At what point will OPEC+ turn to cuts? The big question then becomes: When will OPEC+ turn around to make some cuts? At what (price) point will they choose to stabilize the market? Because for sure they will. Higher oil inventories, some more shedding of drilling rigs in US shale and Brent into the 50ies somewhere is probably where the group will step in.
There is nothing we have seen from the group so far which indicates that they will close their eyes, let the world drown in oil and the oil price crash to $40/b or below.
The message from OPEC+ is also about balance and stability. The world won’t drown in oil in 2026. The message from the group as far as we manage to interpret it is twofold: 1) Taking back market share which requires a lower price for non-OPEC+ to back off a bit, and 2) Oil market stability and balance. It is not just about 1. Thus fretting about how we are all going to drown in oil in 2026 is totally off the mark by just focusing on point 1.
When to buy cal 2026? Before Christmas when Brent hits $55/b and before OPEC+ holds its last meeting of the year which is likely to be in early December.
Brent crude oil prices have rebounded a bit along the forward curve. Not much strengthening in the structure of the curve. The front-end backwardation is not much stronger today than on its weakest level so far this year which was on Thursday last week.

The front-end backwardation fell to its weakest level so far this year on Thursday last week. A slight pickup yesterday and today, but still very close to the weakest year to date. More oil from OPEC+ in the coming months and softer demand and rising inventories. We are heading for yet softer levels.

Down to the lowest since early May. Brent crude has fallen sharply the latest four days. It closed at USD 64.11/b yesterday which is the lowest since early May. It is staging a 1.3% rebound this morning along with gains in both equities and industrial metals with an added touch of support from a softer USD on top.
What stands out the most to us this week is the collapse in the Dubai one to three months time-spread.
Dubai is medium sour crude. OPEC+ is in general medium sour crude production. Asian refineries are predominantly designed to process medium sour crude. So Dubai is the real measure of the balance between OPEC+ holding back or not versus Asian oil demand for consumption and stock building.
A sharp weakening of the front-end of the Dubai curve. The front-end of the Dubai crude curve has been holding out very solidly throughout this summer while the front-end of the Brent and WTI curves have been steadily softening. But the strength in the Dubai curve in our view was carrying the crude oil market in general. A source of strength in the crude oil market. The core of the strength.
The now finally sharp decline of the front-end of the Dubai crude curve is thus a strong shift. Weakness in the Dubai crude marker is weakness in the core of the oil market. The core which has helped to hold the oil market elevated.
Facts supports the weakening. Add in facts of Iraq lifting production from Kurdistan through Turkey. Saudi Arabia lifting production to 10 mb/d in September (normal production level) and lifting exports as well as domestic demand for oil for power for air con is fading along with summer heat. Add also in counter seasonal rise in US crude and product stocks last week. US oil stocks usually decline by 1.3 mb/week this time of year. Last week they instead rose 6.4 mb/week (+7.2 mb if including SPR). Total US commercial oil stocks are now only 2.1 mb below the 2015-19 seasonal average. US oil stocks normally decline from now to Christmas. If they instead continue to rise, then it will be strongly counter seasonal rise and will create a very strong bearish pressure on oil prices.
Will OPEC+ lift its voluntary quotas by zero, 137 kb/d, 500 kb/d or 1.5 mb/d? On Sunday of course OPEC+ will decide on how much to unwind of the remaining 1.5 mb/d of voluntary quotas for November. Will it be 137 kb/d yet again as for October? Will it be 500 kb/d as was talked about earlier this week? Or will it be a full unwind in one go of 1.5 mb/d? We think most likely now it will be at least 500 kb/d and possibly a full unwind. We discussed this in a not earlier this week: ”500 kb/d of voluntary quotas in October. But a full unwind of 1.5 mb/d”
The strength in the front-end of the Dubai curve held out through summer while Brent and WTI curve structures weakened steadily. That core strength helped to keep flat crude oil prices elevated close to the 70-line. Now also the Dubai curve has given in.

Brent crude oil forward curves

Total US commercial stocks now close to normal. Counter seasonal rise last week. Rest of year?

Total US crude and product stocks on a steady trend higher.


Guld och silver stiger hela tiden mot nya höjder
The Mid-East anchor dragging crude oil lower

Samtal om sällsynta jordartsmetaller, guld och silver

Brookfield köper bränsleceller för 5 miljarder USD av Bloom Energy för att driva AI-datacenter

Teck Resources kan förse Nordamerika och kanske hela G7 med all germanium som behövs

Tyskland har så höga elpriser att företag inte har råd att använda elektricitet

OPEC+ missar produktionsmål, stöder oljepriserna

Ett samtal om guld, olja, fjärrvärme och förnybar energi
Brent crude ticks higher on tension, but market structure stays soft

Guld nära 4000 USD och silver 50 USD, därför kan de fortsätta stiga
-
Nyheter4 veckor sedan
Tyskland har så höga elpriser att företag inte har råd att använda elektricitet
-
 Nyheter3 veckor sedan
OPEC+ missar produktionsmål, stöder oljepriserna
-
 Nyheter3 veckor sedan
Ett samtal om guld, olja, fjärrvärme och förnybar energi
-
Analys4 veckor sedan
Brent crude ticks higher on tension, but market structure stays soft
-
 Nyheter2 veckor sedan
Guld nära 4000 USD och silver 50 USD, därför kan de fortsätta stiga
-
Analys3 veckor sedan
Are Ukraine’s attacks on Russian energy infrastructure working?
-

 Nyheter3 veckor sedan
Guldpriset uppe på nya höjder, nu 3750 USD
-

 Nyheter2 veckor sedan
Blykalla och amerikanska Oklo inleder ett samarbete