

Analys
Modity om elpriset vecka 9 2015

Veckans marknadskommentar
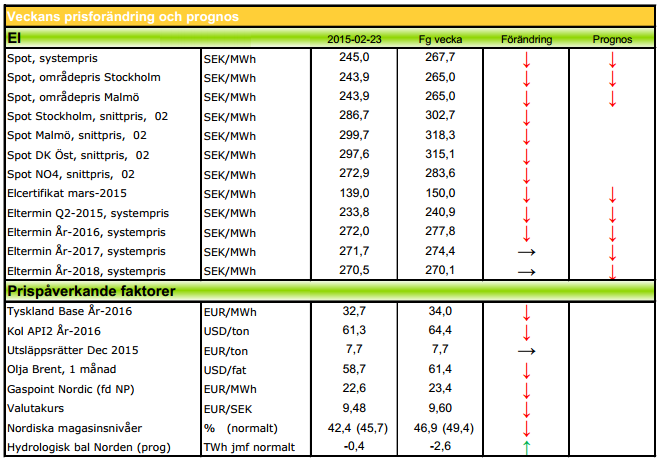
Kol och olja har vänt ned igen, på överutbud, och påverkar det mesta. Elen är ned på varma, blöta och blåsiga prognoser. Utsläppsrätterna vacklar men osäkerhet inför omröstningen. Hydrobalansen håller sig positiv och väntas stärkas ytterligare i det närmaste. Elcerten visar det största fallet och sätter nya lägstanoteringar.
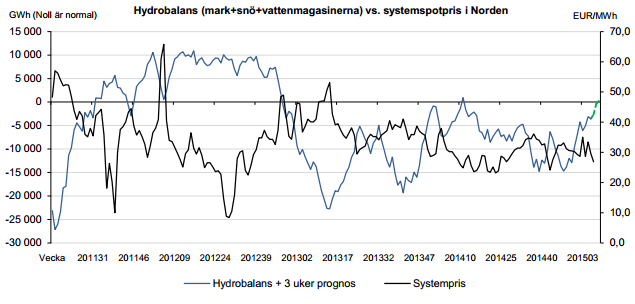
Hydrobalansen ligger v07 på 0,5 TWh över normalen. Det är lite mindre än vad som var väntat. Den största osäkerhetsfaktorn är i snömängden. Det har kommit snö rätt ojämnt fördelat över Skandinavien, väldigt mycket på sina ställen och väldigt lite på andra. Den rådande värmen gör också att avsmältningen pågår. Det är fortfarande så att prognoserna ser blöta och milda ut så en fortsatt upplagring av energi över normalen verkar det bli!
Kärnkraftverken i Norden har idag den 23/2 en produktion på 81 % (10 046 MW). Ringhals 4 kör nu aningen reducerat. Annars är Oskarshamn 2 kvar ute till september och Ringhals 2 till november. Finska Olkiluoto 2 förväntas nu starta i kväll för att vara i full drift igen under morgondagen. PRESSTOPP! Nu precis kom en blänka om att man senarelägger starten till i morgon bitti kl 06! De finska verken körs därmed 68 %.
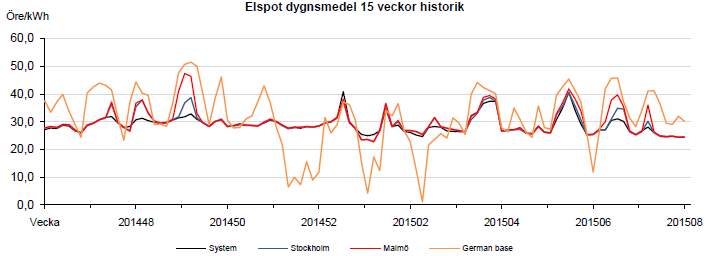
Systemspotpriset förra veckan blev 26,87 €/MWh. Det var en tillbakagång på nästan tre euro. I prisområde SE3 blev den 27,87 och i SE4 28,0. En stark press på vattenkraften i och med att det finns mycket vatten som måste tas hand om innan snösmältningen sätter igång. Särsilt i östra Norge har man haft ett högt flöde och varnat för ”flom”. När nu väderläget är varmt även på kontinenten kommer det att resultera i ytterligare sjunkande priser. Vi ser att vattenkraftproducenterna har sänkt sina priser, särskilt under nattimmarna.
Terminspriser
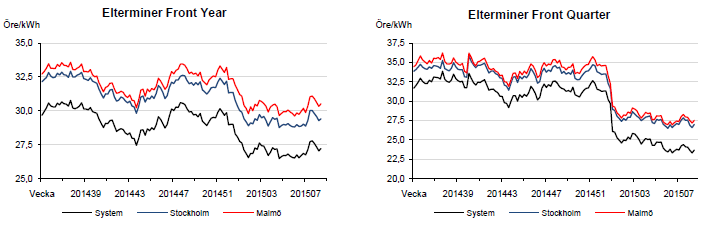
Nu har allt blivit som vanligt. Och med som vanligt menar jag fallande priser. Det är inte många faktorer som just nu pekar på en förändring. Hydroläget är mycket gott, för att bli bättre. Press på spotpriserna förväntas. Värme utöver det normala samt nederbörd i den närmsta perioden med flera TWh över normalt. Svårt att se att det ska bli någon rusning att köpa elterminer, just nu. Q2 är snart tillbaka på sitt all-time-low sedan förra veckan, YR-16 har en liten bit kvar. När nu både oljan och kolet är på väg ned igen känns terminsmarknaden på den längre sidan också svag. Q2 omsätts i skrivande stund på 24,55. År 16 handlas nu på 28,35 €/MWh.
Bränslemarknaden
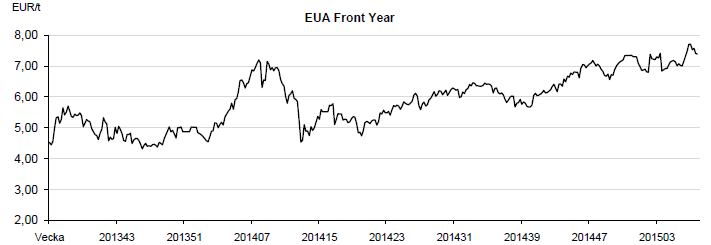
Utsläppsrätter, CO2
Nu är det många som vill analysera ett utfall utifrån olika scenarior. De flesta tror på höjda priser. Debatten står om huruvida miljösidan (ENVI), som vill ha start för MSR redan 2017, verkligen får igenom det. ”Motståndarna”, EPP, som behövs för majoritet, har antytt kompromissvilja till 2018 – ett närmande med ett år från tidigare 2019. Det finns för många utsläppsrätter i marknaden och fråga blir sedan vad man ska göra med backloadingrätterna – ut på marknaden, in i MSR eller tas bort. Inget om det finns förslag på just nu.
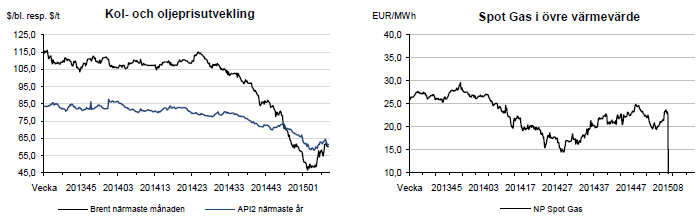
Olja: Oljan befinner sig i ett starkt utbudsöverskott. Det är svårt att bli av med den amerikanska WTI-oljan om man inte får utöka sin infrastruktur på den kontinenten. Priskurvorna pekar nu nedåt på dessa båda oljemarknader. Bara Brent, närmsta månadet, har kommit tillbaka ca 3 USD sedan förra veckan. Kan vara ett tecken på att den uppåtrekyl som kom vid 44,53 USD/bbn, bara var just en rekyl, orsakad av vinstintressen. Det mesta tyder på en fortsatt nedgång i oljepriset. Det finns en sak som kan antyda motsatsen – det är att det kinesiska nyårsfirande är över. Osäkerheten i marknaden om huruvida Kina nu ska börja konsumera olja, kan påverka prisbilden. Det första som i så fall tyder på det är att fraktraterna kommer att stiga. Fundamentalt borde oljepriset sjunka.
Kol: Här menar alla att marknaden har ett enormt överskott. Ändå har priset gått upp senaste veckan och omsattes senast på 64,40 USD/ton. Anledningen till det är att det följer oljepriset, men tycks reagera långsammare. Därför har det inte vänt ned igen, som oljan, ännu.
Naturgas: Neddragningen i gasproduktion i holländska Groningen uppgår till ca 40 % på årsbasis. Groningen står normalt för ca 10 % av hela Europas behov så begränsningen är inte marginell. De tidigare så välfyllda gaslagren har använts till stor del och man är nu tvungen att köpa mer på marknaden igen. Detta kommer att påverka priserna för nästa år. Men – det är har varit och kommer att vara relativt varmt över kontinenten vilket gör att efterfrågan är låg. Det är även fortsatt högt inflöde av billig LNG på marknaden, vilket sammantaget påverkar nedåt.
Elcertifikat
Det har blåst kraftigt – elcert har producerats med vindens hastighet! Priserna har följaktligen sjunkit. Mer än någonsin och vi kan notera all-time-low för alla produkter. Att efterfrågan har varit låg på grund av värmen hjälper till att trycka nedåt. Mars -15 stängde i fredags på 140 SEK. Övriga priser: Mars-16 141 SEK och Mars-17 143 SEK.
Valuta
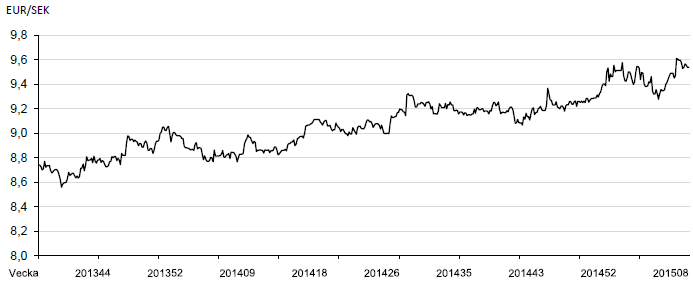
Valutakommentar
I fredags kväll kom Grekland och EU:s finansministrar överrens om en uppgörelse som räddar grekerna kvar i Eurosamarbetet. Det har inte inneburit någon nämnvärd reaktion för kronan mot euron utan vi handlar sidledes på 9,56 senast där toppen av rangen är 9,70 och botten är 9,30. Vi förväntar oss en starkare krona framöver som borde stärkas mot stödet nere vid 9,30. Mot dollarn är kronan alltjämt svag och man får hosta upp 8,45 på spotmarknaden för en dollar. Vi har nu 11 månader bakom oss med högre bottnar och högre toppar. Rekyler är köpvärda.
Teknisk analys
Teknisk analys Q2-15
Q2 handlades mellan 24,35 och 25,25 €/MWh förra veckan. Just nu handlas den på 24,30 och vi har ytterligare en vecka med lägre botten. Nedåttrenden är alltså intakt. Vi har numera 7 veckor med fallande toppar på frontkvartalet och vi bedömer att sannolikheten att vi fortsätter ner är stor. På uppsidan drar vi öronen åt oss om vi handlar över 25,50 då trenden får anses vara bruten. På nedsidan finns inga tal att förhålla sig till eftersom det är nya lägstanoteringar på kontraktet.
Teknisk analys År-16
År-16 handlades mellan 28,25 och 29,00 €/MWh förra veckan. Vi hade då en situation där årskontraktet gav oss en köpsignal samtidigt som frontkvartalet fortsatt var på en säljsignal. Som vi sa i föregående uppdatering var sannolikheten större att vi handlar ned än upp. Mycket riktigt så blev kontraktet avvisat från toppen av den aktuella rangen (ca 28,00 – 29,00) för att nu omsättas på 28,20. Det innebär att även årskontraktet är tillbaka på en säljsignal där vi noterar att vi har en lägre botten och att vi möjligen får se en fortsättning av nedåttrenden. 27,95 har tidigare varit stöd vid två tillfällen. Det kallas en dubbelbotten. Det finns egentligen inget begrepp som heter en trippelbotten och därmed ökar risken för att vi bryter igenom stödet om det utmanas på nytt.
[box]Denna energimarknadskommentar om elpriset publiceras på Råvarumarknaden.se med tillstånd och i samarbete med Modity Energy Trading.[/box]
Ansvarsfriskrivning
Energimarknadskommentaren har producerats av Modity Energy Trading. Informationen är rapporterad i god tro och speglar de aktuella åsikterna hos medarbetarna, dessa kan ändras utan varsel. Modity Energy Trading tar inget ansvar för handlingar baserade på informationen.
Om Modity Energy Trading
Modity Energy Trading erbjuder energibolag och större företag den erfarenhet, kompetens och analysredskap som krävs för en trygg och effektiv förvaltning av energiportföljen. Modity bedriver handel med allt från el och gas, till elcertifikat, valutor och utsläppsrätter. Företagets kunder får dessutom ta del av deras analysprodukter som t.ex det fullständiga marknadsbrevet med ytterligare kommentarer och prognoser. För ytterligare information se hemsidan.


Parts of the Brent crude curve dipping into the high $50ies/b. Brent crude fell 2.3% over the week to Friday. It closed the week at $61.29/b, a slight gain on the day, but also traded to a low of $60.14/b that same day and just barely avoided trading into the $50ies/b. This morning it is risk-on in equities which seems to help industrial metals a little higher. But no such luck for oil. It is down 0.8% at $60.8/b. This week looks set for Brent crude to dip its feet in the $50ies/b. The Brent 3mth contract actually traded into the high $50ies/b on Friday.

The front-end backwardation has been on a weakening foot and is now about to fully disappear. The lowest point of the crude oil curve has also moved steadily lower and lower and its discount to the 5yr contract is now $6.8/b. A solid contango. The Brent 3mth contract did actually dip into the $50ies/b intraday on Friday when it traded to a low point of $59.93/b.
More weakness to come as lots of oil at sea comes to ports. Mid-East OPEC countries have boosted exports along with lower post summer consumption and higher production. The result is highly visibly in oil at sea which increased by 17 mb to 1,311 mb over the week to Sunday. Up 185 mb since mid-August. On its way to discharge at a port somewhere over the coming month or two.
Don’t forget that the oil market path ahead is all down to OPEC+. Remember that what is playing out in the oil market now is all by design by OPEC+. The group has decided that the unwind of the voluntary cuts is what it wants to do. In a combination of meeting demand from consumers as well as taking back market share. But we need to remember that how this plays out going forward is all at the mercy of what OPEC+ decides to do. It will halt the unwinding at some point. It will revert to cuts instead of unwind at some point.
A few months with Brent at $55/b and 40-50 US shale oil rigs kicked out may be what is needed. We think OPEC+ needs to see the exit of another 40-50 drilling rigs in the US shale oil patches to set US shale oil production on a path to of a 1 mb/d year on year decline Dec-25 to Dec-26. We are not there yet. But a 2-3 months period with Brent crude averaging $55/b would probably do it.
Oil on water increased 17 mb over the week to Sunday while oil in transit increased by 23 mb. So less oil was standing still. More was moving.

Crude oil floating storage (stationary more than 7 days). Down 11 mb over week to Sunday

The lowest point of the Brent crude oil curve versus the 5yr contract. Weakest so far this year.

Crude oil 1mth to 3mth time-spreads. Dubai held out strongly through summer, but then that center of strength fell apart in late September and has been leading weakness in crude curves lower since then.

Rebounding along with most markets. But concerns over solidity of Gaza peace may also contribute. Brent crude fell 0.8% yesterday to $61.91/b and its lowest close since May this year. This morning it is bouncing up 0.9% to $62.5/b along with a softer USD amid positive sentiment with both equities and industrial metals moving higher. Concerns that the peace in Gaza may be less solid than what one might hope for also yields some support to Brent. Bets on tech stocks are rebounding, defying fears of trade war. Money moving back into markets. Gold continues upwards its strong trend and a softer dollar helps it higher today as well.
US crude & products probably rose 5.6 mb last week (API) versus a normal seasonal decline of 2.4 mb. The US API last night partial and thus indicative data for US oil inventories. Their data indicates that US crude stocks rose 7.4 mb last week, gasoline stocks rose 3.0 mb while Distillate stocks fell 4.8 mb. Altogether an increase in commercial crude and product stocks of 5.6 mb. Commercial US crude and product stocks normally decline by 2.4 mb this time of year. So seasonally adjusted the US inventories rose 8 mb last week according to the indicative numbers by the API. That is a lot. Also, the counter seasonal trend of rising stocks versus normally declining stocks this time of year looks on a solid pace of continuation. If the API is correct then total US crude and product stocks would stand 41 mb higher than one year ago and 6 mb higher than the 2015-19 average. And if we combine this with our knowledge of a sharp increase in production and exports by OPEC(+) and a large increase in oil at sea, then the current trend in US oil inventories looks set to continue. So higher stocks and lower crude oil prices until OPEC(+) switch to cuts. Actual US oil inventory data today at 18:00 CET.
US commercial crude and product stocks rising to 1293 mb in week 41 if last nights indicative numbers from API are correct.

Crude oil soon coming to a port near you. OPEC has lifted production sharply higher this autumn. At the same time demand for oil in the Middle-East has fallen as we have moved out of summer heat and crude oil burn for power for air-conditioning. The Middle-East oil producers have thus been able to lift exports higher on both accounts. Crude oil and condensates on water has shot up by 177 mb since mid-August. This oil is now on its way to ports around the world. And when they arrive, it will likely help to lift stocks onshore higher. That is probably when we will lose the last bit of front-end backwardation the the crude oil curves. That will help to drive the front-month Brent crude oil price down to the $60/b line and revisit the high $50ies/b. Then the eyes will be all back on OPEC+ when they meet in early November and then again in early December.
Crude oil and condensates at sea have moved straight up by 177 mb since mid-August as OPEC(+) has produced more, consumed less and exported more.

When it starts to move lower it moves rather quickly. Gaza, China, IEA. Brent crude is down 2.1% today to $62/b after having traded as high as $66.58/b last Thursday and above $70/b in late September. The sell-off follows the truce/peace in Gaze, a flareup in US-China trade and yet another bearish oil outlook from the IEA.
A lasting peace in Gaze could drive crude oil at sea to onshore stocks. A lasting peace in Gaza would probably calm down the Houthis and thus allow more normal shipments of crude oil to sail through the Suez Canal, the Red Sea and out through the Bab-el-Mandeb Strait. Crude oil at sea has risen from 48 mb in April to now 91 mb versus a pre-Covid normal of about 50-60 mb. The rise to 91 mb is probably the result of crude sailing around Africa to be shot to pieces by the Houthis. If sailings were to normalize through the Suez Canal, then it could free up some 40 mb in transit at sea moving onshore into stocks.
The US-China trade conflict is of course bearish for demand if it continues.
Bearish IEA yet again. Getting closer to 2026. Credibility rises. We expect OPEC to cut end of 2025. The bearish monthly report from the IEA is what it is, but the closer we get to 2026, the more likely the IEA is of being ball-park right in its outlook. In its monthly report today the IEA estimates that the need for crude oil from OPEC in 2026 will be 25.4 mb/d versus production by the group in September of 29.1 mb/d. The group thus needs to do some serious cutting at the end of 2025 if it wants to keep the market balanced and avoid inventories from skyrocketing. Given that IEA is correct that is. We do however expect OPEC to implement cuts to avoid a large increase in inventories in Q1-26. The group will probably revert to cuts either at its early December meeting when they discuss production for January or in early January when they discuss production for February. The oil price will likely head yet lower until the group reverts to cuts.
Dubai: The Mid-East anchor dragging crude oil lower. Surplus emerging in Mid-East pricing. Crude oil prices held surprisingly strong all through the summer. A sign and a key source of that strength came from the strength in the front-end backwardation of the Dubai crude oil curve. It held out strong from mid-June and all until late September with an average 1-3mth time-spread premium of $1.8/b from mid-June to end of September. The 1-3mth time-spreads for Brent and WTI however were in steady deterioration from late June while their flat prices probably were held up by the strength coming from the Persian Gulf. Then in late September the strength in the Dubai curve suddenly collapsed. Since the start of October it has been weaker than both the Brent and the WTI curves. The Dubai 1-3mth time-spread now only stands at $0.25/b. The Middle East is now exporting more as it is producing more and also consuming less following elevated summer crude burn for power (Aircon) etc.
The only bear-element missing is a sudden and solid rise in OECD stocks. The only thing that is missing for the bear-case everyone have been waiting for is a solid, visible rise in OECD stocks in general and US oil stocks specifically. So watch out for US API indications tomorrow and official US oil inventories on Thursday.
No sign of any kind of fire-sale of oil from Saudi Arabia yet. To what we can see, Saudi Arabia is not at all struggling to sell its oil. It only lowered its Official Selling Prices (OSPs) to Asia marginally for November. A surplus market + Saudi determination to sell its oil to the market would normally lead to a sharp lowering of Saudi OSPs to Asia. Not yet at least and not for November.
The 5yr contract close to fixed at $68/b. Of importance with respect to how far down oil can/will go. When the oil market moves into a surplus then the spot price starts to trade in a large discount to the 5yr contract. Typically $10-15/b below the 5yr contract on average in bear-years (2009, 2015, 2016, 2020). But the 5yr contract is usually pulled lower as well thus making this approach a moving target. But the 5yr contract price has now been rock solidly been pegged to $68/b since 2022. And in the 2022 bull-year (Brent spot average $99/b), the 5yr contract only went to $72/b on average. If we assume that the same goes for the downside and that 2026 is a bear-year then the 5yr goes to $64/b while the spot is trading at a $10-15/b discount to that. That would imply an average spot price next year of $49-54/b. But that is if OPEC doesn’t revert to cuts and instead keeps production flowing. We think OPEC(+) will trim/cut production as needed into 2026 to prevent a huge build-up in global oil stocks and a crash in prices. But for now we are still heading lower. Into the $50ies/b.


Australien och USA investerar 8,5 miljarder USD för försörjningskedja av kritiska mineraler
Brent crude set to dip its feet into the high $50ies/b this week

Vad guldets uppgång egentligen betyder för världen

Spotpriset på guld över 4300 USD och silver över 54 USD
Crude oil soon coming to a port near you

OPEC+ missar produktionsmål, stöder oljepriserna

Ett samtal om guld, olja, fjärrvärme och förnybar energi

Goldman Sachs höjer prognosen för guld, tror priset når 4900 USD
Guld nära 4000 USD och silver 50 USD, därför kan de fortsätta stiga

Blykalla och amerikanska Oklo inleder ett samarbete
-
 Nyheter3 veckor sedan
OPEC+ missar produktionsmål, stöder oljepriserna
-
 Nyheter4 veckor sedan
Ett samtal om guld, olja, fjärrvärme och förnybar energi
-
 Nyheter2 veckor sedan
Goldman Sachs höjer prognosen för guld, tror priset når 4900 USD
-
 Nyheter3 veckor sedan
Guld nära 4000 USD och silver 50 USD, därför kan de fortsätta stiga
-
 Nyheter3 veckor sedan
Blykalla och amerikanska Oklo inleder ett samarbete
-
Analys4 veckor sedan
Are Ukraine’s attacks on Russian energy infrastructure working?
-

 Nyheter4 veckor sedan
Guldpriset uppe på nya höjder, nu 3750 USD
-
Nyheter3 veckor sedan
Ett samtal om guld, olja, koppar och stål