

Analys
Kvartalsrapport för råvaror – Optimismen spirar

 På toppen av en minicykel
Optimismen spirar
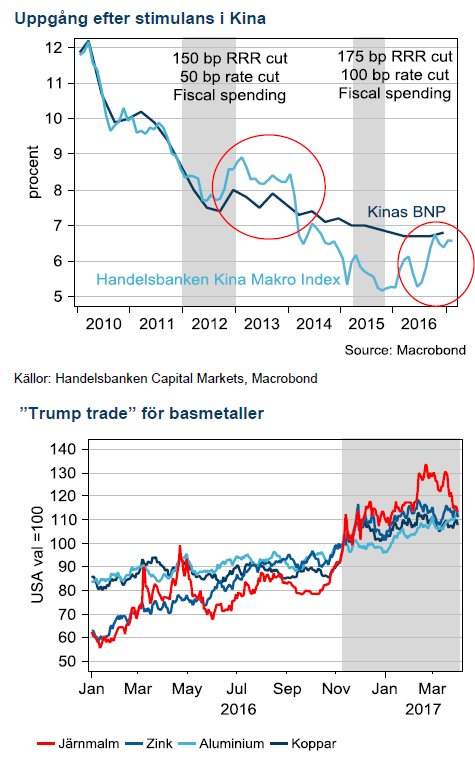 Global optimism i kombination med goda ekonomiska data har spillt över till en förväntan om en självuppfyllande global återhämtning. Vi ser tre drivkrafter till att den globala ekonomiska aktiviteten tagit fart igen sedan i höstas. De första två gäller centralbankers stimulativa penningpolitik samt den expansiva politiken i Kina. Den tredje är återhämtningen på råvarumarknaderna, i synnerhet för oljepriset.
Optimismen efter det amerikanska valet i november förra året har allmänt betraktats som en ”Trump trade”, Vi tror dock att bättre ekonomisk statistik i hög grad är en effekt av de tre ovannämnda faktorerna, snarare än Trump. De här tre drivkrafterna har tillsammans haft kraft att lyfta ekonomin och tillväxtförväntningarna, men effekten kommer att avta längre fram under 2017 och Trump ser ut att få svårt att kompensera för det.
OPEC förlänger avtalet?
Det halvårsvisa OPEC-mötet i Wien gav ett styrkebesked från den slumrande kartellen. Knappt har pumparna strypts fören marknadens fokus ligger på om gruppen förlänger avtalet vid nästa möte den 25e maj. Marknaden tror på en förlängning men vi argumenterar för att ett överraskande uppbrott från avtalet inte är så osannolikt ändå. Oljepriset tror vi kommer närma sig USD 40 oavsett OPEC-mötets utfall.
Basmetallerna följer Kinas minicykel
Kinas återhämtning under 2016 ser ut att hålla i sig allt längre. Senaste dataskörden indikerar åtminstone ytterligare sex månader med stark aktivitet.
Basmetaller
 Boomen fortsätter
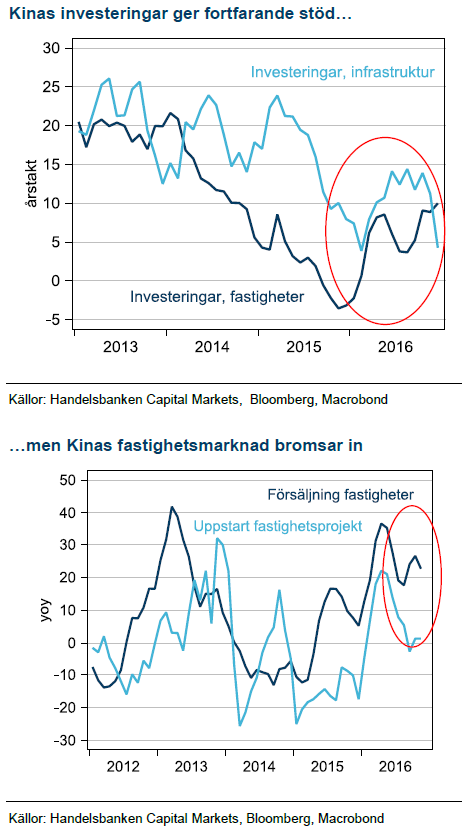
Fastighetsboomen i Kina fortsätter trots politikers insatser för att kyla rallyt. Cykeln har förlängts och har redan vida överträffat vår första bedömning av varaktigheten i Kinas minicykel. Den förra stimulansdrivna cykeln varade omkring 15 månader och det är precis så gammal den nuvarande är nu
Konsensus är fortfarande att aktiviteten ska bromsa kraftigt under hösten. Det är även vår huvudlinje men risken för en positiv överraskning från politiker som håller tillväxten under armarna är större den här gången.
Kopparstrejkerna är över
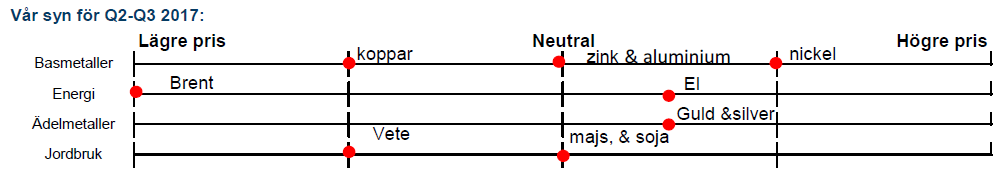
Vår tro på lägre pris för koppar under året kom på skam under första kvartalet när stora strejker i Chile och Peru förde en betydande del av produktionen ur marknaden. Nu är strejkerna lösta och produktionen växlar upp, därmed blir koppar åter ett derivat på Kinas aktivitet och vi tror att stigande produktion kommer öka prispressen nedåt. Därför behåller vi USD 5000 som riktmärke för priset.
Produktionsreformer i Kina
Aluminium har stigit i bakvattnet av Kinas policyförändring kring produktion av aluminium, stål, kol och järnmalm. Till slut har Kina tagit krafttag och begränsar produktionen från de mindre och minst miljövänliga anläggningarna. Nettokapaciteten av aluminium växer dock fortfarande stadigt och på sikt skiftar Kina in i stabil lågkostandskostym som kommer pressa priserna. Ännu är vi inte där och vi tycker att senaste prisuppgången står på säker mark kommande halvår.
Zinkrallyt har planat ut
 Efter en makalös prisuppgång på nära 100% på ett år har zinkrallyt tappat kraft. Även om vi trott på högre priser hela vägen har kraften i uppgången överraskat oss. Från dagens nivåer är det svårt att motivera risk för ytterligare uppgång och vid slutet av året borde ökad småskalig produktion göra avtryck i prispress.
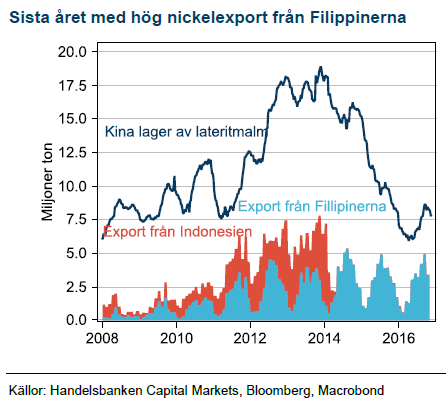
Nickelstoryn gick i kras
Våra högt ställda förväntningar på lägre export från Filipinerna håller på att förverkligas. Priserna tar dock inte fart eftersom Indonesien luckrar upp exportförbudet lagom till marknadsbalansen skulle stramas åt. Vi tror fortfarande på högre nickelpriser men Indonesien kommer sannolikt dämpa uppgångar likt zink.
Energi
 OPEC visade vägen
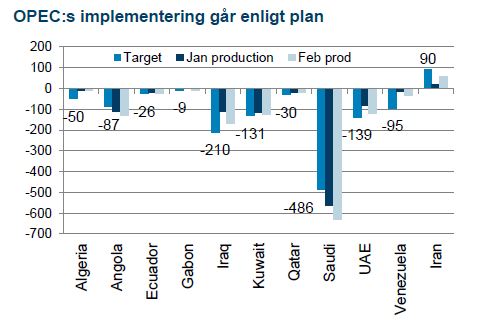
OPEC:s möte i Wien slutade med en skräll. Priset steg 10% på beskedet att gruppen nått ett avtal om att begränsa produktionen tillsammans med flera länder som inte är medlemmar i OPEC. Tre månader in i avtalet kan vi konstatera att genomförandet av produktionssänkningarna är bättre än historiskt. OPEC ligger nära 100% implementering och de övriga omkring 50%.
Fokus på nästa möte
Med halva avtalsperioden bakom oss ligger nu fokus på huruvida OPEC ska förlänga avtalet den 25e maj. Bloomberg genomförde en undersökning som visade att 13 av 13 tillfrågade oljeanalytiker tror att OPEC ska förlänga avtalet. Mycket tyder därför på att det scenariot redan är inprisat och att oljepriset inte borde stiga speciellt mycket mer på det temat, trots OPEC:s alla utspel.
 Vi tror snarare att risken att det inte blir en förlängning är en intressant möjlighet. Med en så enhetlig förväntansbild kan ett enskilt lands motstånd till en förlängning av avtalet bli tuvan som stjälper hela lasset. Ryssland kanske motsätter sig fortsatt understöd till en snabbt ökande oljeproduktion hos de amerikanska skifferproducenterna. Övriga medlemmar kanske kräver att Iran nu ska vara med eller så önskar Irak att avsluta. Irak har de mest ambitiösa planerna på att expandera produktionen och därmed minst att vinna på att sitta kvar i avtalet.
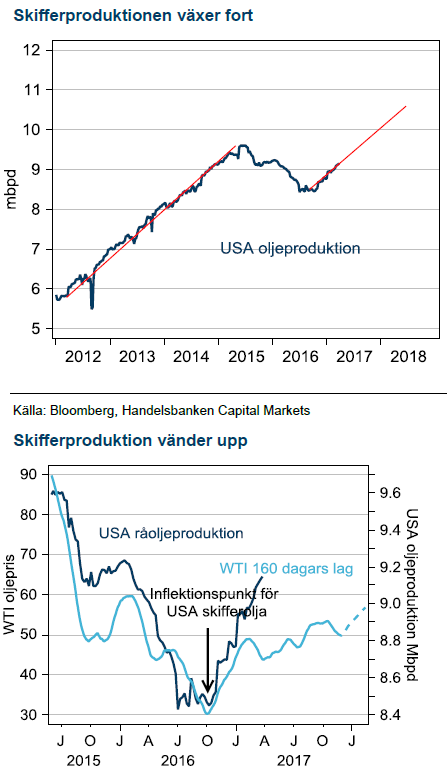
Skifferoljan är vinnare
Skifferoljan är tillbaka i samma tillväxttakt som uppvisades omkring USD 100/fat. Den snabba tillväxten på dagens priser gör OPEC:s strategi omöjlig i längden. OPEC kan möjligen förlänga avtalet i maj men efter den perioden kommer alla länder återgå till jakten på marknadsandelar och priset kommer komma under press. Vi har därför USD 40 som medelpris för 2017.
Elpriset utan volatilt
Efter en turbulent avslutning på förra året har ännu en mild vinter skapat ett stabilt elpris på relativt låga nivåer. Kolprisbubblan, inflaterad av Kina, har spruckit och minskar risken för de toppar som etablerades för årsskiftet.
Ädelmetaller
 Guldet får revansch
Fed kommer att fortsätta med en stramare penningpolitik även om fokus i USA kommer att tiltas mot den kommande finanspolitiken. Guld har redan handlat in den effekten och all form av besvikelse på Trump kommer gynna guld.
Fed har succesivt blivit tydligare och mars månads höjning med 25bps var redan 100% prisad inför mötet, nyheten framöver ligger i eventuell förändrad prognos för räntebana. För 2017 har Fed ytterligare två höjningar och för 2018 tre.
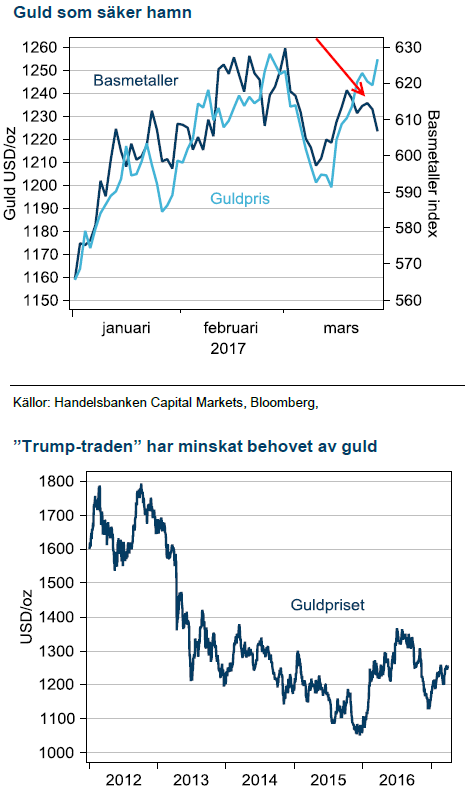
Trumps huvudvärk kan bli guldets gnista
Efter en initial press på guld efter amerikanska presidentvalet har guld börjat visa sig känsligt för Trumps motgångar. Ännu har testen av Trumps möjligheter att genomföra expansiv politik bara börjat. Minsta tecken på motgång har dock stärkt guld och vid ett större debakel kommer säkerligen efterfrågan på guld som säker hamn att återuppstå.
Jordbruk
Viktigaste USDA rapporten
 Mars kvartalsrapport från USDA visar visserligen bara data för USA men det är den viktigaste marknaden för årets prisutveckling. I USA vann tveklöst sojaböner kampen om odlingsareal när anspråken ökar med 7,3% mot förra odlingsåret. Majsarealen blev något mindre än förväntat och därför föll sojapriset mest på rapporten. Fjolårets sojaskörd visade god avkastning och i kombination med bra priser i förhållandet till majs fanns alla incitament att öka arealen i år. Rebalanseringen av USA:s lager fortsätter därmed då vetearealen minskas som en följd av låga priser. Vi ser inte den lägre arealen i USA som ett skäl till högre pris. Det krävs sämre skörd som följd av dålig avkastning för att priserna ska stiga.
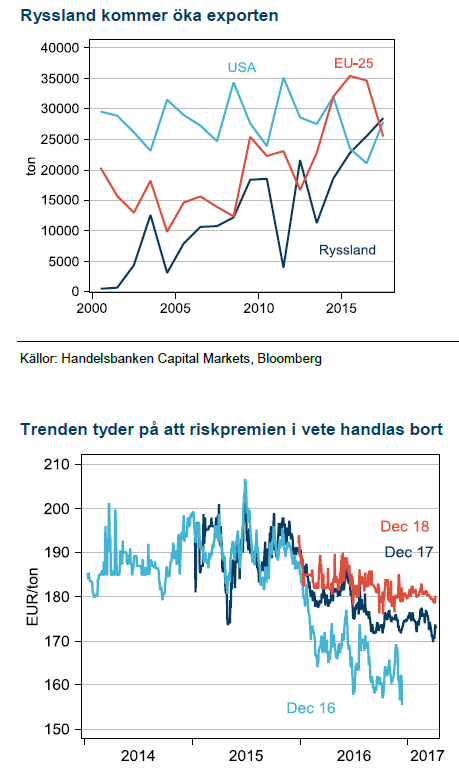
Risk för hög rysk export Förra året blev Rysslands höga veteexport ett sänke för MATIF-priserna. Vi ser risk för en repris i år. Vi har en tro på lägre oljepris och Putin har parerat lägre oljepriser med svagare rubel under de senaste åren. Amerikanska centralbanken fortsätter höja räntan och det ger USD stöd. Således tror vi att Ryssland kommer fortsätta ta marknadsandelar på exportmarknaden från USA vilket pressar även europeiskt vete. Senaste åren har vi sett en tydlig trend där veteterminer handlas med en riskpremie för dåligt väder och när skörden sedan kommer in på normala nivåer pyser riskpremien ur. Baserat på detta resonemang tror vi att december 17 kommer gå till förfall omkring EUR 160/ton.
Rapspremien
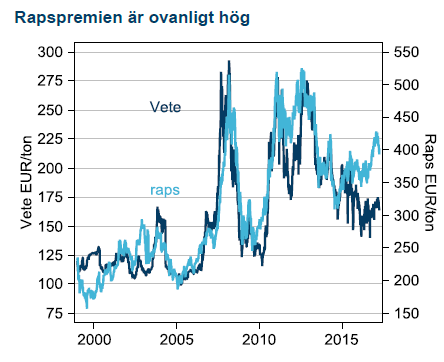 Högre oljepris och vissa väderproblem i Europa och Ukraina fick rapspriset att stiga oväntat under förra odlingsåret. Vi ser starka skäl för den ovanligt höga premien över vete att suddas ut under året. Främsta skälet är att vi tror på lägre oljepris, andra skälet att USA sannolikt kommer leverera en rekordskörd av soja och tredje skälet att en normal skörd i Europa kommer sänka rapspriset. Raps är därmed den gröda där vi ser störst anledning att sälja terminer och tror att november 17 slutar på omkring 320 EUR/ton 15 % under dagens nivå.
[box]Producerat av Handelsbanken och publiceras i samarbete och med tillstånd på Råvarumarknaden.se[/box]
Ansvarsbegränsning
Detta material är producerat av Svenska Handelsbanken AB (publ) i fortsättningen kallad Handelsbanken. De som arbetar med innehållet är inte analytiker och materialet är inte oberoende investeringsanalys. Innehållet är uteslutande avsett för kunder i Sverige. Syftet är att ge en allmän information till Handelsbankens kunder och utgör inte ett personligt investeringsråd eller en personlig rekommendation. Informationen ska inte ensamt utgöra underlag för investeringsbeslut. Kunder bör inhämta råd från sina rådgivare och basera sina investeringsbeslut utifrån egen erfarenhet.
Informationen i materialet kan ändras och också avvika från de åsikter som uttrycks i oberoende investeringsanalyser från Handelsbanken. Informationen grundar sig på allmänt tillgänglig information och är hämtad från källor som bedöms som tillförlitliga, men riktigheten kan inte garanteras och informationen kan vara ofullständig eller nedkortad. Ingen del av förslaget får reproduceras eller distribueras till någon annan person utan att Handelsbanken dessförinnan lämnat sitt skriftliga medgivande. Handelsbanken ansvarar inte för att materialet används på ett sätt som strider mot förbudet mot vidarebefordran eller offentliggörs i strid med bankens regler.


The latest weekly report from the US DOE showed a substantial drawdown across key petroleum categories, adding more upside potential to the fundamental picture.

Commercial crude inventories (excl. SPR) fell by 5.8 million barrels, bringing total inventories down to 415.1 million barrels. Now sitting 11% below the five-year seasonal norm and placed in the lowest 2015-2022 range (see picture below).
Product inventories also tightened further last week. Gasoline inventories declined by 2.1 million barrels, with reductions seen in both finished gasoline and blending components. Current gasoline levels are about 3% below the five-year average for this time of year.
Among products, the most notable move came in diesel, where inventories dropped by almost 4.1 million barrels, deepening the deficit to around 20% below seasonal norms – continuing to underscore the persistent supply tightness in diesel markets.
The only area of inventory growth was in propane/propylene, which posted a significant 5.1-million-barrel build and now stands 9% above the five-year average.
Total commercial petroleum inventories (crude plus refined products) declined by 4.2 million barrels on the week, reinforcing the overall tightening of US crude and products.


A classic case of “buy the rumor, sell the news” played out in oil markets, as Brent crude has dropped sharply – down nearly USD 10 per barrel since yesterday evening – following Iran’s retaliatory strike on a U.S. air base in Qatar. The immediate reaction was: “That was it?” The strike followed a carefully calibrated, non-escalatory playbook, avoiding direct threats to energy infrastructure or disruption of shipping through the Strait of Hormuz – thus calming worst-case fears.
After Monday morning’s sharp spike to USD 81.4 per barrel, triggered by the U.S. bombing of Iranian nuclear facilities, oil prices drifted sideways in anticipation of a potential Iranian response. That response came with advance warning and caused limited physical damage. Early this morning, both the U.S. President and Iranian state media announced a ceasefire, effectively placing a lid on the immediate conflict risk – at least for now.
As a result, Brent crude has now fallen by a total of USD 12 from Monday’s peak, currently trading around USD 69 per barrel.
Looking beyond geopolitics, the market will now shift its focus to the upcoming OPEC+ meeting in early July. Saudi Arabia’s decision to increase output earlier this year – despite falling prices – has drawn renewed attention considering recent developments. Some suggest this was a response to U.S. pressure to offset potential Iranian supply losses.
However, consensus is that the move was driven more by internal OPEC+ dynamics. After years of curbing production to support prices, Riyadh had grown frustrated with quota-busting by several members (notably Kazakhstan). With Saudi Arabia cutting up to 2 million barrels per day – roughly 2% of global supply – returns were diminishing, and the risk of losing market share was rising. The production increase is widely seen as an effort to reassert leadership and restore discipline within the group.
That said, the FT recently stated that, the Saudis remain wary of past missteps. In 2018, Riyadh ramped up output at Trump’s request ahead of Iran sanctions, only to see prices collapse when the U.S. granted broad waivers – triggering oversupply. Officials have reportedly made it clear they don’t intend to repeat that mistake.
The recent visit by President Trump to Saudi Arabia, which included agreements on AI, defense, and nuclear cooperation, suggests a broader strategic alignment. This has fueled speculation about a quiet “pump-for-politics” deal behind recent production moves.
Looking ahead, oil prices have now retraced the entire rally sparked by the June 13 Israel–Iran escalation. This retreat provides more political and policy space for both the U.S. and Saudi Arabia. Specifically, it makes it easier for Riyadh to scale back its three recent production hikes of 411,000 barrels each, potentially returning to more moderate increases of 137,000 barrels for August and September.
In short: with no major loss of Iranian supply to the market, OPEC+ – led by Saudi Arabia – no longer needs to compensate for a disruption that hasn’t materialized, especially not to please the U.S. at the cost of its own market strategy. As the Saudis themselves have signaled, they are unlikely to repeat previous mistakes.
Conclusion: With Brent now in the high USD 60s, buying oil looks fundamentally justified. The geopolitical premium has deflated, but tensions between Israel and Iran remain unresolved – and the risk of missteps and renewed escalation still lingers. In fact, even this morning, reports have emerged of renewed missile fire despite the declared “truce.” The path forward may be calmer – but it is far from stable.
Analys
A muted price reaction. Market looks relaxed, but it is still on edge waiting for what Iran will do
Brent crossed the 80-line this morning but quickly fell back assigning limited probability for Iran choosing to close the Strait of Hormuz. Brent traded in a range of USD 70.56 – 79.04/b last week as the market fluctuated between ”Iran wants a deal” and ”US is about to attack Iran”. At the end of the week though, Donald Trump managed to convince markets (and probably also Iran) that he would make a decision within two weeks. I.e. no imminent attack. Previously when when he has talked about ”making a decision within two weeks” he has often ended up doing nothing in the end. The oil market relaxed as a result and the week ended at USD 77.01/b which is just USD 6/b above the year to date average of USD 71/b.

Brent jumped to USD 81.4/b this morning, the highest since mid-January, but then quickly fell back to a current price of USD 78.2/b which is only up 1.5% versus the close on Friday. As such the market is pricing a fairly low probability that Iran will actually close the Strait of Hormuz. Probably because it will hurt Iranian oil exports as well as the global oil market.
It was however all smoke and mirrors. Deception. The US attacked Iran on Saturday. The attack involved 125 warplanes, submarines and surface warships and 14 bunker buster bombs were dropped on Iranian nuclear sites including Fordow, Natanz and Isfahan. In response the Iranian Parliament voted in support of closing the Strait of Hormuz where some 17 mb of crude and products is transported to the global market every day plus significant volumes of LNG. This is however merely an advise to the Supreme leader Ayatollah Ali Khamenei and the Supreme National Security Council which sits with the final and actual decision.
No supply of oil is lost yet. It is about the risk of Iran closing the Strait of Hormuz or not. So far not a single drop of oil supply has been lost to the global market. The price at the moment is all about the assessed risk of loss of supply. Will Iran choose to choke of the Strait of Hormuz or not? That is the big question. It would be painful for US consumers, for Donald Trump’s voter base, for the global economy but also for Iran and its population which relies on oil exports and income from selling oil out of that Strait as well. As such it is not a no-brainer choice for Iran to close the Strait for oil exports. And looking at the il price this morning it is clear that the oil market doesn’t assign a very high probability of it happening. It is however probably well within the capability of Iran to close the Strait off with rockets, mines, air-drones and possibly sea-drones. Just look at how Ukraine has been able to control and damage the Russian Black Sea fleet.
What to do about the highly enriched uranium which has gone missing? While the US and Israel can celebrate their destruction of Iranian nuclear facilities they are also scratching their heads over what to do with the lost Iranian nuclear material. Iran had 408 kg of highly enriched uranium (IAEA). Almost weapons grade. Enough for some 10 nuclear warheads. It seems to have been transported out of Fordow before the attack this weekend.
The market is still on edge. USD 80-something/b seems sensible while we wait. The oil market reaction to this weekend’s events is very muted so far. The market is still on edge awaiting what Iran will do. Because Iran will do something. But what and when? An oil price of 80-something seems like a sensible level until something do happen.


USA ska införa 50 procent tull på koppar

Ryska staten siktar på att konfiskera en av landets största guldproducenter

Hur säkrar vi Sveriges tillgång till kritiska metaller och mineral i en ny geopolitisk verklighet?

Lundin Mining ska bli en av de tio största kopparproducenterna i världen

Sommarvädret styr elpriset i Sverige

Uppgången i oljepriset planade ut under helgen

Mahvie Minerals växlar spår – satsar fullt ut på guld

Låga elpriser i sommar – men mellersta Sverige får en ökning

Oljan, guldet och marknadens oroande tystnad

Jonas Lindvall är tillbaka med ett nytt oljebolag, Perthro, som ska börsnoteras
-
 Nyheter4 veckor sedan
Uppgången i oljepriset planade ut under helgen
-
 Nyheter3 veckor sedan
Mahvie Minerals växlar spår – satsar fullt ut på guld
-
 Nyheter4 veckor sedan
Låga elpriser i sommar – men mellersta Sverige får en ökning
-
 Nyheter2 veckor sedan
Oljan, guldet och marknadens oroande tystnad
-
 Nyheter2 veckor sedan
Jonas Lindvall är tillbaka med ett nytt oljebolag, Perthro, som ska börsnoteras
-
Analys4 veckor sedan
Very relaxed at USD 75/b. Risk barometer will likely fluctuate to higher levels with Brent into the 80ies or higher coming 2-3 weeks
-
Analys3 veckor sedan
A muted price reaction. Market looks relaxed, but it is still on edge waiting for what Iran will do
-

 Nyheter2 veckor sedan
Domstolen ger klartecken till Lappland Guldprospektering