

Analys
Handelsbanken Jordbruk, 22 augusti 2014

Skörd 2015
Spannmålspriserna har gått ned en hel del under det gångna året – en följd av globala rekordskördar på alla de tre stora grödorna vete, majs och sojabönor. Även 2013 var volymmässigt ett bra skördeår och 2014 blir andra året på raken med relativt stor lageruppbyggnad. Vete MATIF november 14 handlas i skrivande stund på EUR 171 (SEK 1.565) per ton – så sent som i april i år var samma kontrakt uppe på EUR 210 (SEK 1.985) per ton. Under 2013 handlades november 14-kontraktet stundtals ännu högre.
Vad vi upplever just nu är att lantbrukare som för nästa års skörd istället köper på termin (spekulerar i en prisuppgång och ökar sin risk) till antalet är klart fler än de lantbrukare som säljer på termin (skyddar sig mot ytterligare prisfall). Om det var djurproducenter som prissäkrade kommande foderinköp vore det mer förståeligt – men så är inte fallet, få av dessa har vaknat på samma sätt. Om denna riskvilja lönar sig vet ingen, främst bör det bero på huruvida väderproblem uteblir i världens större spannmålsregioner även under 2015 eller ej – om inte finns det skäl att tro att priserna kan pressas ytterligare nedåt.
Grafen nedan visar närmsta rullande termin på MATIF för de senaste tio åren – med tre väldigt tydliga pristoppar, intressant nog alla på nästan samma nivå.
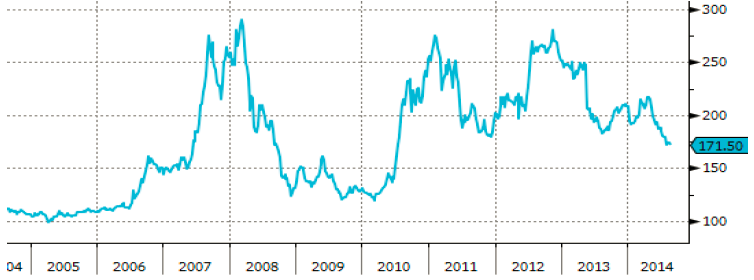
- 2006-07 ökade spannmålspriserna kraftigt som följd av minskad global produktion i kombination med ökad efterfrågan inte minst som energigröda.
- Efter att vete MATIF handlats ned mot EUR 120 per ton fick vi sommaren 2010 återigen en kraftig prisuppgång – värme och torka gjorde att ryska vetefält praktiskt taget brann upp, varpå Ryssland senare införde exportförbud av spannmål i syfte att dämpa inhemsk inflation.
- 2012 blev allt annat än problemfritt – Ryssland fick ännu lägre veteskörd än 2010, den amerikanska majsen upplevde den värsta torkan på över 50 år och jämfört med året innan föll produktionen i varierande grad i Europa, Australien och Sydamerika.
Kort sagt – vi har de senaste åren haft kraftiga prisuppgångar och även ett högt genomsnittspris men inte utan anledning.
Decemberterminen vete MATIF 2015 handlas just nu kring EUR 186 (SEK 1.705) per ton – en nivå som alltså verkar locka mer till köp än sälj även för producenter. Med ögonen på ovanstående vetegraf, med klart lägre nivåer bara för några få år sedan, kan det ses som förvånande att riskviljan är så stor. Märk väl att Handelsbankens vy inte är att priserna ska falla ytterligare, vi håller för tillfället en neutral vy i väntan på mer prognoser om höstsådden och potential för nästa års skörd men också i en tid av hög politisk oro där utfallet är svårt att sia om. Däremot är vi väldigt säkra på att risken för ytterligare prisfall åtminstone existerar.
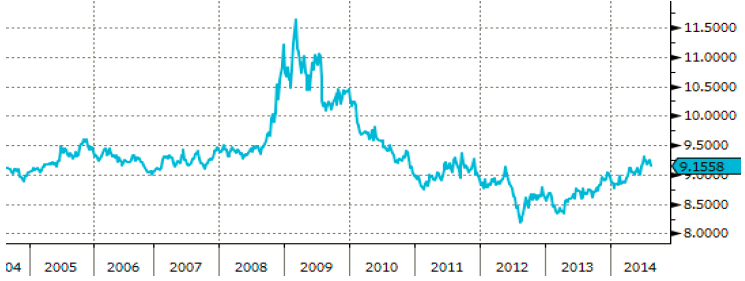
Vad man heller inte bör bortse från är att EUR/SEK under perioden med låga spannmålspriser kring 2009 stundtals handlades bra mycket högre än idag, se graf nedan. En svag svensk krona i förhållande till euron gynnar svenska spannmålspriser och givetvis tvärtom. Handelsbankens prognos för EUR/SEK under det fjärde kvartalet 2015 är 8,75 – ganska väl i linje med de europeiska storbankernas snittprognos. Faller dessa prognoser in bör det alltså pressa ned svenska inhemska spannmålspriser.
Det är bråda dagar för landets spannmålsbönder, årets skörd är långt ifrån klar på många håll i landet – tyvärr med stora nederbördsrelaterade problem i inte minst i Halland och Västergötland. Och efter skörd ska det sås. Ändock kan det finnas skäl att, om inte annat när regnet faller och tröskan står stilla, fundera på hur riskerna kring nästa års skörd ska hanteras. Är verkligen dessa EUR 186 (SEK 1.705) per ton för lågt för att sälja ens en liten del? Kanske är säljoptioner intressant i detta läge – med vilka ett skydd mot fallande priser ges samtidigt som möjlighet att ta del av eventuell uppsida finns kvar. På nästföljande sidor följer några exempel med säljoptioner vete MATIF september 2015 för den som är intresserad.
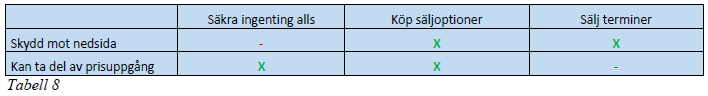
Säljoptioner ger ibland ett bättre utfall än terminer och ibland tvärtom. Då produktionsnivån inte är helt säker bör heller inte hela volymen prissäkras. En kombination av dessa tre val är kanske det rätta. En tredjedel i varje är ett möjligt alternativ – med då två tredjedelar skyddat mot prisfall och två tredjedelar med möjlighet till att ta del av prisuppgång.
Säljoptioner
En säljoption ger innehavaren en rättighet men inte en skyldighet att få sälja underliggande termin* till en viss förbestämd prisnivå (lösenpris) – vilket innebär att om terminspriset handlas över lösenpriset utnyttjar innehavaren inte sin säljoption och kan istället dra nytta av ett högre försäljningspris för fysisk vara. Ett köp av en option kommer aldrig kosta köparen mer än kostnaden för optionen, den s.k. premien.
*Vid affär med Handelsbanken hanterar banken försäljning och köp på börsen och betalar mellanskillnaden direkt till kund.
Följande visar exempel på möjligheter inför skörd 2015:
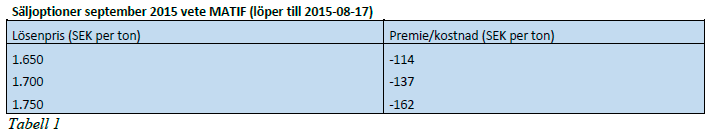
Lösenpriset kan köparen välja själv och kan således vara både högre och lägre än i ovanstående exempel. Som synes kommer premien variera efter valt lösenpris – en säljoption med ett högre lösenpris kostar mer än en säljoption med ett lägre lösenpris. Oavsett lösenpris finns inga fasta nivåer på premien utan dessa beräknas vid varje affärstillfälle då nivån på dessa även är beroende av främst löptid och volatiliteten på underliggande terminskontrakt. Löptiden är nu relativt lång, men allt annat lika blir alltså dessa optioner billigare med tiden.
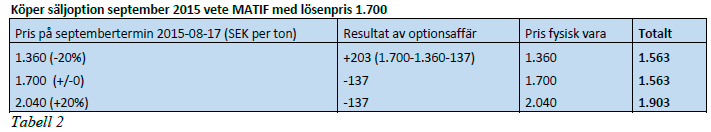
Antag att en lantbrukare köper den säljoption som i exemplet ovan har lösenpriset SEK 1.700 per ton och betalar premien SEK 137 per ton. Utfallet av denna affär om optionen behålls till förfallodatum blir då som följer utifrån några olika scenarion – vetepriset faller 20 procent, förblir oförändrat eller stiger 20 procent:
Vi antar i dessa exempel ett fysiskt vetepris som är exakt i nivå med terminspriset på MATIF.
Det kan tilläggas att köparen av en säljoption kan välja att sälja tillbaka optionen när som helst innan löptidens slut, alltså i detta fall innan den 17:e augusti.
Huruvida säljoptioner är ett mer attraktivt instrument att skydda sig mot ett prisfall än terminer finns det inget stående svar på, det varierar inte minst utifrån rådande prisnivå – dels på vetet och dels på prmien. I ovanstående utfall vore terminer en bättre lösning då priset föll och då priset var oförändrat – givetvis som följd av kostnaden för premien. Men när priset stiger kan en säljoption alltså bli ett klart mer fördelaktigt val, utan av ge avkall på skydd mot nedsida.
Om lantbrukaren tycker att premien i ovanstående exempel är dyr kan en option med ett lägre lösenpris väljas. Nedanstående tabell visar utfallet med samma tre scenarion som ovan om säljoptionen med lösenpriset SEK 1.650 per ton valts:
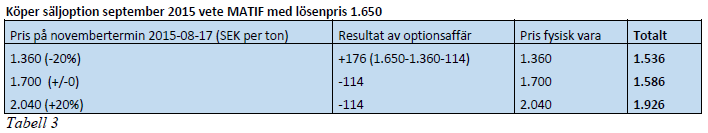
Som vi ser blev resultatet här något bättre i de fall då priset förblev oförändrat eller steg – som följd av att premien i detta fall var lägre med SEK 114 mot SEK 137. Dock var inte skyddet mot ett prisfall lika starkt, p.g.a. ett lägre lösenpris, och utfallet då priset föll blev alltså sämre.
Fördelen med att istället välja ett högre lösenpris är att skyddet mot nedsidan blir starkare – dock till en högre kostnad. Nedanstående tabell visar utfallet för den dyraste av säljoptionerna av de tre alternativen i tabell 1, den med lösenpriset SEK 1.750 per ton.
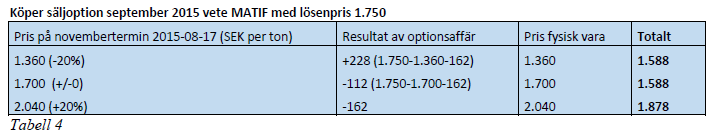
Som synes gav ett högre lösenpris med tillhörande högre premie ett bättre resultat när priset föll på bekostnad av en mer begränsad uppsida.
[box]Handelsbanken Jordbruk är producerat av Handelsbanken och publiceras i samarbete och med tillstånd på Råvarumarknaden.se[/box]
Ansvarsbegränsning
Detta material är producerat av Svenska Handelsbanken AB (publ) i fortsättningen kallad Handelsbanken. De som arbetar med innehållet är inte analytiker och materialet är inte oberoende investeringsanalys. Innehållet är uteslutande avsett för kunder i Sverige. Syftet är att ge en allmän information till Handelsbankens kunder och utgör inte ett personligt investeringsråd eller en personlig rekommendation. Informationen ska inte ensamt utgöra underlag för investeringsbeslut. Kunder bör inhämta råd från sina rådgivare och basera sina investeringsbeslut utifrån egen erfarenhet.
Informationen i materialet kan ändras och också avvika från de åsikter som uttrycks i oberoende investeringsanalyser från Handelsbanken. Informationen grundar sig på allmänt tillgänglig information och är hämtad från källor som bedöms som tillförlitliga, men riktigheten kan inte garanteras och informationen kan vara ofullständig eller nedkortad. Ingen del av förslaget får reproduceras eller distribueras till någon annan person utan att Handelsbanken dessförinnan lämnat sitt skriftliga medgivande. Handelsbanken ansvarar inte för att materialet används på ett sätt som strider mot förbudet mot vidarebefordran eller offentliggörs i strid med bankens regler.


Rebounding along with most markets. But concerns over solidity of Gaza peace may also contribute. Brent crude fell 0.8% yesterday to $61.91/b and its lowest close since May this year. This morning it is bouncing up 0.9% to $62.5/b along with a softer USD amid positive sentiment with both equities and industrial metals moving higher. Concerns that the peace in Gaza may be less solid than what one might hope for also yields some support to Brent. Bets on tech stocks are rebounding, defying fears of trade war. Money moving back into markets. Gold continues upwards its strong trend and a softer dollar helps it higher today as well.

US crude & products probably rose 5.6 mb last week (API) versus a normal seasonal decline of 2.4 mb. The US API last night partial and thus indicative data for US oil inventories. Their data indicates that US crude stocks rose 7.4 mb last week, gasoline stocks rose 3.0 mb while Distillate stocks fell 4.8 mb. Altogether an increase in commercial crude and product stocks of 5.6 mb. Commercial US crude and product stocks normally decline by 2.4 mb this time of year. So seasonally adjusted the US inventories rose 8 mb last week according to the indicative numbers by the API. That is a lot. Also, the counter seasonal trend of rising stocks versus normally declining stocks this time of year looks on a solid pace of continuation. If the API is correct then total US crude and product stocks would stand 41 mb higher than one year ago and 6 mb higher than the 2015-19 average. And if we combine this with our knowledge of a sharp increase in production and exports by OPEC(+) and a large increase in oil at sea, then the current trend in US oil inventories looks set to continue. So higher stocks and lower crude oil prices until OPEC(+) switch to cuts. Actual US oil inventory data today at 18:00 CET.
US commercial crude and product stocks rising to 1293 mb in week 41 if last nights indicative numbers from API are correct.

Crude oil soon coming to a port near you. OPEC has lifted production sharply higher this autumn. At the same time demand for oil in the Middle-East has fallen as we have moved out of summer heat and crude oil burn for power for air-conditioning. The Middle-East oil producers have thus been able to lift exports higher on both accounts. Crude oil and condensates on water has shot up by 177 mb since mid-August. This oil is now on its way to ports around the world. And when they arrive, it will likely help to lift stocks onshore higher. That is probably when we will lose the last bit of front-end backwardation the the crude oil curves. That will help to drive the front-month Brent crude oil price down to the $60/b line and revisit the high $50ies/b. Then the eyes will be all back on OPEC+ when they meet in early November and then again in early December.
Crude oil and condensates at sea have moved straight up by 177 mb since mid-August as OPEC(+) has produced more, consumed less and exported more.

When it starts to move lower it moves rather quickly. Gaza, China, IEA. Brent crude is down 2.1% today to $62/b after having traded as high as $66.58/b last Thursday and above $70/b in late September. The sell-off follows the truce/peace in Gaze, a flareup in US-China trade and yet another bearish oil outlook from the IEA.
A lasting peace in Gaze could drive crude oil at sea to onshore stocks. A lasting peace in Gaza would probably calm down the Houthis and thus allow more normal shipments of crude oil to sail through the Suez Canal, the Red Sea and out through the Bab-el-Mandeb Strait. Crude oil at sea has risen from 48 mb in April to now 91 mb versus a pre-Covid normal of about 50-60 mb. The rise to 91 mb is probably the result of crude sailing around Africa to be shot to pieces by the Houthis. If sailings were to normalize through the Suez Canal, then it could free up some 40 mb in transit at sea moving onshore into stocks.
The US-China trade conflict is of course bearish for demand if it continues.
Bearish IEA yet again. Getting closer to 2026. Credibility rises. We expect OPEC to cut end of 2025. The bearish monthly report from the IEA is what it is, but the closer we get to 2026, the more likely the IEA is of being ball-park right in its outlook. In its monthly report today the IEA estimates that the need for crude oil from OPEC in 2026 will be 25.4 mb/d versus production by the group in September of 29.1 mb/d. The group thus needs to do some serious cutting at the end of 2025 if it wants to keep the market balanced and avoid inventories from skyrocketing. Given that IEA is correct that is. We do however expect OPEC to implement cuts to avoid a large increase in inventories in Q1-26. The group will probably revert to cuts either at its early December meeting when they discuss production for January or in early January when they discuss production for February. The oil price will likely head yet lower until the group reverts to cuts.
Dubai: The Mid-East anchor dragging crude oil lower. Surplus emerging in Mid-East pricing. Crude oil prices held surprisingly strong all through the summer. A sign and a key source of that strength came from the strength in the front-end backwardation of the Dubai crude oil curve. It held out strong from mid-June and all until late September with an average 1-3mth time-spread premium of $1.8/b from mid-June to end of September. The 1-3mth time-spreads for Brent and WTI however were in steady deterioration from late June while their flat prices probably were held up by the strength coming from the Persian Gulf. Then in late September the strength in the Dubai curve suddenly collapsed. Since the start of October it has been weaker than both the Brent and the WTI curves. The Dubai 1-3mth time-spread now only stands at $0.25/b. The Middle East is now exporting more as it is producing more and also consuming less following elevated summer crude burn for power (Aircon) etc.
The only bear-element missing is a sudden and solid rise in OECD stocks. The only thing that is missing for the bear-case everyone have been waiting for is a solid, visible rise in OECD stocks in general and US oil stocks specifically. So watch out for US API indications tomorrow and official US oil inventories on Thursday.
No sign of any kind of fire-sale of oil from Saudi Arabia yet. To what we can see, Saudi Arabia is not at all struggling to sell its oil. It only lowered its Official Selling Prices (OSPs) to Asia marginally for November. A surplus market + Saudi determination to sell its oil to the market would normally lead to a sharp lowering of Saudi OSPs to Asia. Not yet at least and not for November.
The 5yr contract close to fixed at $68/b. Of importance with respect to how far down oil can/will go. When the oil market moves into a surplus then the spot price starts to trade in a large discount to the 5yr contract. Typically $10-15/b below the 5yr contract on average in bear-years (2009, 2015, 2016, 2020). But the 5yr contract is usually pulled lower as well thus making this approach a moving target. But the 5yr contract price has now been rock solidly been pegged to $68/b since 2022. And in the 2022 bull-year (Brent spot average $99/b), the 5yr contract only went to $72/b on average. If we assume that the same goes for the downside and that 2026 is a bear-year then the 5yr goes to $64/b while the spot is trading at a $10-15/b discount to that. That would imply an average spot price next year of $49-54/b. But that is if OPEC doesn’t revert to cuts and instead keeps production flowing. We think OPEC(+) will trim/cut production as needed into 2026 to prevent a huge build-up in global oil stocks and a crash in prices. But for now we are still heading lower. Into the $50ies/b.
Some rebound but not much. Brent crude rebounded 1.5% yesterday to $65.47/b. This morning it is inching 0.2% up to $65.6/b. The lowest close last week was on Thursday at $64.11/b.
The curve structure is almost as week as it was before the weekend. The rebound we now have gotten post the message from OPEC+ over the weekend is to a large degree a rebound along the curve rather than much strengthening at the front-end of the curve. That part of the curve structure is almost as weak as it was last Thursday.
We are still on a weakening path. The message from OPEC+ over the weekend was we are still on a weakening path with rising supply from the group. It is just not as rapidly weakening as was feared ahead of the weekend when a quota hike of 500 kb/d/mth for November was discussed.
The Brent curve is on its way to full contango with Brent dipping into the $50ies/b. Thus the ongoing weakening we have had in the crude curve since the start of the year, and especially since early June, will continue until the Brent crude oil forward curve is in full contango along with visibly rising US and OECD oil inventories. The front-month Brent contract will then flip down towards the $60/b-line and below into the $50ies/b.
At what point will OPEC+ turn to cuts? The big question then becomes: When will OPEC+ turn around to make some cuts? At what (price) point will they choose to stabilize the market? Because for sure they will. Higher oil inventories, some more shedding of drilling rigs in US shale and Brent into the 50ies somewhere is probably where the group will step in.
There is nothing we have seen from the group so far which indicates that they will close their eyes, let the world drown in oil and the oil price crash to $40/b or below.
The message from OPEC+ is also about balance and stability. The world won’t drown in oil in 2026. The message from the group as far as we manage to interpret it is twofold: 1) Taking back market share which requires a lower price for non-OPEC+ to back off a bit, and 2) Oil market stability and balance. It is not just about 1. Thus fretting about how we are all going to drown in oil in 2026 is totally off the mark by just focusing on point 1.
When to buy cal 2026? Before Christmas when Brent hits $55/b and before OPEC+ holds its last meeting of the year which is likely to be in early December.
Brent crude oil prices have rebounded a bit along the forward curve. Not much strengthening in the structure of the curve. The front-end backwardation is not much stronger today than on its weakest level so far this year which was on Thursday last week.

The front-end backwardation fell to its weakest level so far this year on Thursday last week. A slight pickup yesterday and today, but still very close to the weakest year to date. More oil from OPEC+ in the coming months and softer demand and rising inventories. We are heading for yet softer levels.


Crude oil soon coming to a port near you

Guld och silver stiger hela tiden mot nya höjder
The Mid-East anchor dragging crude oil lower

Samtal om sällsynta jordartsmetaller, guld och silver

Brookfield köper bränsleceller för 5 miljarder USD av Bloom Energy för att driva AI-datacenter

OPEC+ missar produktionsmål, stöder oljepriserna

Ett samtal om guld, olja, fjärrvärme och förnybar energi

Guld nära 4000 USD och silver 50 USD, därför kan de fortsätta stiga
Are Ukraine’s attacks on Russian energy infrastructure working?

Goldman Sachs höjer prognosen för guld, tror priset når 4900 USD
-
 Nyheter3 veckor sedan
OPEC+ missar produktionsmål, stöder oljepriserna
-
 Nyheter3 veckor sedan
Ett samtal om guld, olja, fjärrvärme och förnybar energi
-
 Nyheter2 veckor sedan
Guld nära 4000 USD och silver 50 USD, därför kan de fortsätta stiga
-
Analys3 veckor sedan
Are Ukraine’s attacks on Russian energy infrastructure working?
-
 Nyheter1 vecka sedan
Goldman Sachs höjer prognosen för guld, tror priset når 4900 USD
-

 Nyheter2 veckor sedan
Blykalla och amerikanska Oklo inleder ett samarbete
-

 Nyheter3 veckor sedan
Guldpriset uppe på nya höjder, nu 3750 USD
-
Nyheter2 veckor sedan
Ett samtal om guld, olja, koppar och stål