

Analys
Den heliga treenigheten för 2017?

 Kina, Trump och OPEC
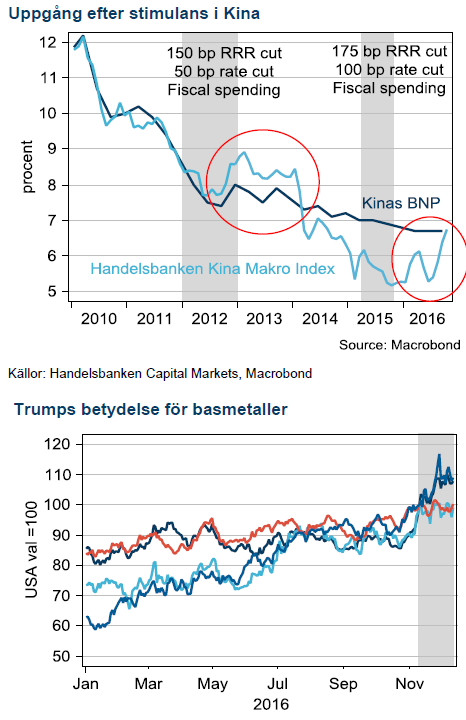
Under 2016 har tre starka drivkrafter utkristalliserats och drivit råvaror till bästa tillgångsslag med råvaruindex upp 30% i USD. För 2017 tror vi bara en mäktar med att överträffa förväntansbilden, det är inte Trump eller Kina –utan OPEC.
 OPEC överträffade förväntningarna
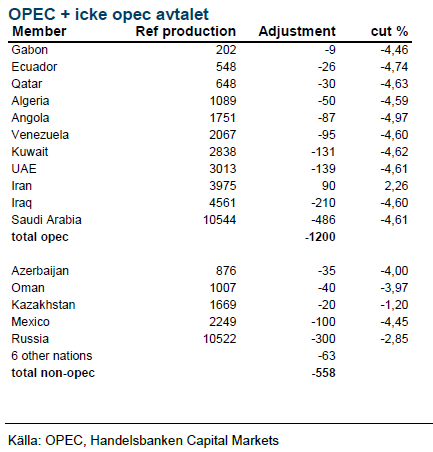
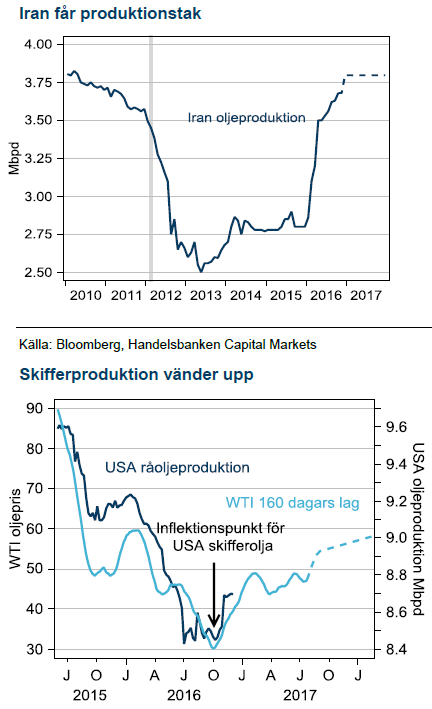
Det halvårsvisa OPEC-mötet i Wien gav ett styrkebesked från den slumrande kartellen. Ett paket med tre starka komponenter presenterades; produktionskvoter för varje medlemsland, tak för Iran och ett avtal med icke-OPEC, där Ryssland står för största sänkningen. Marknaden tvivlar på implementeringen, historiskt har OPEC levererat 80% av avtalade sänkningar. Vi tror på OPEC den här gången och ser en oljemarknad i god balans under andra halvåret vilket leder till ett snittoljepris på USD 60 för 2017, en kraftig höjning från tidigare prognos på USD 40.
Kina +Trump = basmetaller
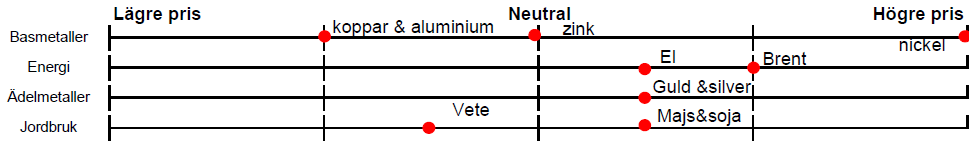
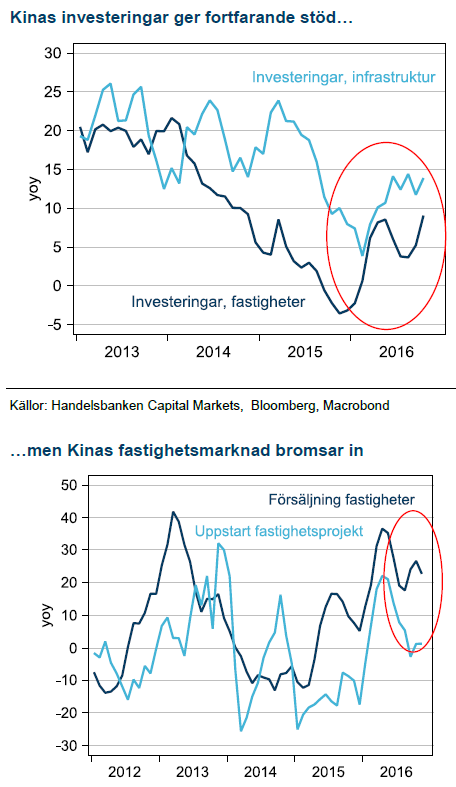
Kinas återhämtning det här året kommer från riktade stimulanser mot fastighetsmarknaden och infrastruktur under 2015. En gammal, välbeprövad metod som konsumerar mycket industriella metaller. Kina har nu börjat kyla ner fastighetsmarknaden vilket kommer att vara ledande för lägre tillväxttakt i investeringar i infrastruktur under 2017. Trumps tillträde som president kommer sannolikt öka förväntningarna ytterligare under Q1 men sedan finns det risk för besvikelse både i USA och Kina. Zink och nickel står starka i utbudssidan av prisekvationen medan koppar och aluminium kommer tyngas av hög produktion. Vi tror på ett högre medelpriser för alla basmetaller under 2017 jämfört med 16 men ser spotpriserna som väl höga för alla utom nickel.
Vår syn för Q1-Q2 2017:
Basmetaller
 Höga förhoppningar
Årets vändning i basmetaller kommer från de stimulanser Kina genomfört sedan 2015. Medicinen med riktad stimulans mot fastighetsmarknaden är effektiv och för med sig ökade investeringar i infrastruktur. De två viktigaste segmenten för efterfrågan på metaller. Medicinens biverkning är skenande fastighetspriser och en bostadsbubbla som kinesiska ledare måste se upp med. Det är därför inte förvånande att Kina börjat kyla fastighetsmarknaden, dessutom på precis samma nivå i ökningstakt som under den senaste cykeln, 2013.
Zink och nickel står starkt
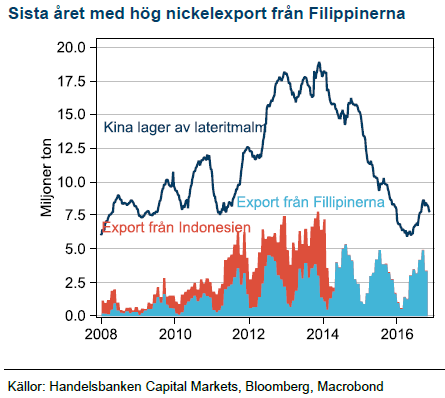
Vår tro på högre zink och nickelpriser har besannats, och av rätt skäl. Brist i marknadsbalansen efter stängda gruvor för zink, då flera stora är utbrutna och för nickel, efter miljöutvärderingen på Filippinerna. I Zink–priset har marknaden prisat in mycket förhoppningar på Trump och där finns nu en risk för besvikelse i kombination med allt fler kinesiska marginalproducenter som ökar produktionen vilket kan dämpa uppgången. Vi har USD 2700 som medelpris för 2017.
Nickelbristen får störst effekt i marknaden först under 2017 när höga lagernivåer betats av och Filipinernas lägre export gör avtryck. Vi fortsätter därför att tro på stigande priser med USD 13800 som medelpris för 2017.
Koppar och Aluminium i Trumps skottglugg
 De divergerande förutsättningarna för basmetaller på utbudssidan spelar fortfarande in. Fram till Trumps segertal handlades koppar i princip oförändrad i år, trots de starkaste stimulanserna i Kina sedan finanskrisen. Högre produktion från nya gruvor är förklaringen. Vi sätter därför en speciell varningsflagga för koppar på nedsidan när Kinas stimulanser rullar ut ur systemet, före det att Trump eventuellt kommer in under 2018, med ett medelpris på USD 5000.
Aluminium har stigit i bakvattnet av högre produktionskostnad när kol- och oljepriserna har gått upp. Marknadsbalansen är dock välförsörjd och marginalproduktion i Kina stiger samtidigt som kolprisbubblan spricker efter vintern. Vi tror på ett medelpris USD 1600 för 2017.
Energi
 OPEC visar vägen
OPEC:s officiella möte i Wien slutade med en skräll. Priset steg 10% på beskedet att gruppen nått ett avtal om att begränsa produktionen tillsammans med flera länder som inte är medlemmar i OPEC. Dessutom hittade man ett tak för Iran vilket tar bort mycket av risken i priset som fanns under 2016.
Saudiarabien är arkitekten
Saudiarabien är det land som har svårast att skära ner på utgifterna. Rädslan för Arabiska vårens uppror är påtaglig och att finansiera budgetunderskottet med högre skuldsättning kommer att bli allt svårare när utsikterna för oljepriset att återhämta sig falnar. Efter att de under två smärtsamma år försökt konkurrera ut högkostnadsproducenter, utan större framgång, väljer de nu att pröva en annan väg. På flera års sikt har den minimal prispåverkan men för de närmsta tolv månaderna blir skillnaden total när marknaden går i underskott och de prisdämpande lagernivåerna betas av.
Mycket ska bevisas
 Nu ska en bred konstellation av länder visa att de klarar av att sänka produktionen. Risken i avtalet ligger främst i Nigeria som tillåts öka, om de kan. Nigeria har potential att kompensera hela Rysslands sänkning. Den stora effekten i marknadsbalansen kommer först vid mitten av året när Saudiarabiens inhemska efterfrågan är högre och exporten måste bli lägre. Då har också Ryssland succesivt sänkt sin produktion.
Skifferoljan är vinnare
Norge, Kanada och USA:s marginalproducenter är de största vinnarna på avtalet. Länderna har jobbat hårt för att sänka produktionskostnaden under två år och behöver inte betala för det högre oljepriset. Vi tror på stark utveckling för skifferoljan givet 150-160 dagars eftersläpning till priset men det får oljepriset på fall först 2018 eftersom volymökningen med marginal äts upp av OPEC:s sänkning.
Elpriset åter volatilt
Sverige har den lägsta fyllnadsnivån i vattenmagasinen sedan 2002, lägre än elpristoppen 2010. En vinter något kallare än normalt räcker för att driva el till en mycket högre prisnivå.
Ädelmetaller
Guldet får revansch
Fed kommer att fortsätta med en stramare penningpolitik även om fokus i USA kommer att tiltas mot den kommande finanspolitiken. Guld har redan handlat in den effekten och all form av besvikelse på Trump kommer gynna guld.
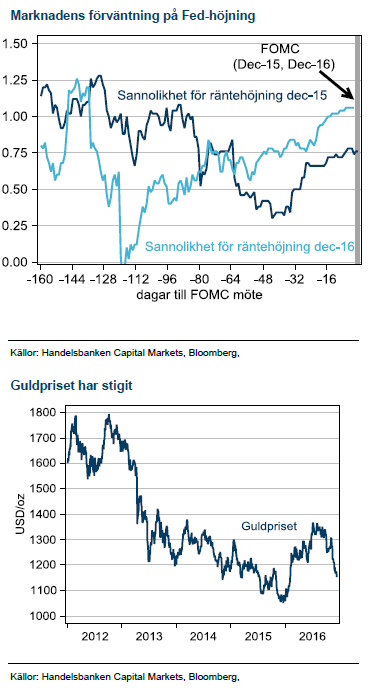 Fed har succesivt blivit tydligare och veckans höjning med 25bps var redan 100% prisad inför mötet, nyheten ligger i eventuell förändrad prognos för räntebana. För 2017 har Fed två höjningar och för 2018 tre.
Feds huvudvärk är guldets gnista
Efter en initial press på guld, sedan Fed startat sin räntehöjningscykel i december 2015, så fick guldet massor av drivkraft från att Fed och marknaden reviderade ner antalet räntehöjningar. Nu blev det till slut bara en höjning det här året, vid decembermötet.
Ingen repris nästa år
För 2017 ser vi inte en enkel repris av 2016. För ett år sedan trodde marknaden på fler höjningar under 2016 och det signalerade även Fed. Det kom ju sedan på skam och guldet glänste. Den här gången har Fed bara två höjning under 2017 och vi ser det som mycket mindre sannolikt att Fed reviderar ner räntebanan och därmed trigga en ny uppgång i guld.
För höga förväntningar
Istället ser vi en reversering i hela handelsmönstret efter Trumps segertal som en drivkraft till högre guldpriser. Mycket höga förhoppningar har prisats och guld har varit en förlorare i det spelet. Om vinden vänder kommer guld vara en vinnare.
Jordbruk
 Lagercykeln har toppat
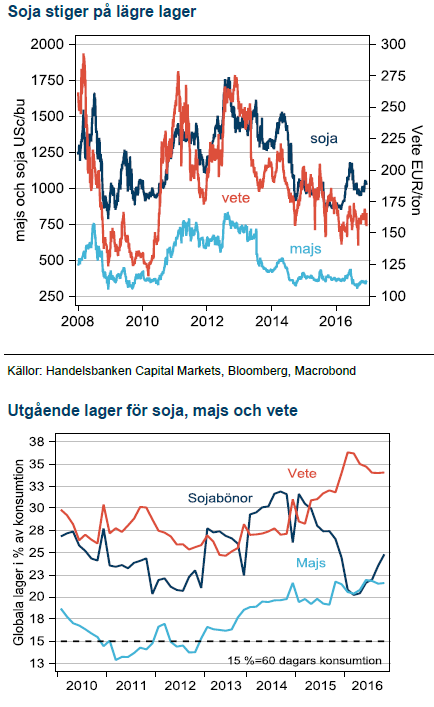
Fokus för de tre stora grödorna, soja, majs och vete har varit återställande av globala lagernivåer efter USA:s torka 2012. Efter flera bra skördeår har höga lager pressat de närmsta terminerna. Vi tror att den cykeln nu har toppat och temat för 2017 kommer vara att lagren på vissa håll inte skapar samma prispress längre.
Globala lager är höga, det sticker vi inte under stol med. De är dock allokerade mycket ojämnt. Oproportionellt stora volymer ligger i Kina där vi alltid är skeptiska till pålitligheten i data –speciellt för lager och jordbruksprodukter. Dessutom är Kina inte delaktig i global handel för andra grödor än soja, vilket minskar betydelsen av höga kinesiska lager.
Avkastningen avgör
Om lagercykeln toppat ur och global efterfrågan är stark kommer tillväxt i konsumtionen att sänka lagren. Exakt hur det blir i slutänden avgörs av avkastningen för varje gröda. Ännu ligger odlingsåret i sin linda och det är för tidigt att sia om avkastningens prispåverkan utöver det som redan är känt, och därmed inprisat. Vi nöjer oss därför med att tro på relativspelet mellan soja och majs, med lägst lager, och högst andel i Kina jämfört med vete, som fortfarande har högre lager. Vi tänker oss en svag nedgång för vete där vi räknar med att december 2017 terminen slutar på 160, omkring 7% lägre än dagens pris. När lagren faller räknar vi också med en mindre brant kurva. Vi räknar med att vetelager faller med omkring 10 % medan lager för soja och majs faller omkring 15-20% som ett resultat av låga priser, år med rekordavkastning bakom oss och växande efterfrågan.
Oljepriset påverkar
Vår förändrade syn på oljepriset, från förut USD 40 för 2017 till nu USD 60 påverkar spannmålsprisernamed högre produktionskostnad vilket tenderar att få marknaden att handla uppåt, speciellt i en miljö då lager faller. Dessutom gynnas efterfrågan och priset på majs och soja från ökade alternativkostnader i bränslesegmentet.
Trots tvivel tror vi att Trump kommer att fortsätta gynna biobränslen då det tillsammans med inhemsk råoljeproduktion minskar importberoendet från OPEC och Mellanöstern.


The latest weekly report from the US DOE showed a substantial drawdown across key petroleum categories, adding more upside potential to the fundamental picture.

Commercial crude inventories (excl. SPR) fell by 5.8 million barrels, bringing total inventories down to 415.1 million barrels. Now sitting 11% below the five-year seasonal norm and placed in the lowest 2015-2022 range (see picture below).
Product inventories also tightened further last week. Gasoline inventories declined by 2.1 million barrels, with reductions seen in both finished gasoline and blending components. Current gasoline levels are about 3% below the five-year average for this time of year.
Among products, the most notable move came in diesel, where inventories dropped by almost 4.1 million barrels, deepening the deficit to around 20% below seasonal norms – continuing to underscore the persistent supply tightness in diesel markets.
The only area of inventory growth was in propane/propylene, which posted a significant 5.1-million-barrel build and now stands 9% above the five-year average.
Total commercial petroleum inventories (crude plus refined products) declined by 4.2 million barrels on the week, reinforcing the overall tightening of US crude and products.


A classic case of “buy the rumor, sell the news” played out in oil markets, as Brent crude has dropped sharply – down nearly USD 10 per barrel since yesterday evening – following Iran’s retaliatory strike on a U.S. air base in Qatar. The immediate reaction was: “That was it?” The strike followed a carefully calibrated, non-escalatory playbook, avoiding direct threats to energy infrastructure or disruption of shipping through the Strait of Hormuz – thus calming worst-case fears.
After Monday morning’s sharp spike to USD 81.4 per barrel, triggered by the U.S. bombing of Iranian nuclear facilities, oil prices drifted sideways in anticipation of a potential Iranian response. That response came with advance warning and caused limited physical damage. Early this morning, both the U.S. President and Iranian state media announced a ceasefire, effectively placing a lid on the immediate conflict risk – at least for now.
As a result, Brent crude has now fallen by a total of USD 12 from Monday’s peak, currently trading around USD 69 per barrel.
Looking beyond geopolitics, the market will now shift its focus to the upcoming OPEC+ meeting in early July. Saudi Arabia’s decision to increase output earlier this year – despite falling prices – has drawn renewed attention considering recent developments. Some suggest this was a response to U.S. pressure to offset potential Iranian supply losses.
However, consensus is that the move was driven more by internal OPEC+ dynamics. After years of curbing production to support prices, Riyadh had grown frustrated with quota-busting by several members (notably Kazakhstan). With Saudi Arabia cutting up to 2 million barrels per day – roughly 2% of global supply – returns were diminishing, and the risk of losing market share was rising. The production increase is widely seen as an effort to reassert leadership and restore discipline within the group.
That said, the FT recently stated that, the Saudis remain wary of past missteps. In 2018, Riyadh ramped up output at Trump’s request ahead of Iran sanctions, only to see prices collapse when the U.S. granted broad waivers – triggering oversupply. Officials have reportedly made it clear they don’t intend to repeat that mistake.
The recent visit by President Trump to Saudi Arabia, which included agreements on AI, defense, and nuclear cooperation, suggests a broader strategic alignment. This has fueled speculation about a quiet “pump-for-politics” deal behind recent production moves.
Looking ahead, oil prices have now retraced the entire rally sparked by the June 13 Israel–Iran escalation. This retreat provides more political and policy space for both the U.S. and Saudi Arabia. Specifically, it makes it easier for Riyadh to scale back its three recent production hikes of 411,000 barrels each, potentially returning to more moderate increases of 137,000 barrels for August and September.
In short: with no major loss of Iranian supply to the market, OPEC+ – led by Saudi Arabia – no longer needs to compensate for a disruption that hasn’t materialized, especially not to please the U.S. at the cost of its own market strategy. As the Saudis themselves have signaled, they are unlikely to repeat previous mistakes.
Conclusion: With Brent now in the high USD 60s, buying oil looks fundamentally justified. The geopolitical premium has deflated, but tensions between Israel and Iran remain unresolved – and the risk of missteps and renewed escalation still lingers. In fact, even this morning, reports have emerged of renewed missile fire despite the declared “truce.” The path forward may be calmer – but it is far from stable.
Analys
A muted price reaction. Market looks relaxed, but it is still on edge waiting for what Iran will do
Brent crossed the 80-line this morning but quickly fell back assigning limited probability for Iran choosing to close the Strait of Hormuz. Brent traded in a range of USD 70.56 – 79.04/b last week as the market fluctuated between ”Iran wants a deal” and ”US is about to attack Iran”. At the end of the week though, Donald Trump managed to convince markets (and probably also Iran) that he would make a decision within two weeks. I.e. no imminent attack. Previously when when he has talked about ”making a decision within two weeks” he has often ended up doing nothing in the end. The oil market relaxed as a result and the week ended at USD 77.01/b which is just USD 6/b above the year to date average of USD 71/b.

Brent jumped to USD 81.4/b this morning, the highest since mid-January, but then quickly fell back to a current price of USD 78.2/b which is only up 1.5% versus the close on Friday. As such the market is pricing a fairly low probability that Iran will actually close the Strait of Hormuz. Probably because it will hurt Iranian oil exports as well as the global oil market.
It was however all smoke and mirrors. Deception. The US attacked Iran on Saturday. The attack involved 125 warplanes, submarines and surface warships and 14 bunker buster bombs were dropped on Iranian nuclear sites including Fordow, Natanz and Isfahan. In response the Iranian Parliament voted in support of closing the Strait of Hormuz where some 17 mb of crude and products is transported to the global market every day plus significant volumes of LNG. This is however merely an advise to the Supreme leader Ayatollah Ali Khamenei and the Supreme National Security Council which sits with the final and actual decision.
No supply of oil is lost yet. It is about the risk of Iran closing the Strait of Hormuz or not. So far not a single drop of oil supply has been lost to the global market. The price at the moment is all about the assessed risk of loss of supply. Will Iran choose to choke of the Strait of Hormuz or not? That is the big question. It would be painful for US consumers, for Donald Trump’s voter base, for the global economy but also for Iran and its population which relies on oil exports and income from selling oil out of that Strait as well. As such it is not a no-brainer choice for Iran to close the Strait for oil exports. And looking at the il price this morning it is clear that the oil market doesn’t assign a very high probability of it happening. It is however probably well within the capability of Iran to close the Strait off with rockets, mines, air-drones and possibly sea-drones. Just look at how Ukraine has been able to control and damage the Russian Black Sea fleet.
What to do about the highly enriched uranium which has gone missing? While the US and Israel can celebrate their destruction of Iranian nuclear facilities they are also scratching their heads over what to do with the lost Iranian nuclear material. Iran had 408 kg of highly enriched uranium (IAEA). Almost weapons grade. Enough for some 10 nuclear warheads. It seems to have been transported out of Fordow before the attack this weekend.
The market is still on edge. USD 80-something/b seems sensible while we wait. The oil market reaction to this weekend’s events is very muted so far. The market is still on edge awaiting what Iran will do. Because Iran will do something. But what and when? An oil price of 80-something seems like a sensible level until something do happen.


Hur säkrar vi Sveriges tillgång till kritiska metaller och mineral i en ny geopolitisk verklighet?

Lundin Mining ska bli en av de tio största kopparproducenterna i världen

Sommarvädret styr elpriset i Sverige

Samtal om flera delar av råvarumarknaden
Tightening fundamentals – bullish inventories from DOE

Stor uppsida i Lappland Guldprospekterings aktie enligt analys
Silverpriset släpar efter guldets utveckling, har mer uppsida

Uppgången i oljepriset planade ut under helgen

Låga elpriser i sommar – men mellersta Sverige får en ökning

Mahvie Minerals växlar spår – satsar fullt ut på guld
-
 Nyheter4 veckor sedan
Stor uppsida i Lappland Guldprospekterings aktie enligt analys
-
 Nyheter4 veckor sedan
Silverpriset släpar efter guldets utveckling, har mer uppsida
-
 Nyheter3 veckor sedan
Uppgången i oljepriset planade ut under helgen
-
 Nyheter3 veckor sedan
Låga elpriser i sommar – men mellersta Sverige får en ökning
-
 Nyheter2 veckor sedan
Mahvie Minerals växlar spår – satsar fullt ut på guld
-
Analys3 veckor sedan
Very relaxed at USD 75/b. Risk barometer will likely fluctuate to higher levels with Brent into the 80ies or higher coming 2-3 weeks
-

 Nyheter1 vecka sedan
Oljan, guldet och marknadens oroande tystnad
-

 Nyheter1 vecka sedan
Jonas Lindvall är tillbaka med ett nytt oljebolag, Perthro, som ska börsnoteras